Confidential: For Review Only
A novel mutation in the GFAP gene expands the phenotypeof Alexander Disease Journal: Journal of Medical Genetics
Manuscript ID jmedgenet-2018-105959.R1 Article Type: Short Report
Date Submitted by the Author: n/a
Complete List of Authors: Casasnovas, Carlos; Hospital Universitari de Bellvitge, Neurology; Institut d'Investigacio Biomedica de Bellvitge, Neurometabolic Disease Lab
Verdura, Edgard; Institut d'Investigacio Biomedica de Bellvitge, Neurometabolic Disease Lab
Vélez, Valentina; Hospital Universitari de Bellvitge, Neurology; Institut d'Investigacio Biomedica de Bellvitge, Neurometabolic Disease Lab Schlüter, Agatha; Institut d'Investigacio Biomedica de Bellvitge, Neurometabolic Disease Lab
Pons-Escoda, Albert; Hospital Universitari de Bellvitge, Neuroradiology Homedes, Christian; Hospital Universitari de Bellvitge, Neurology Ruiz, Montserrat; Institut d'Investigacio Biomedica de Bellvitge, Neurometabolic Disease Lab
Fourcade, Stéphane; Institut d'Investigacio Biomedica de Bellvitge, Neurometabolic Disease Lab
Launay, Nathalie; Institut d'Investigacio Biomedica de Bellvitge, Neurometabolic Disease Lab
Pujol, Aurora; Institut d'Investigacio Biomedica de Bellvitge, Neurometabolic Disease Lab
Keywords: GFAP, Alexander disease, WES, astrocyte hypertrophy
Note: The following files were submitted by the author for peer review, but cannot be converted to PDF. You must view these files (e.g. movies) online.
Supplementary File – Video. Presence of mild abnormalities in ocular movements (nistagmus) in patient III.5 (paucisintomatic).mp4
Confidential: For Review Only
1
A novel mutation in the GFAP gene expands the phenotype of Alexander Disease2
Carlos Casasnovas,1,2,3 Edgard Verdura,1,3 Valentina Vélez-Santamaria,1,2 Agatha Schlüter,1,33
Albert Pons-Escoda,4 Christian Homedes,2 Montserrat Ruiz,1,3 Stéphane Fourcade,1,3 Nathalie4
Launay,1,3 Aurora Pujol,1,3,55
1- Neurometabolic Diseases Laboratory, Bellvitge Biomedical Research Institute (IDIBELL),6
L'Hospitalet de Llobregat, Barcelona, Spain7
2- Neuromuscular Unit, Neurology Department, Hospital Universitari de Bellvitge,8
L’Hospitalet de Llobregat, Barcelona, Spain9
3- Centre for Biomedical Research on Rare Diseases (CIBERER), Instituto de Salud Carlos10
III, Spain.11
4- Neuroradiology Unit, Institut de Diagnòstic per la Imatge-IDI, Hospital Universitari de12
Bellvitge, L’Hospitalet de Llobregat, Spain13
5- Catalan Institution of Research and Advanced Studies (ICREA), Barcelona, Catalonia,14
Spain15
CC and EV contributed equally to this manuscript.16
17
Correspondence should be addressed to: Professor Aurora Pujol, Neurometabolic Diseases18
Laboratory, IDIBELL, Hospital Duran i Reynals, Gran Via 199, 08908 L’Hospitalet de19
Llobregat, Barcelona, Spain. Tel: +34 932607137; Fax: +34 932607414; Email:20
[email protected]21
Manuscript word count (excluding title page, abstract, references, figures and tables):22
1978 words 3 4 5 6 7 8 9 10 11 12 13 14 15 16 17 18 19 20 21 22 23 24 25 26 27 28 29 30 31 32 33 34 35 36 37 38 39 40 41 42 43 44 45 46 47 48 49 50 51 52 53 54 55 56 57 58 59 60Confidential: For Review Only
24
ABSTRACT25
Background: Alexander disease, an autosomal dominant leukodystrophy, is caused by26
missense mutations in GFAP. Although mostly diagnosed in children, associated with severe27
leukoencephalopathy, milder adult forms also exist.28
Methods: A family affected by adult-onset spastic paraplegia underwent neurological29
examination and cerebral MRI. Two patients were sequenced by WES. A candidate variant was30
functionally tested in an astrocytoma cell line.31
Results: The novel variant in GFAP N-terminal head domain (p.Gly18Val) cosegregated in32
multiple relatives (LOD score: 2.7). All patients, even those with the mildest forms, showed33
characteristic signal changes or atrophy in the brainstem and spinal cord MRIs, and abnormal34
MRS. In vitro, this variant did not cause significant protein aggregation, in contrast to most35
Alexander disease mutations characterized so far. However, cell area analysis showed larger36
size, a feature previously described in patients and mouse models.37
Conclusion: We suggest that this variant causes variable expressivity and an attenuated38
phenotype of Alexander Disease type II, probably associated with alternative pathogenic39
mechanisms, i.e. astrocyte enlargement. GFAP analysis should be considered in adult-onset40
neurologic presentations with pyramidal and bulbar symptoms, in particular when characteristic41
findings, such as the tadpole sign, are present in MRI. WES is a powerful tool to diagnose42
atypical cases.43
Keywords: “Alexander disease”, “GFAP”, “WES”, “astrocyte hypertrophy” 3 4 5 6 7 8 9 10 11 12 13 14 15 16 17 18 19 20 21 22 23 24 25 26 27 28 29 30 31 32 33 34 35 36 37 38 39 40 41 42 43 44 45 46 47 48 49 50 51 52 53 54 55 56 57 58 59Confidential: For Review Only
45
INTRODUCTION46
Missense gain-of-function mutations in GFAP are the only known cause of Alexander disease, a47
rare neurodegenerative disorder pathologically defined by white matter degeneration and the48
presence of characteristic Rosenthal fibres (intracytoplasmic inclusions in astrocytes).1, 2 In49
infantile cases (Alexander Disease type I), patients present developmental delay, macrocephaly,50
seizures and progressive encephalopathy, leading to death within the first decade. MRI shows51
leukoencephalopathy without brainstem abnormalities.3 Later-onset cases (Alexander Disease52
type II) present wide phenotypic variability, with symptoms such as ataxia, spastic paraparesis,53
palatal tremor, abnormal ocular movements, and bulbar or pseudobulbar symptoms.4 Additional54
neurologic signs such as dysautonomia, urinary disturbances and sleep disorders are often55
described.5 Atypical features, including scoliosis, mild cognitive deficit, parkinsonism, seizures,56
peripheral neuropathy or microcoria, have been reported.6-8 MRI shows little cerebral white57
matter involvement and is characterized by atrophy and signal intensity changes in the58
brainstem.959
Although most GFAP mutations occur de novo, adult-onset Alexander disease has also been60
described in familial cases with autosomal dominant transmission.7 In this work, we report a61
family affected by ocular movement abnormalities and mild signs of pyramidal involvement, in62
which a rare variant of the GFAP gene was found by whole exome sequencing (WES). Based63
on clinical data and functional studies, we suggest that this variant is less deleterious than the64
vast majority of Alexander disease mutations, giving rise to an attenuated clinical phenotype.65
RESULTS66
A 46-year-old Caucasian woman (Figure 1, patient II:3) presented with a 2-year history of67
spasticity and lower limb weakness. Cranial and cervical MRI was initially reported as normal.68
She denied a history of neurological disease in her family, except for a maternal cousin (patient69
II:5), who had "gait problems”. She also mentioned that her 16-year-old son (patient III:4) had 3 4 5 6 7 8 9 10 11 12 13 14 15 16 17 18 19 20 21 22 23 24 25 26 27 28 29 30 31 32 33 34 35 36 37 38 39 40 41 42 43 44 45 46 47 48 49 50 51 52 53 54 55 56 57 58 59 60Confidential: For Review Only
70
frequent falls and mild difficulties in running starting at 9 years old, similar to her cousin’s son71
(patient III:5). After ruling out acquired causes we tested spastic paraparesis genes (SPG3,72
SPG4, SPG10 and SPG11) and ABCD1 gene (X-linked adrenomyeloneuropathy), with negative73
results. Genetic tests for hereditary ataxias were also negative. In a final attempt to elucidate this74
disease, we included the family in a research protocol and carried out WES on patients II:5 and75
III:4. WES analysis revealed 5 rare variants shared by both patients. Only one variant76
cosegregated in all 4 affected relatives (II:3, II:5, III:4 and III:5); an heterozygous missense77
variant in the GFAP gene, p.Gly18Val. Mutations in this gene cause Alexander disease (OMIM78
#203450), an autosomal dominant leukodystrophy with described adult presentations.1, 4 This79
variant was not previously associated with Alexander disease, nor was it present in databases of80
control individuals (1000 Genomes, ExAC, and gnomAD). Segregation analysis indicated that81
this variant was also carried by two asymptomatic family members (I:2 and II:2). We therefore82
decided to clinically re-evaluate all family members and found abnormalities in ocular83
movements and pyramidal involvement in both two patients. In conclusion, this family showed84
variable disease expressivity among 4 patients exhibiting clear signs of disease and 285
paucisymptomatic individuals who presented alterations in neurological examination but had no86
complaints nor symptoms (patients I:2 and II:2). The age of clinical onset ranged from 9 to 4687
years, and age at diagnosis ranged from 16 to 73 years. Clinical findings are summarized in88
Supplemental Table 1, and Supplemental Video 1 shows movement abnormalities in patient89
III:5.90
In patients II:3, II:5, III:4 and III:5, symptoms at disease onset included asymmetric proximal91
lower limb weakness due to pyramidal involvement, which was associated with proximal upper92
limb weakness in patient II:5. All four subjects had gait difficulties due to spastic paraparesis.93
Patients II:3 and II:5, aged 49 and 48 years old at first examination, needed unilateral support to94
walk. Patients II:3 and II:5 referred urinary disturbances; urodynamic study of patient II:395
confirmed detrusor overactivity. All patients showed abnormalities in ocular movement, with96
gaze-evoked nystagmus without ptosis, diplopia or alterations in saccadic pursuit; brisk tendon3 4 5 6 7 8 9 10 11 12 13 14 15 16 17 18 19 20 21 22 23 24 25 26 27 28 29 30 31 32 33 34 35 36 37 38 39 40 41 42 43 44 45 46 47 48 49 50 51 52 53 54 55 56 57 58 59
Confidential: For Review Only
97
reflexes/hyperreflexia; extensor plantar responses; and Hoffman sign. Patients II:2, II:3, III:498
and III:5 presented mild scoliosis.99
An exhaustive MRI re-evaluation of patient II:3 revealed signal changes and medullar atrophy.100
Brain and spinal cord MRI study were then extended to patients II:2, II:5, III:4 and III:5. All101
patients showed a mild signal change in T2/FLAIR sequences in the brainstem, specifically in102
the medulla and cervical spinal cord. This is illustrated by MRI images of patient II:3, in which103
signal change is visible in midbrain (Figure 1B), medulla (Figure 1C) and the spinal cord104
(Figure 1D). Furthermore, patients II:3, II:5, III:4 and III:5 showed the characteristic “tadpole105
sign”: some degree of atrophy of the cerebellum, medulla and spinal cord with a well-preserved106
pontine base, markedly characteristic of Alexander disease (illustrated in Figure 1E).10 The107
paucisymptomatic Patient II:2, had no atrophy, nor tadpole sign, but showed signal change in108
the medulla and spinal cord (Figure 1F, 1G). MR Spectroscopy was carried out in patients II.2,109
II.3, II.5, and III.4, with voxels centered in the area of signal and morphologic abnormality. All110
patients showed highly elevated levels of myo-inositol and choline with a decreased totalN-111
acetyl-aspartate in the ponto-medullary junction (Figure 1H, 1I, Supplemental Figure 1), a112
feature described in Alexander Disease.11,12 Radiological findings are summarized in113
Supplemental Table 2 and illustrated in Figure 1 and Supplemental Figure 1.114
This GFAP gene variant (chr17:42992802C>A GRCh37; NM_001131019: c.53G>T;115
p.Gly18Val), found in all affected family members, was located in GFAP’s N-terminal head116
domain, which plays an important role in self-assembly process.13 This is the most N-terminal117
variant ever described. However, this residue is not strongly conserved in evolution, missense118
predictors were not conclusive, and no other pathogenic variants are known in the vicinity.119
When considering all genotyped individuals, this variant reached a maximum LOD score of 2.7120
(odds of ~500 to 1 supporting linkage of this locus to the disease). By applying the American121
College of Medical Genetics (ACMG) criteria for variant interpretation to assess this nucleotide122
change14, we reached a classification of VUS (Variant of Unknown Significance), and thus123
decided to functionally validate this variant using a transfection assay to test the capacity of the3 4 5 6 7 8 9 10 11 12 13 14 15 16 17 18 19 20 21 22 23 24 25 26 27 28 29 30 31 32 33 34 35 36 37 38 39 40 41 42 43 44 45 46 47 48 49 50 51 52 53 54 55 56 57 58 59 60
Confidential: For Review Only
124
GFAP protein carrying p.Gly18Val to induce protein aggregation in the astrocytoma cell line125
U251-MG (Supplemental methods).15, 16 We utilized two GFAP-EGFP control constructs, one126
containing the wild-type GFAP sequence, and the second incorporating the p.Arg239Cys127
mutation, a widely used positive control for GFAP protein aggregation. As described elsewhere,128
transfection of the WT construct showed large inclusions in ~20% of transfected cells17, 18, both129
after 24h or 48h of transfection. Cells transfected with the p.Arg239Cys-mutated construct130
showed the same large inclusions, but also dot-like clumps or aggregates, as reported 15, 16,131
which in some cases were distributed around the cell and in other cases converged and formed132
large aggregates near the cell nucleus, in particular at 48h after transfection (Figure 2A). In133
contrast, after transfecting the p.Gly18Val-mutant construct we did not observe aggregates134
similar to the p.Arg239Cys construct, but rather, cells showed an aspect comparable to WT135
cells, but with lesser inclusions (Supplemental Figure 2A, 2B). This effect was more clear at136
shorter transfection times (24h) or lower amounts of construct (1µg) (Figure 2A). Interestingly,137
in the p.Gly18Val condition we observed abnormally large cell sizes, with long astrocytic138
processes, a phenotype which was confirmed by quantitative image analysis (Figure 2B).139
DISCUSSION140
We present a family affected by a dominantly inherited neurological disease, characterized by141
mild to moderate late-onset cerebellar and pyramidal signs, showing signal abnormalities or142
atrophy in the brainstem and spinal cord, in whom we identified a candidate variant in GFAP143
using WES, segregating even in asymptomatic individuals. Clinical re-evaluation of all family144
members combined with functional validation of the novel variant ultimately led to a definitive145
diagnosis of familial Alexander disease type II.146
Clinically, Alexander disease type II presents with cerebellar ataxia, pyramidal involvement,147
bulbar symptoms and palatal tremor. It is accompanied by variable MRI findings, although most148
cases present the “tadpole sign” .10 In this family, four patients showed clear signs of cerebellar149
dysfunction, with mild ataxia, alteration of ocular movements and spastic paraparesis with3 4 5 6 7 8 9 10 11 12 13 14 15 16 17 18 19 20 21 22 23 24 25 26 27 28 29 30 31 32 33 34 35 36 37 38 39 40 41 42 43 44 45 46 47 48 49 50 51 52 53 54 55 56 57 58 59
Confidential: For Review Only
150
hyperreflexia and extensor plantar responses, and two patients were paucisymptomatic,151
presenting mild alterations in neurological examination, namely, scoliosis, nystagmus, diplopia,152
hyperreflexia and the Babinski sign. MRI images of all symptomatic patients showed notable153
atrophy of the spinal cord and medulla, in contrast to what was observed in the less affected154
patients, who presented mild signal changes in the trunk and less atrophy. We nonetheless wish155
to emphasize that all patients except one (patient II:2) presented the previously mentioned156
tadpole sign. Moreover, MRS on patients II.2, II.3, II.5, and III.4 showed a metabolite profile157
suggesting hypertrophy of astrocytes as previously discussed 11, consistent with neuroaxonal158
degeneration.12 This underscores our in vitro findings showing size enlargement of astrocytes.159
Indeed, no dot-like clumps or protein aggregates were found for the p.Gly18Val GFAP160
construct in our functional study, in contrast to most other pathogenic variants described in the161
literature.7,15 We also detected lesser inclusions than the WT construct, in particular when162
transfected with lesser amounts of plasmid. However, we detected an increased size in163
p.Gly18Val-transfected cells when compared to the WT and p.Arg239Cys constructs. Astrocyte164
hypertrophy is a known consequence of GFAP mutations in Alexander disease, as observed in165
mouse models and patient’s necropsies.19, 20 It is possible that astrocyte hypertrophy has been166
historically overlooked for other mutations in vitro due to the strong specificity of GFAP167
aggregates. We thus propose considering astrocyte hypertrophy as an additional criterion of168
pathogenicity in the functional evaluation of unreported variants.169
Although we did not have access to brain biopsies from these patients, the absence of strong170
pathological signs in MRI and milder clinical manifestations in this family are compatible with171
the results of the aggregation assay for p.Gly18Val. This expansion of the clinical spectrum of172
Alexander disease suggests that other adult-onset neurologic cases with overlapping ataxia and173
pyramidal involvement may be caused by pathogenic GFAP variants. Therefore, screening of174
this gene would be recommended in presence of those symptoms and abnormal findings in175
MRI, even when these are subtle. An exhaustive and systematic clinical exploration of family176
members with milder forms or an absence of overt symptoms is recommended, since it may3 4 5 6 7 8 9 10 11 12 13 14 15 16 17 18 19 20 21 22 23 24 25 26 27 28 29 30 31 32 33 34 35 36 37 38 39 40 41 42 43 44 45 46 47 48 49 50 51 52 53 54 55 56 57 58 59 60
Confidential: For Review Only
177
lead to the identification of clinically unnoticed cases. This work underscores the usefulness of178
WES to identify paucisymptomatic or atypical cases, and proposes its implementation asfirst-179
tier test for neurogenetic conditions with adult presentations, with the goal of improving disease180
management and genetic counselling.181
Acknowledgements182
We thank CERCA Program/ Generalitat de Catalunya for institutional support. We also thank183
Juanjo Martínez, Cristina Guilera and Laia Grau for excellent technical assistance and184
Asociación Española contra las Leucodistrofias (ALE-ELA España).185
Contributors186
CC, EV, SF and AP designed and conceptualized the study. CC, EV, VV, AS, APE, CH, MR,187
and NL analysed and interpreted the data. CC, EV, VV and AP drafted the manuscript. All188
authors critically revised the manuscript.189
Funding190
This study was supported by the Centre for Biomedical Research on Rare Diseases (CIBERER)191
[ACCI14-759], Hesperia Foundation and the Secretariat for Universities and Research of the192
Ministry of Business and Knowledge of the Government of Catalonia [2017SGR1206] to AP,193
and Instituto de Salud Carlos III [PI14/00581] (Co-funded by European Regional Development194
Fund. ERDF, a way to build Europe) and la Marató de TV3 [345/C/2014] to CC. EV was195
funded by a grant of Ministerio de Economia, Industria y Competividad (Juan de la Cierva196
programme FJCI-2016-28811); SF was funded by Instituto de Salud Carlos III [Miguel Servet197
programme CPII16/00016] and MR and NL were funded by CIBERER.198
Competing interests199
The authors report no disclosures or conflicts of interest relevant to the manuscript.3 4 5 6 7 8 9 10 11 12 13 14 15 16 17 18 19 20 21 22 23 24 25 26 27 28 29 30 31 32 33 34 35 36 37 38 39 40 41 42 43 44 45 46 47 48 49 50 51 52 53 54 55 56 57 58 59
Confidential: For Review Only
200
Patient consent201
Informed consent was obtained from all participants in this study.202
Ethics approval203
The research project was approved by the Clinical Research Ethics Commitee for Research204
Ethics Committee of the Bellvitge University Hospital (PR076/14).205
Provenance and peer review206
Not commissioned; externally peer reviewed.207
Data sharing statement208
All data are in the submitted paper.3 4 5 6 7 8 9 10 11 12 13 14 15 16 17 18 19 20 21 22 23 24 25 26 27 28 29 30 31 32 33 34 35 36 37 38 39 40 41 42 43 44 45 46 47 48 49 50 51 52 53 54 55 56 57 58 59 60
Confidential: For Review Only
210
References211
1. Brenner M, Johnson AB, Boespflug-Tanguy O, et al. Mutations in GFAP, encoding212
glial fibrillary acidic protein, are associated with Alexander disease. Nat Genet213
2001;27(1):117-20.214
2. Messing A, Brenner M, Feany MB, et al. Alexander disease. J Neurosci215
2012;32(15):5017-23.216
3. van der Knaap MS, Naidu S, Breiter SN, et al. Alexander disease: diagnosis with MR217
imaging. AJNR Am J Neuroradiol 2001;22(3):541-52.218
4. Pareyson D, Fancellu R, Mariotti C, et al. Adult-onset Alexander disease: a series of219
eleven unrelated cases with review of the literature. Brain 2008;131(Pt 9):2321-31.220
5. Balbi P, Salvini S, Fundaro C, et al. The clinical spectrum of late-onset Alexander221
disease: a systematic literature review. J Neurol 2010;257(12):1955-62.222
6. Brockmann K, Meins M, Taubert A, et al. A novel GFAP mutation and disseminated223
white matter lesions: adult Alexander disease? Eur Neurol 2003;50(2):100-5.224
7. Li R, Johnson AB, Salomons G, et al. Glial fibrillary acidic protein mutations in225
infantile, juvenile, and adult forms of Alexander disease. Ann Neurol2005;57(3):310-226
26.227
8. Sreedharan J, Shaw CE, Jarosz J, et al. Alexander disease with hypothermia,228
microcoria, and psychiatric and endocrine disturbances. Neurology 2007;68(16):1322-3.229
9. Graff-Radford J, Schwartz K, Gavrilova RH, et al. Neuroimaging and clinical features230
in type II (late-onset) Alexander disease. Neurology 2014;82(1):49-56.231
10. Namekawa M, Takiyama Y, Honda J, et al. Adult-onset Alexander disease with typical232
"tadpole" brainstem atrophy and unusual bilateral basal ganglia involvement: a case233
report and review of the literature. BMC Neurol 2010;10:21.234
11. van der Voorn JP, Pouwels PJ, Salomons GS, et al. Unraveling pathology in juvenile235
Alexander disease: serial quantitative MR imaging and spectroscopy of white matter.236
Neuroradiology 2009;51(10):669-75.237
12. Brockmann K, Dechent P, Meins M, et al. Cerebral proton magnetic resonance238
spectroscopy in infantile Alexander disease. J Neurol 2003;250(3):300-6.239
13. Inagaki M, Nakamura Y, Takeda M, et al. Glial fibrillary acidic protein: dynamic240
property and regulation by phosphorylation. Brain Pathol 1994;4(3):239-43.241
14. Richards S, Aziz N, Bale S, et al. Standards and guidelines for the interpretation of242
sequence variants: a joint consensus recommendation of the American College of243
Medical Genetics and Genomics and the Association for Molecular Pathology. Genet244
Med 2015;17(5):405-24.245
15. Bachetti T, Caroli F, Bocca P, et al. Mild functional effects of a novel GFAP mutant246
allele identified in a familial case of adult-onset Alexander disease. Eur J Hum Genet247
2008;16(4):462-70.248
16. Yoshida T, Sasayama H, Nakagawa M. The process of inducing GFAP aggregates in249
astrocytoma-derived cells is different between R239C and R416W mutant GFAP. A250
time-lapse recording study. Neurosci Lett 2009;458(1):11-4.251
17. Koyama Y, Goldman JE. Formation of GFAP cytoplasmic inclusions in astrocytes and252
their disaggregation by alphaB-crystallin. Am J Pathol 1999;154(5):1563-72.253
18. Moeton M, Stassen OM, Sluijs JA, et al. GFAP isoforms control intermediate filament254
network dynamics, cell morphology, and focal adhesions. Cell Mol Life Sci255
2015;73(21):4101-20.256
19. Sosunov A, Olabarria M, Goldman JE. Alexander disease: an astrocytopathy that257
produces a leukodystrophy. Brain Pathol 2018;28(3):388-398.258
20. Sosunov AA, Guilfoyle E, Wu X, et al. Phenotypic conversions of "protoplasmic" to259
"reactive" astrocytes in Alexander disease. J Neurosci 2013;33(17):7439-50.260
3 4 5 6 7 8 9 10 11 12 13 14 15 16 17 18 19 20 21 22 23 24 25 26 27 28 29 30 31 32 33 34 35 36 37 38 39 40 41 42 43 44 45 46 47 48 49 50 51 52 53 54 55 56 57 58 59Confidential: For Review Only
262
LEGENDS263
264
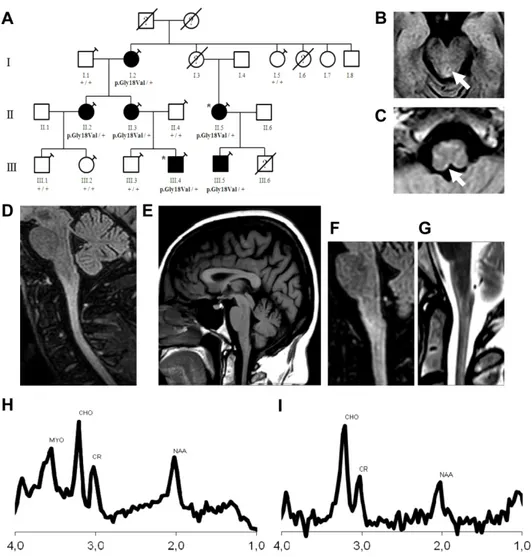
Figure 1: Family tree and genotype data for the p.Gly18Val variant and brain and265
cervical MRI and MRS of patients II.3 and II:2.266
(A) Family tree and genotype data for the p.Gly18Val variant. Square: male; circle: female;267
diagonal black line:deceased; black-filled symbol: affected individual; white-filled symbol:268
clinically healthy; question mark: unknown status; syringe symbol: blood sampled individual;269
asterisk: individual sequenced by Whole Exome Sequencing (WES). p.Gly18Val/+ stands for270
the presence of the p.Gly18Val variant in the heterozygous state, +/+ stands for the absence of271
this variant in the studied individual. E): Brain MRI images of patient II:3, symptomatic.(B-272
C): Axial fluid-attenuated inversion recovery (FLAIR) shows signal change in midbrain (B,273
arrow) and Subpial enhacement in medulla (C, arrow). (D): Sagittal fluid-attenuated inversion274
recovery (FLAIR) sequence shows spinal cord signal change and atrophy. (E): T1-weighted275
sagittal section shows the typical tadpole sign, with mild atrophy of medulla and cervical spinal276
cord and sparing the pons. (F-G): Brain MRI of patient II:2, paucisymptomatic, who presents277
with subtile signs of piramidal and bulbar involvement but no complaints. (F): Sagittalfluid-278
attenuated inversion recovery (FLAIR) sequence and (G): Sagittal T2-weighted sequence show279
absence of atrophy of the brainstem, but demonstrates spinal cord signal change. (H-I): Mean280
spectra of Proton MRS of Patients II:2, II:3, II:5, III:4 in the medulla-cord junction, at short281
(30ms, Image H) and long (136ms, Image I) TE. Images show high myoinositol (MYO) and282
choline (CHO) in contrast to low N-acetylaspartate (NAA).283
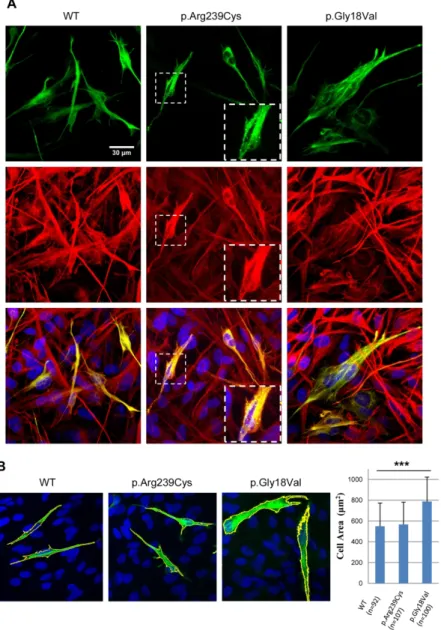
Figure 2: Absence of aggregates and cell area enlargement in GFAP-EGFPGly18Val-284
transfected U251-MG cells.285
A) Images showing transfected U251-MG cells. Green: EGFP fluorescence; red: GFAP; yellow:286
merged images showing colocalization with EGFP and GFAP in transfected cells. Blue287
indicates DAPI staining. In the second column, magnifications are shown in the lower right288
corner. B) Representative confocal microscopy images (63x) show U251-MG astrocytoma cells3 4 5 6 7 8 9 10 11 12 13 14 15 16 17 18 19 20 21 22 23 24 25 26 27 28 29 30 31 32 33 34 35 36 37 38 39 40 41 42 43 44 45 46 47 48 49 50 51 52 53 54 55 56 57 58 59 60
Confidential: For Review Only
289
transfected with vectors expressing GFAP-EGFPWT, GFAP-EGFPArg239Cys, orGFAP-290
EGFPGly18Val. In the p.Gly18Val image, two representative enlarged transfected cells are shown.291
The cell area of the transfected cells is shown as a box plot. Error bars indicate the standard292
deviations of two independent experiments. ***, p<0.001. Green: GFAP-EGFP; blue: DAPI;293
yellow outlining: area considered for cell area measurement.294
Supplemental Material Video 1: Presence of mild abnormalities in ocular movements295
(nystagmus) in patient III:5 (paucisymptomatic).3 4 5 6 7 8 9 10 11 12 13 14 15 16 17 18 19 20 21 22 23 24 25 26 27 28 29 30 31 32 33 34 35 36 37 38 39 40 41 42 43 44 45 46 47 48 49 50 51 52 53 54 55 56 57 58 59
Confidential: For Review Only
Figure 1: Family tree and genotype data for the p.Gly18Val variant and brain and cervical MRI and MRS of patients II.3 and II:2.
162x162mm (300 x 300 DPI) 3 4 5 6 7 8 9 10 11 12 13 14 15 16 17 18 19 20 21 22 23 24 25 26 27 28 29 30 31 32 33 34 35 36 37 38 39 40 41 42 43 44 45 46 47 48 49 50 51 52 53 54 55 56
Confidential: For Review Only
Figure 2: Absence of aggregates and cell area enlargement in GFAP-EGFPGly18Val-transfected U251-MG cells. 3 4 5 6 7 8 9 10 11 12 13 14 15 16 17 18 19 20 21 22 23 24 25 26 27 28 29 30 31 32 33 34 35 36 37 38 39 40 41 42 43 44 45 46 47 48 49 50 51 52 53 54 55
Confidential: For Review Only
SUPPLEMENTARY METHODS
Detailed clinical studies
Blood cell counts, routine blood biochemical analysis, clotting measurement, thyroid function testing, autoantibody screening, and treponemal serology were performed. Levels of anti-glutamic decarboxylase, anti-human T-lymphotropic virus-I antibodies, anti-human immunodeficiency virus antibodies, ceruloplasmin, copper, very-long-chain fatty acids, vitamin B12 and folic acid were measured. Needle electromyography (abductor digiti minimi, spinalis thoracis and tibialis anterior muscles), surface antidromic sensory (sural and median nerves) and orthodromic motor (median, tibial or peroneal nerves) nerve conduction studies were obtained in all patients with an electromyography machine (Synergy, CareFusion, San Diego, CA 92130, EEUU). Genetic testing of the most strongly affected patients (II:3 and II:5) was performed by
Sanger sequencing and MLPA for the most common causes of spastic paraparesis (SPG3,
SPG4, SPG10 and SPG11), Sanger sequencing for X-linked adrenomyeloneuropathy (ABCD1, together with analysis of very-long-chain fatty acid levels), as well as dynamic expansion analysis in genes associated to spinocerebellar ataxia (1, 2, 3, 6, 7, 8, 10, 14, and 17), DRPLA, and Friedrich’s ataxia,with negative outcome.
Radiological assessment
In patients II:2, II:3, II:5, III:4 and III:5, a brain and spinal cord MRI scan was performed. Brain MRI protocol included T1 and T2 weighted, fluid attenuated inversion recovery (FLAIR) and diffusion- weighted imaging (DWI) sequences in the sagittal and axial planes. Spinal cord MRI protocol included T1 and T2 weighted and short tau inversion recovery (STIR) sequences in the sagittal and axial planes. All the exams were obtained indistinctly on a 1.5T or 3T scanner. MRI examinations were read by an unblinded neuroradiologist. A systematic evaluation of periventricular signal changes, the periventricular rim of decreased T2 signal and increased T1 signal, brainstem enhancement or signal change, brainstem atrophy, spinal cord atrophy, spinal
3 4 5 6 7 8 9 10 11 12 13 14 15 16 17 18 19 20 21 22 23 24 25 26 27 28 29 30 31 32 33 34 35 36 37 38 39 40 41 42 43 44 45 46 47 48 49 50 51 52 53 54 55 56 57 58 59 60
Confidential: For Review Only
cord enhancement and signal change, cerebellar enhancement and signal change, "tadpole atrophy" of the brainstem with relative sparing of pons, ependymal nodularity and thalamic or basal ganglia signal abnormality was performed.
Short and long TE single voxel 1H MR spectroscopy (PRESS sequence, short TE=30ms, long TE=136ms) was performed for patients II:2, II:3, II:5 and III:2. The voxel was positioned on a three-dimensional FLAIR image centered in the area of signal and morphologic abnormality in the medulla/ cord-medulla junction. These exams were all acquired on a 3T scanner.
Molecular studies
Blood samples were obtained with informed consent. Genomic DNA was extracted from peripheral blood using standard methods. WES was performed on two patient DNA samples using the SureSelect XT Human All Exon V5 50 Mb kit (Agilent) for DNA capture and sequencing with the HiSeq 2000 Platform (Illumina) at CNAG (Centre Nacional d’Anàlisi Genòmica, Barcelona). We prioritized non-synonymous coding variants that had a frequency lower than 0.001 in the ExAC, 1000 genomes, and gnomAD databases and were present in both patients. Candidate variants were validated and tested for cosegregation in all available family members by Sanger sequencing. The logarithm of odds (LOD) score was calculated with the MERLIN package using the variant genotype as entry data.
Human GFAP full-length cDNA (NM_002055.4) was amplified by PCR excluding the stop codon using an MGC Human GFAP Sequence-Verified cDNA vector as a template (MHS6278-202757583, Dharmacon™) with primers incorporating EcoRI (forward) and BamHI (reverse) restriction sites. cDNA was cloned into the pEGFP-N3 vector (Clontech) upstream of the EGFP cDNA sequence, generating a GFAP-EGFP fusion cDNA in which EGFP was fused to the C-terminus of GFAP. A recurrent Alexander disease mutation used as a positive control (p.Arg239Cys)and the p.Gly18Val mutation were introduced through site-directed mutagenesis (QuikChange™ kit, Agilent) using the wild-type GFAP-EGFP fusion vector as a template. All
3 4 5 6 7 8 9 10 11 12 13 14 15 16 17 18 19 20 21 22 23 24 25 26 27 28 29 30 31 32 33 34 35 36 37 38 39 40 41 42 43 44 45 46 47 48 49 50 51 52 53 54 55 56 57 58 59
Confidential: For Review Only
The U-251 MG human astrocytoma cell line (Sigma-Aldrich) was maintained in DMEM (Gibco, Life Tech.) supplemented with 10% FBS, 100 U/ml penicillin, and 100 μg/mL streptomycin in a cell incubator at 5% CO2, 25°C. Cells were seeded into 6-well plates to 90% confluence in 24 h. Transfections were performed using 1 or 4 μg of GFAP-EGFP fusion vector (wild type (WT), p.Arg239Cys or p.Gly18Val) and 3 μl Lipofectamine 2000 per well (Life Tech.) diluted in Opti-MEM I medium (GibcoTM-ThermoFisher). After transfection for 3 hours, cells were cultured for 24 or 48 h and then fixed in 4% PFA. For colocalization studies, immunocytochemistry was performed using Polyclonal Rabbit Anti-Glial Fibrillary Acidic Protein Z0334 antibody (1/500, Dako) and Goat Anti-Rabbit IgG Alexa Fluor 555 A-21428 (1/1000, Dako). DAPI was used to stain cell nuclei.
Confocal microscopy images were acquired with a Leica TCS SL laser scanning confocal spectral microscope using a 63x objective. To analyse GFAP networks and aggregates in detail, a 4x zoom was used. Cell area was determined with ImageJ via analysing GFAP-EGFP fluorescence by using the “Analyse particles” tool. A minimum number of 40 cells was analysed per genotype and condition. Statistical significance was evaluated by a one-sided ANOVA test, followed by post hoc Tukey’s test.
3 4 5 6 7 8 9 10 11 12 13 14 15 16 17 18 19 20 21 22 23 24 25 26 27 28 29 30 31 32 33 34 35 36 37 38 39 40 41 42 43 44 45 46 47 48 49 50 51 52 53 54 55 56 57 58 59 60
Confidential: For Review Only
Supplemental Table 1. Clinical Findings
I:2 II:2 II:3 II:5 III:4 III:5
Sex F F F F M M Age of onset NA NA 46 17 10 9 Age of diagnosis 73 49 50 40 16 12 Nystagmus + + + + + + Spasticity - - + + + + Hyperreflexia + + + + + + Babinski sign + + + + + + Hoffman sign - + + + + + Gait abnormality + + + + + + Weakness - - + + + + Bladder dysfunction - - + + - - Scoliosis - + + - + + Palatal tremor - - - - - - Dysarthria / dysphagia - - - - - - Dysautonomia - - - - - -
F: Female, M: Male. + : Presence of the feature. - : Absence of the feature. NA: Not Available
3 4 5 6 7 8 9 10 11 12 13 14 15 16 17 18 19 20 21 22 23 24 25 26 27 28 29 30 31 32 33 34 35 36 37 38 39 40 41 42 43 44 45 46 47 48 49 50 51 52 53 54 55 56 57 58 59
Confidential: For Review Only
Supplemental Table 2. Radiological Findings
Case II:2 II:3 II:5 III:4 III:5
White Matter Changes No No No No No Periventricular Rim (T2 signal decreased/ T1 signal increased) No No No No No Brainstem Pial FLAIR Signal Change Medulla Medulla and midbrain (+)
Medulla Medulla Medulla
Brainstem Atrophy No Medulla
Mild Atrophy Medulla Mild Atrophy Medulla Mild Atrophy Medulla
Spinal Cord Signal Change
Cervical Cervical Cervical and
Dorsal Cervical Yes Spinal Cord Atrophy No Cervical and Dorsal Cervical and Dorsal Cervical and Dorsal Cervical and dorsal Tadpole Atrophy (*)
No Yes Yes Yes Yes
Enhancement Mild Medulla Mild Medulla No Mild Medulla Mild Medulla Middle Cerebellar Peduncle Involvement No No No No No Cerebellar / dentate findings Anomaly of venous draining No No No No Ependymal Nodularity No No No No No Thalamic / Basal Ganglia abnormality No No No No No
* : Atrophy of medulla and cervical cord with sparing pons
+ : Posterior periaqueductal 3 4 5 6 7 8 9 10 11 12 13 14 15 16 17 18 19 20 21 22 23 24 25 26 27 28 29 30 31 32 33 34 35 36 37 38 39 40 41 42 43 44 45 46 47 48 49 50 51 52 53 54 55 56 57 58 59 60
Confidential: For Review Only
Supplemental Image 1: Proton MRS of Patients II:2, II:3, II:5, III:4 in the medulla-cord junction. First column: short TE (30ms). Second column: long TE (136ms).
3 4 5 6 7 8 9 10 11 12 13 14 15 16 17 18 19 20 21 22 23 24 25 26 27 28 29 30 31 32 33 34 35 36 37 38 39 40 41 42 43 44 45 46 47 48 49 50 51 52 53 54 55 56 57 58 59
Confidential: For Review Only
Supplemental Figure 2: GFAP inclusions or aggregates in U251-MG transfected cells. In
blue: DAPI staining; Green: EGFP fluorescence. Transfection was carried out with 1 or 4 µg of plasmid per well (6-well plate), and pictures were taken 48h after. A) While WT and p.Gly18Val –transfected cells show GFAP-EGFP protein inclusions, p.Arg239Cys-transfected cells (positive control of aggregation) show the presence of little dot-like clumps or aggregates.. B) Quantification of GFAP inclusions in transfected U251-MG cells. Data are expressed as mean ± s.d. One-way ANOVA was performed, followed by post-hoc Tukey’s test.
3 4 5 6 7 8 9 10 11 12 13 14 15 16 17 18 19 20 21 22 23 24 25 26 27 28 29 30 31 32 33 34 35 36 37 38 39 40 41 42 43 44 45 46 47 48 49 50 51 52 53 54 55 56 57 58 59 60