Analysis of autophagy gene
polymorphisms in Spanish patients
with head and neck squamous cell
carcinoma
Javier Fernández-Mateos
1,2,3,4, Raquel Seijas-Tamayo
1,2, Juan Carlos Adansa Klain
1,2, Miguel
Pastor Borgoñón
5, Elisabeth Pérez-Ruiz
6, Ricard Mesía
7, Elvira del Barco
1,2, Carmen
Salvador Coloma
5, Antonio Rueda Dominguez
6, Javier Caballero Daroqui
5, Encarnación
Fernández Ruiz
8, Juan Jesús Cruz-Hernández
1,2,3,4& Rogelio González-Sarmiento
2,3,4Head and neck squamous cell carcinoma (HNSCC) is the sixth cancer on incidence worldwide. Tobacco and alcohol consumption are the most classical risk factors associated with its development. Autophagy process has a dual effect both in tumourigenesis and tumour suppressing activity. To investigate the importance of this pathway in HNSCC susceptibility, a risk factor matched case-control association study was performed with four candidate polymorphisms in autophagy genes (ATG2B, ATG5, ATG10, ATG16L1). We found an association between the variant in ATG10 rs1864183 and a higher susceptibility to develop laryngeal cancer, ATG2B rs3759601 and pharyngeal cancer and ATG16L1 rs2241880 and oral carcinoma. ATG5 rs2245214 SNP was not associated with any location. Overall, our results indicate the importance of the autophagy pathway in the susceptibility of head and neck squamous cell carcinoma and demonstrate the heterogeneity between its locations encompassed under a single terminology.
Head and neck cancer (HNC) groups a set of different tumours located in the upper aero-digestive via. It includes tumours located in the lips, oral cavity, pharynx (nasopharynx, oropharynx and hypopharynx) as well as larynx, salivary glands and thyroid glands among others1. It is the sixth cancer type on incidence worldwide. Approximately 600.000 new cases are diagnosed each year and only 40–50% reach the five-years survival rate2 causing an annual death of 271.000 patients3, 4. Not all HNC present similar histology, prevailing in 90% of cases the squamous cell carcinomas which initiate in the mucosa1.
Classic factors associated to the development of head and neck squamous cell carcinoma (HNSCC) are tobacco and alcohol consumption. At least 75% HNSCC are attributable to the combination of both carcinogens5, 6. Moreover, different epidemiological studies have revealed the existence of other related factors, both environmen-tal and genetic. In the last years the viral aetiology has been implicated in the development of HNSCC. This is the case of Epstein-Barr virus (EBV) in nasopharynx and the human papillomavirus (HPV), mainly subtype 16, in oral cavity and oropharynx tumours7. However, the carcinogenesis procedure triggered by viral infection identi-fies a totally different entity than the one produced by tobacco and alcohol8, 9. On the other hand, the observation of familial aggregations in HNSCC suggests the existence of genetic predisposition factors. Lots of case-control studies have determined this genetic susceptibility, increasing the risk between 2–4 times for first grade HNSCC patients family10.
1Medical Oncology Service, University Hospital of Salamanca-IBSAL, Salamanca, 37007, Spain. 2Biomedical
Research Institute of Salamanca (IBSAL), SACYL-University of Salamanca-CSIC, Salamanca, 37007, Spain.
3Molecular Medicine Unit- IBSAL, Department of Medicine, University of Salamanca, 37007, Salamanca, Spain. 4Institute of Molecular and Cellular Biology of Cancer (IBMCC), University of Salamanca-CSIC, Salamanca, 37007,
Spain. 5Medical Oncology Service, Hospital Universitario Politécnico La Fe, Valencia, 46026, Spain. 6Division of
Medical Oncology, Oncology department, Agencia Sanitaria Hospital Costa del Sol de Marbella, 29603, Marbella, Spain. 7Medical Oncology Department, Universitat de Barcelona, IDIBELL, Institut Català d’Oncologia, L’Hospitalet
de Llobregat, Barcelona, 08908, Spain. 8Otolaryngology Department, Agencia Sanitaria Hospital Costa del Sol
de Marbella, Marbella, 29603, Spain. Correspondence and requests for materials should be addressed to J.J.C.-H. (email: [email protected]) or R.G.-S. (email: [email protected])
Received: 10 February 2017 Accepted: 27 June 2017 Published: 31 July 2017
Aero digestive tract carcinogenesis involves altered carcinogen metabolism, a modified DNA repair, cell cycle disruption and deregulation of pathways implicated in immunity, inflammation and cellular components degra-dation11. Allelic variants of genes implicated in essential cellular pathways play a very important role in tumour development as well as in treatment response. Polymorphism is defined as that mutation or variant which is found in at least 1% of the general population. Single Nucleotide Polymorphism (SNP) is the most abundant form of genetic variation11.
Macro-autophagy is the catabolic process of damaged organelles or protein recycling under nutrient starva-tion or stress. It starts with the double-membrane autophagosome formastarva-tion and finishes with a fusion with the lysosomes to form the autophagolysosome which contains hydrolases for the degradation of the contents. This autophagosome complex is synthesised by autophagy-related genes (ATG)12. Autophagy takes part into both the initiation and prevention of cancer, and its function can be altered during tumour progression13. Although autophagy has a suppressing tumour activity, it is also involved in tumourigenesis by inhibiting cellular death and increasing drug resistance. It participates in important pathways connected to carcinogenesis as well as immune response, inflammation and genome stability14. However the precise mechanisms that involve autophagy in can-cer are not yet defined15. In HNSCC, autophagy mechanisms are still unknown and they can symbolize an impor-tant area for future research16.
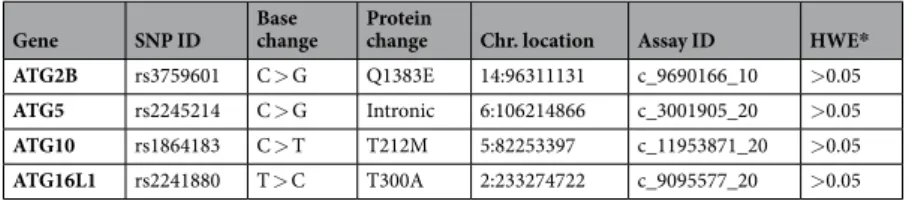
To achieve our aim a candidate gene analysis was performed to study SNPs in autophagy genes: ATG2B, ATG5, ATG10, ATG16L1 (Table 1) that could be associated to the risk to suffer HNSCC in a Spanish population. This association study was performed with a control group, selecting a cohort of subjects matched in gender, age and the two most important environmental factors involved in the development of HNSCC, tobacco and alcohol consumption, avoiding confounding variables and considering genetic background on its own.
Results
A total of 450 patients distributed in 213 cases of larynx carcinoma, 165 of pharynx carcinoma and 72 of oral cavity were included in the study. The descriptive study of the global analysis by location showed some statistical differences between sex, age, tobacco and alcohol intake (Table 2). For this reason, SNPs analysis was calculated with an adjustment for these variables in the different locations.
The global study of susceptibility in laryngeal cancer (Table 3) showed an association between the heterozy-gote genotype of ATG2B rs3759601 and a lower risk to develop laryngeal squamous cell carcinoma, p = 0.049 OR = 0.607 (0.369–0.999). Moreover, although not statistically significant a tendency in ATG10 rs1864183 was
Gene SNP ID Base change Protein change Chr. location Assay ID HWE* ATG2B rs3759601 C > G Q1383E 14:96311131 c_9690166_10 >0.05 ATG5 rs2245214 C > G Intronic 6:106214866 c_3001905_20 >0.05 ATG10 rs1864183 C > T T212M 5:82253397 c_11953871_20 >0.05 ATG16L1 rs2241880 T > C T300A 2:233274722 c_9095577_20 >0.05
Table 1. Autophagy polymorphisms analysed in the study. *Hardy-Weinberg equilibrium (HWE) calculated in
the control group.
Characteristics PATIENTS N = 450 CONTROLS N = 253 P-value LARYNX N = 213 P-value PHARYNX N = 165 P-value ORAL CAVITY N = 72 P-value N % N % N % N % N % Age (years) 61.97 ± 9.242 52.18 ± 12.752 0.000 62.96 ± 8.987 0.000 61.00 ± 9.086 0.000 61.29 ± 10.232 0.000 Sex Female 52 11.6 130 51.4 0.000 13 6.1 0.000 23 13.9 0.000 16 22.2 0.000 Male 398 88.4 123 48.6 200 93.9 142 86.1 56 77.8 Tobacco smoking Never 22 4.9 23 9.1 0.030 7 3.3 0.000 8 4.8 0.013 7 9.7 0.162 < 20 PPY 62 13.8 72 28.5 20 9.4 30 18.2 12 16.7 > 20 PPY 352 78.2 146 57.7 180 84.5 121 73.3 51 70.8 Missing 14 3.1 12 4.7 6 2.8 6 3.6 2 2.8
Packs per year 57.00 ± 36.512 31.88 ± 28.861 0.000 61.17 ± 35.498 0.000 54.91 ± 36.947 0.000 49.55 ± 37.366 0.000 Alcohol drinking Never 105 23.3 153 60.5 0.000 53 24.9 0.000 27 16.4 0.000 25 34.7 0.000 < 14 SDU/week 94 20.9 46 18.2 44 20.7 31 18.8 19 26.4 > 14 SDU/week 238 52.9 48 19.0 114 53.5 96 58.2 28 38.9 Missing 13 2.9 6 2.4 2 0.9 11 6.7 0 0 SDU/week 30.07 ± 39.349 9.02 ± 21.213 0.000 27.81 ± 37.008 0.000 36.27 ± 40.710 0.000 23.43 ± 41.553 0.000 Table 2. Descriptive case-control study. P-values related to controls. Statistically significant results in bold.
found. The heterozygous genotype had a close relationship with an increased risk to develop laryngeal cancer (p = 0.059, OR = 1.648) (Table 3).
Analysis in pharyngeal squamous cell carcinoma showed that carriers of GG genotype in the SNP ATG2B rs3759601 had an increased risk to develop this tumour, both in the codominant and the recessive model, p = 0.013 OR = 2.493 (1.212–5.129) (Table 3). No other associations were found in the rest of SNPs between cases and controls.
ATG16L1 rs2241880 was unequally distributed in oral cavity cancer (Table 3). Patients with the less common allele C had higher risk to suffer from oral cavity cancer in our sample, p = 0.017 in recessive model, OR = 2.214 (1.150–4.263).
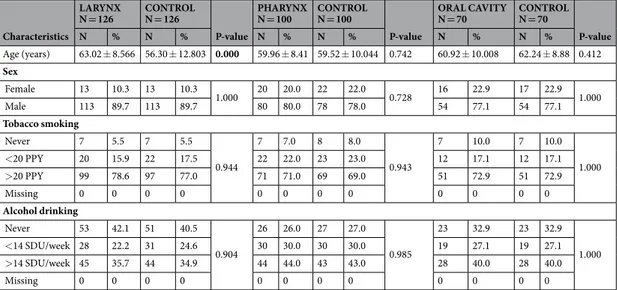
Due to the great significant differences in all the variables between groups, a second analysis was proposed by the Propensity Score method (PS). After its application we have totally paired 126 larynx, 100 pharynx and 70 oral cavity tumours according to sex, packs of tobacco per year (PPY) and standard drink units per week (SDU/ week) with their specific control groups (Table 4). This method allowed us to corroborate the previous analysis avoiding the possible confounding variables. Quantitative age was also included as an adjustment variable in the logistic regression analysis of the laryngeal susceptibility study due to the significant differences between groups in the ANOVA test (p-value < 0.05) (Table 4). Because of pharyngeal and oral cavity carcinomas were paired by age, adjustment by quantitative age was not necessary (Table 4).
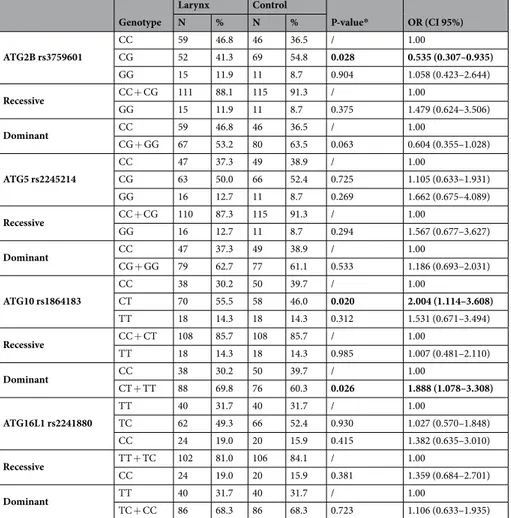
Once again, ATG2B rs3759601 heterozygote genotype was associated with a lower risk to develop laryngeal cancer p = 0.028 OR = 0.535 (0.307–0.935) (Table 5). Although not statistically significant in the previous anal-ysis (p = 0.059), we found a similar result in ATG10 rs1864183 and a higher risk to develop laryngeal cancer in patients carrying the T allele, p = 0.026 OR = 1.888 (1.078–3.308) in the dominant model.
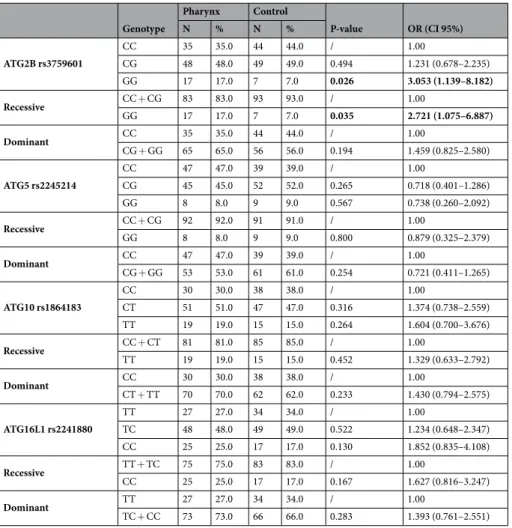
PS method corroborated the result in the previous analyses finding an association between ATG2B rs3759601 G allele and a higher risk to suffer from pharynx cancer (p = 0.035, OR = 2.721 (1.075–6.887)) (Table 6).
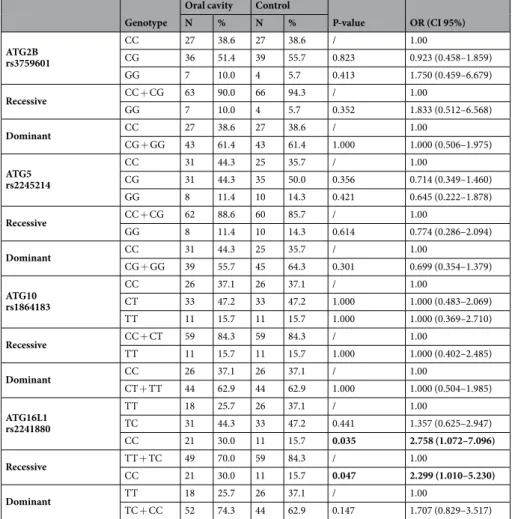
Finally, ATG16L1 rs2241880 CC genotypes still being associated with a higher risk to develop oral carcinoma after the PS application, p = 0.047 OR = 2.299(1.010–5.230) (Table 7).
Genotype
Control Larynx Pharynx Oral cavity
N % N % P-value OR (CI 95%) N % P-value OR (CI 95%) N % P-value OR (CI 95%) ATG2B rs3759601 CC 106 41.9 98 46.0 / 1.00 63 38.2 / 1.00 28 38.9 / 1.00 CG 119 47.0 88 41.3 0.049 0.607 (0.369–0.999) 80 48.5 0.749 1.091 (0.640–1.858) 36 50.0 0.720 1.120 (0.603–2.080) GG 28 11.1 27 12.7 0.921 1.041 (0.472–2.296) 22 13.3 0.016 2.613 (1.200–5.690) 8 11.1 0.522 1.391 (0.506–3.821) Recessive CC + CG 225 88.9 186 87.3 / 1.00 143 86.7 / 1.00 64 88.9 / 1.00 GG 28 11.1 27 12.7 0.444 1.339 (0.635–2.825) 22 13.3 0.013 2.493 (1.212–5.129) 8 11.1 0.583 1.301 (0.508–3.333) Dominant CC 106 41.9 98 46.0 / 1.00 63 38.2 / 1.00 28 38.9 / 1.00 CG + GG 147 58.1 115 54.0 0.103 0.675 (0.421–1.083) 102 61.8 0.282 1.317 (0.789–2.175) 44 61.1 0.630 1.158 (0.637–2.106) ATG5 rs2245214 CC 104 41.1 82 38.5 / 1.00 72 43.6 / 1.00 31 43.1 / 1.00 CG 124 49.0 105 49.3 0.369 1.256 (0.763–2.068) 79 47.9 0.624 0.879 (0.524–1.474) 31 43.1 0.348 0.744 (0.401–1.380) GG 25 9.9 26 12.2 0.274 1.551 (0.707–3.401) 14 8.5 0.638 0.810 (0.337–1.946) 10 13.9 0.611 1.272 (0.503–3.216) Recessive CC + CG 228 90.1 187 87.8 / 1.00 151 91.5 / 1.00 62 86.1 / 1.00 GG 25 9.9 26 12.2 0.406 1.364 (0.656–2.837) 14 8.5 0.743 0.870 (0.380–1.993) 10 13.9 0.380 1.480 (0.617–3.552) Dominant CC 104 41.1 82 38.5 / 1.00 72 43.6 / 1.00 31 43.1 / 1.00 CG + GG 149 58.9 131 61.5 0.272 1.307 (0.811–2.107) 93 56.4 0.574 0.867 (0.527–1.426) 41 56.9 0.531 0.831 (0.465–1.485) ATG10 rs1864183 CC 93 36.8 70 32.9 / 1.00 46 27.9 / 1.00 27 37.5 / 1.00 CT 115 45.4 116 54.4 0.059 1.648 (0.981–2.770) 86 52.1 0.127 1.537 (0.885–2.670) 34 47.2 0.452 1.274 (0.678–2.392) TT 45 17.8 27 12.7 0.946 1.026 (0.493–2.133) 33 20.0 0.201 1.594 (0.780–3.260) 11 15.3 0.875 0.931 (0.384–2.257) Recessive CC + CT 208 82.2 186 87.3 / 1.00 132 80.0 / 1.00 61 84.7 / 1.00 TT 45 17.8 27 12.7 0.415 0.760 (0.392–1.472) 33 20.0 0.517 1.232 (0.656–2.312) 11 15.3 0.612 0.812 (0.363–1.817) Dominant CC 93 36.8 70 32.9 / 1.00 46 27.9 / 1.00 27 37.5 / 1.00 CT + TT 160 63.2 143 67.1 0.118 1.484 (0.905–2.434) 119 72.1 0.100 1.552 (0.920–2.618) 45 62.5 0.587 1.180 (0.649–2.147) ATG16L1 rs2241880 TT 72 28.5 58 27.2 / 1.00 44 26.7 / 1.00 18 25.0 / 1.00 TC 130 51.3 108 50.7 0.597 1.157 (0.674–1.988) 81 49.1 0.551 1.194 (0.667–2.137) 31 43.1 0.860 1.066 (0.524–2.168) CC 51 20.2 47 22.1 0.312 1.414 (0.722–2.769) 40 24.2 0.166 1.647 (0.813–3.335) 23 31.9 0.039 2.304 (1.043–5.093) Recessive TT + TC 202 79.8 166 77.9 / 1.00 125 75.8 / 1.00 49 68.1 / 1.00 CC 51 20.2 47 22.1 0.389 1.288 (0.724–2.292) 40 24.2 0.205 1.469 (0.810–2.666) 23 31.9 0.017 2.214 (1.150–4.263) Dominant TT 72 28.5 58 27.2 / 1.00 44 26.7 / 1.00 18 25.0 / 1.00 TC + CC 181 71.5 155 72.8 0.436 1.226 (0.735–2.046) 121 73.3 0.332 1.313 (0.758–2.276) 54 75.0 0.321 1.393 (0.724–2.682) Table 3. Comparative results in selected ATG polymorphism distribution in laryngeal, pharyngeal and
oral cavity cancer related to controls. P value & OR adjusted by sex, age, packs per year and SDU per week. Statistically significant results in bold.
Discussion
HNSCC is consequence of genetic and environmental factors, mainly tobacco smoking and alcohol consumption. Autophagy is a complex pathway, modulated by different molecular mechanisms with an important interest in HNSCC development16. To show the possible association of polymorphisms in autophagy genes and the suscep-tibility to suffer these tumours, a multicentre case-control study of head and neck squamous cell carcinoma was performed. Four polymorphisms were selected in ATG genes involved in phagosome generation. This was the case of the exonic missense polymorphisms ATG2B rs3759601, ATG16L1 rs2241880 and ATG10 rs1864183, and the intronic mutation in ATG5 rs2245214 which involves changes in the recognition sites for SRp40 transcription factor. ATG5, ATG10 and ATG16L1 code for proteins that form the Atg5-Atg12-Atg16L1 conjugation complex17, while Atg2B is necessary for closure of isolation membranes of autophagosomes18.
Analysis of laryngeal cancer showed an association between the less common allele genotypes (CT + TT) in ATG10 rs1864183 and a higher risk to develop it. It has been described that a lower expression of autophagy genes (ATG) accelerate tumour development due to a diminution in autophagy process19. ATG10 rs1864183 C > T var-iant in exon 4 leads a catalytic change in the protein (Thr212Met) which causes a dysregulation in the autophago-some formation and a higher risk to develop breast cancer20. In this situation the cell cannot degrade a damaged organ, collecting damaging substances that cause an increase in DNA damage and carcinogenesis. Although this polymorphism has never been studied in HNSCC, this result indicates the importance of the autophagy pathway in laryngeal tumour. We could hypothesize that less common allele genotypes (CT + TT) could be related with a lower autophagy and accumulation of DNA damage, related with a higher risk to develop laryngeal squamous cell carcinoma.
Though only associated in ATG2B rs3759601 heterozygosity (CG), there was a statistically significant result related with a lower risk of develop laryngeal cancer. However this result is difficult to explain due to its non-significance in dominant models. Nevertheless, there was a positive association between the homozygous GG genotype in the same polymorphism and an increase risk to suffer from pharyngeal squamous cell carcinoma. In mammals, there are two ATG2 genes which are functionally redundant21. Atg2B is an essential protein in the autophagy process due to it is essential for the autophagosome and lipid droplets formation19, 22. Mutations in ATG2B gene have been associated with colorectal and gastric cancer14. Atg2B rs3759601 C > G SNP in exon 25 produces a protein change p.Gln1382Glu which could result in diminished autophagy and a higher risk to suffer pharyngeal cancer in our sample.
We did not find any significant result in the intronic ATG5 rs2245214 SNP distribution and HNSCC suscepti-bility. This result can be related with the position of this polymorphism in the intronic region 6 of the ATG5 gene and the consequence of ineffective change in the protein function.
Finally, we found an association in the distribution of CC genotypes in the dominant and recessive mod-els of ATG16L1 rs2241880 polymorphism and a higher risk to suffer from oral cavity squamous cell carcinoma. Autophagy-related 16-like 1 (ATG16L1) gene is a central adaptor in Atg5-Atg12-Atg16L1 complex formation and elongation of the autophagosome23. ATG16L1 variant rs2241880, a nonsynonymous 898 T > C polymorphism that encodes a threonine-to-alanine change (T300A), is associated with a decreased autophagy in Crohn's disease and higher inflammation23. In these studies CC genotype increases the secretion of TNF-α and IL-1β promoting a higher inflammation23. It has been also described that T300A variant enhances ATG16L1 cleavage by caspase 3, resulting in defective autophagy24 and chronic inflammatory state which increase Crohn´s disease susceptibility25 and colorectal cancer26. Likewise, it is known that ATG16L1-T300A SNP shows reduced affinity to bind the ATG16L1-binding motif and higher caspase-3 processing, causing a defective autophagy process27. Our results showed that CC genotypes were associated with an increased susceptibility to develop oral cavity squamous cell carcinoma maybe due to lower auto-phagy and a higher inflammation, a very important pathway implied in the aetiology of this tumour28.
Characteristics LARYNX N = 126 CONTROL N = 126 P-value PHARYNX N = 100 CONTROL N = 100 P-value ORAL CAVITY N = 70 CONTROL N = 70 P-value N % N % N % N % N % N % Age (years) 63.02 ± 8.566 56.30 ± 12.803 0.000 59.96 ± 8.41 59.52 ± 10.044 0.742 60.92 ± 10.008 62.24 ± 8.88 0.412 Sex Female 13 10.3 13 10.3 1.000 20 20.0 22 22.0 0.728 16 22.9 17 22.9 1.000 Male 113 89.7 113 89.7 80 80.0 78 78.0 54 77.1 54 77.1 Tobacco smoking Never 7 5.5 7 5.5 0.944 7 7.0 8 8.0 0.943 7 10.0 7 10.0 1.000 <20 PPY 20 15.9 22 17.5 22 22.0 23 23.0 12 17.1 12 17.1 >20 PPY 99 78.6 97 77.0 71 71.0 69 69.0 51 72.9 51 72.9 Missing 0 0 0 0 0 0 0 0 0 0 0 0 Alcohol drinking Never 53 42.1 51 40.5 0.904 26 26.0 27 27.0 0.985 23 32.9 23 32.9 1.000 <14 SDU/week 28 22.2 31 24.6 30 30.0 30 30.0 19 27.1 19 27.1 >14 SDU/week 45 35.7 44 34.9 44 44.0 43 43.0 28 40.0 28 40.0 Missing 0 0 0 0 0 0 0 0 0 0 0 0
Table 4. Descriptive case-control study matched by the Propensity Score method. P-values related to controls.
In conclusion, this study provides evidence of the putative role of some polymorphisms in autophagy genes as a genetic susceptibility factor in head and neck squamous cell carcinogenesis. This is the first autophagy suscep-tibility study in which cases and controls are matched by their risk factors, only taking into account their genetic background. Our finding emphasize the importance of autophagy in these tumours, the same as the heterogene-ity between locations include under the same term of head and neck cancer. Additional studies in larger groups should be done and would be necessary to confirm our results.
Material and Methods
Study design.
The data presented here is part of a multicentre study of three years of duration coordinated by the Medical Oncology Department of the University Hospital of Salamanca with the collaboration of 20 Spanish hospitals, all of them belonging to the Spanish Head & Neck Cancer Cooperative Group (TTCC).The recruitment period extended from January 2012 to December 2014. The inclusion criteria were: adults diagnosed of HPV negative squamous cell carcinoma of larynx, pharynx or oral cavity. They were recruited in dif-ferent Spanish hospitals that participate in the project after signing a written informed consent designed for this project according to local rules. The protocol of TTCC-2010–05 was initially approved by the TTCC Executive Committee, and then by the local institutional review board of University Hospital of Salamanca, according to country regulations. The research was conducted in full accordance with the ethical standards laid down in the 1964 Declaration of Helsinki and its later amendments and was consistent with Good Clinical Practice guidelines and the applicable local regulatory requirements.
455 patients diagnosed of HNSCC were included in the study. Controls were hospitalized patients without personal or familial history of cancer trying to be paired with cases by age, sex, smoking and alcoholism habit. They were recruited in different departments of the 20 hospitals. The initial sample size calculated for the control group was the same than the number of patients included in the study. However, this size was not reached due to the restricted inclusion criteria, so finally only 259 controls were included.
The information into socio-demographic and data informed by patient questionnaires were collected by auto-application, being supervised by the member of the research team with the objective of correct filled. Tumour clinic-pathological data were collected by oncologists following the TNM grading system reported by the American Joint Committee on Cancer (AJCC). All data were treated with the security measures establish in
Genotype Larynx Control P-value* OR (CI 95%) N % N % ATG2B rs3759601 CC 59 46.8 46 36.5 / 1.00 CG 52 41.3 69 54.8 0.028 0.535 (0.307–0.935) GG 15 11.9 11 8.7 0.904 1.058 (0.423–2.644) Recessive CC + CG 111 88.1 115 91.3 / 1.00 GG 15 11.9 11 8.7 0.375 1.479 (0.624–3.506) Dominant CC 59 46.8 46 36.5 / 1.00 CG + GG 67 53.2 80 63.5 0.063 0.604 (0.355–1.028) ATG5 rs2245214 CC 47 37.3 49 38.9 / 1.00 CG 63 50.0 66 52.4 0.725 1.105 (0.633–1.931) GG 16 12.7 11 8.7 0.269 1.662 (0.675–4.089) Recessive CC + CG 110 87.3 115 91.3 / 1.00 GG 16 12.7 11 8.7 0.294 1.567 (0.677–3.627) Dominant CC 47 37.3 49 38.9 / 1.00 CG + GG 79 62.7 77 61.1 0.533 1.186 (0.693–2.031) ATG10 rs1864183 CC 38 30.2 50 39.7 / 1.00 CT 70 55.5 58 46.0 0.020 2.004 (1.114–3.608) TT 18 14.3 18 14.3 0.312 1.531 (0.671–3.494) Recessive CC + CT 108 85.7 108 85.7 / 1.00 TT 18 14.3 18 14.3 0.985 1.007 (0.481–2.110) Dominant CC 38 30.2 50 39.7 / 1.00 CT + TT 88 69.8 76 60.3 0.026 1.888 (1.078–3.308) ATG16L1 rs2241880 TT 40 31.7 40 31.7 / 1.00 TC 62 49.3 66 52.4 0.930 1.027 (0.570–1.848) CC 24 19.0 20 15.9 0.415 1.382 (0.635–3.010) Recessive TT + TC 102 81.0 106 84.1 / 1.00 CC 24 19.0 20 15.9 0.381 1.359 (0.684–2.701) Dominant TT 40 31.7 40 31.7 / 1.00 TC + CC 86 68.3 86 68.3 0.723 1.106 (0.633–1.935)
Table 5. Comparative results in selected ATG polymorphism distribution in risk factor-matched laryngeal
compliance with the Protection of Personal Data Organic Law 15/1999, 13th December, and safe-keeping by the
University Hospital of Salamanca in its specific hospital server. Global study recruitment procedures and data collection have been previously described29.
DNA isolation and genotyping.
DNA was extracted from leukocytes of peripheral blood tube by phenol-chloroform method. Four polymorphisms in important ATG genes (ATG2B rs3759601, ATG5 rs2245214, ATG10 rs1864183 and ATG16L1 rs2241880) were selected according to the following criteria: previously described association with illness susceptibility, >5% minor allele frequency in Caucasian population and published evidence of functionality. Genotyping of selected polymorphisms (Table 1) were analyzed by the allelic discrimination assay by TaqMan®
probes (Applied biosystems), with specific oligonucleotides to amplify the polymorphic sequences and two labelled probes with the fluorochrome VIC and FAM to detect both alleles of each polymorphism. The reaction was performed using the specific PCR Master Mix in the Step-One Plus Real-Time PCR system (Applied biosys-tems)30. To ensure the reproducibility, a 5% of random samples were re-genotyping. A total of 11 samples (5 patients and 6 controls) cannot be amplified due to low DNA quality rate and were excluded of the study.Statistical analysis.
Control group was tested for assumption of the Hardy-Weinberg equilibrium (HWE) by chi-squared test for each polymorphism (Table 1). The association between the different clinical and molecular variables was analyzed by cross tabs and the X2 test of Pearson. The Odds ratio (OR) and 95% confidence intervalswere calculated by a logistic regression analysis. It was considered the existence of statistically significant differences where the P-value was < 0.05. These analyses were performed with the statistical software SPSS v.21.0 (IBM).
Because of the lower inclusion of matched controls, the statistical analysis was realized in two different ways. Firstly, patients were stratified according to its location (larynx, pharynx and oral cavity) comparing with the global control group (Table 2). To take into account the possible confounding variables, it was made a statistical adjustment for sex, and the continuous variables of age, packs of tobacco per year (PPY) and standard drink units of alcohol per week (SDU/week).
Secondly, we used the Propensity Score method (PS), a statistical term applied to the potent matching technique to equate groups in a cohort study31. Through a logistic regression analysis introducing the confounders as predictive variables, the method provides a numeric probability of each predictor group32. PS allows to pair the cases with the
Genotype Pharynx Control P-value OR (CI 95%) N % N % ATG2B rs3759601 CC 35 35.0 44 44.0 / 1.00 CG 48 48.0 49 49.0 0.494 1.231 (0.678–2.235) GG 17 17.0 7 7.0 0.026 3.053 (1.139–8.182) Recessive CC + CG 83 83.0 93 93.0 / 1.00 GG 17 17.0 7 7.0 0.035 2.721 (1.075–6.887) Dominant CC 35 35.0 44 44.0 / 1.00 CG + GG 65 65.0 56 56.0 0.194 1.459 (0.825–2.580) ATG5 rs2245214 CC 47 47.0 39 39.0 / 1.00 CG 45 45.0 52 52.0 0.265 0.718 (0.401–1.286) GG 8 8.0 9 9.0 0.567 0.738 (0.260–2.092) Recessive CC + CG 92 92.0 91 91.0 / 1.00 GG 8 8.0 9 9.0 0.800 0.879 (0.325–2.379) Dominant CC 47 47.0 39 39.0 / 1.00 CG + GG 53 53.0 61 61.0 0.254 0.721 (0.411–1.265) ATG10 rs1864183 CC 30 30.0 38 38.0 / 1.00 CT 51 51.0 47 47.0 0.316 1.374 (0.738–2.559) TT 19 19.0 15 15.0 0.264 1.604 (0.700–3.676) Recessive CC + CT 81 81.0 85 85.0 / 1.00 TT 19 19.0 15 15.0 0.452 1.329 (0.633–2.792) Dominant CC 30 30.0 38 38.0 / 1.00 CT + TT 70 70.0 62 62.0 0.233 1.430 (0.794–2.575) ATG16L1 rs2241880 TT 27 27.0 34 34.0 / 1.00 TC 48 48.0 49 49.0 0.522 1.234 (0.648–2.347) CC 25 25.0 17 17.0 0.130 1.852 (0.835–4.108) Recessive TT + TC 75 75.0 83 83.0 / 1.00 CC 25 25.0 17 17.0 0.167 1.627 (0.816–3.247) Dominant TT 27 27.0 34 34.0 / 1.00 TC + CC 73 73.0 66 66.0 0.283 1.393 (0.761–2.551)
Table 6. Comparative results in selected ATG polymorphism distribution in risk factor-matched pharyngeal
controls through the selection of a control sample with the same characteristics than patients regarding sex, tobacco and alcohol consumption. In this way both groups were are matched according to: packs of tobacco consumed per year (PPY): no smokers, <20PPY and >20PPY, standard drink units of alcohol per week (SDU/week): <14 SDU/ week and >14 SDU/week and sex (Table 4). As the Propensity Score method did not include the age of the indi-viduals, in the second analysis age was introduced in the logistic regression as adjustment variable only in laryngeal carcinoma where this variable was statistically significant (p > 0.05 by ANOVA test).
References
1. Ganci, F. et al. Molecular genetics and biology of head and neck squamous cell carcinoma: implications for diagnosis, prognosis and treatment. Dr. Mark Agulnik (Ed.), In Tech, doi:10.50772/31956 (2012).
2. Leemans, C. R., Braakhuis, B. J. M. & Brakenhoff, R. H. The molecular biology of head and neck cancer. Nat. Rev. Cancer 11, 9–22 (2011).
3. Perez-Ordoñez, B., Beauchemin, M. & Jordan, R. C. K. Molecular biology of squamous cell carcinoma of the head and neck. J. Clin.
Pathol. 59, 445–53 (2006).
4. Torre, L. A. et al. Global cancer statistics, 2012. CA. Cancer J. Clin. 65, 87–108 (2015).
5. Hashibe, M. et al. Alcohol drinking in never users of tobacco, cigarette smoking in never drinkers, and the risk of head and neck cancer: pooled analysis in the International Head and Neck Cancer Epidemiology Consortium. J. Natl. Cancer Inst. 99, 777–89 (2007).
6. Hashibe, M. et al. Interaction between tobacco and alcohol use and the risk of head and neck cancer: pooled analysis in the INHANCE consortium. Cancer Epidemiol. Biomarkers 18, 541–550 (2011).
7. Sturgis, E. M., Wei, Q. & Spitz, M. R. Descriptive epidemiology and risk factors for head and neck cancer. Semin. Oncol. 31, 726–733 (2004).
8. Ragin, C. C. R., Modugno, F. & Gollin, S. M. The Epidemiology and Risk Factors of Head and Neck Cancer: a Focus on Human Papillomavirus. J. Dent. Res. 86, 104–14 (2007).
9. Cardesa, A. & Nadal, A. Carcinoma of the head and neck in the HPV era. Acta Dermatovenerol Alp Pannonica Adriat. 20, 161–173 (2011).
10. Jefferies, S. et al. The role of genetic factors in predisposition to squamous cell cancer of the head and neck. Br. J. Cancer. 79, 865–867 (1999).
11. Azad, A. K. et al. Genetic sequence variants and the development of secondary primary cancers in patients with head and neck cancers. Cancer 118, 1554–1565 (2012).
12. Mizushima, N. Autophagy: Process and function. Genes and Development 21, 2861–2873 (2007).
13. Shintani, T. & Klionsky, D. J. Autophagy in health and disease: a double-edged sword. Science. 306, 990–995 (2004).
Genotype
Oral cavity Control
P-value OR (CI 95%) N % N % ATG2B rs3759601 CC 27 38.6 27 38.6 / 1.00 CG 36 51.4 39 55.7 0.823 0.923 (0.458–1.859) GG 7 10.0 4 5.7 0.413 1.750 (0.459–6.679) Recessive CC + CG 63 90.0 66 94.3 / 1.00 GG 7 10.0 4 5.7 0.352 1.833 (0.512–6.568) Dominant CC 27 38.6 27 38.6 / 1.00 CG + GG 43 61.4 43 61.4 1.000 1.000 (0.506–1.975) ATG5 rs2245214 CC 31 44.3 25 35.7 / 1.00 CG 31 44.3 35 50.0 0.356 0.714 (0.349–1.460) GG 8 11.4 10 14.3 0.421 0.645 (0.222–1.878) Recessive CC + CG 62 88.6 60 85.7 / 1.00 GG 8 11.4 10 14.3 0.614 0.774 (0.286–2.094) Dominant CC 31 44.3 25 35.7 / 1.00 CG + GG 39 55.7 45 64.3 0.301 0.699 (0.354–1.379) ATG10 rs1864183 CC 26 37.1 26 37.1 / 1.00 CT 33 47.2 33 47.2 1.000 1.000 (0.483–2.069) TT 11 15.7 11 15.7 1.000 1.000 (0.369–2.710) Recessive CC + CT 59 84.3 59 84.3 / 1.00 TT 11 15.7 11 15.7 1.000 1.000 (0.402–2.485) Dominant CC 26 37.1 26 37.1 / 1.00 CT + TT 44 62.9 44 62.9 1.000 1.000 (0.504–1.985) ATG16L1 rs2241880 TT 18 25.7 26 37.1 / 1.00 TC 31 44.3 33 47.2 0.441 1.357 (0.625–2.947) CC 21 30.0 11 15.7 0.035 2.758 (1.072–7.096) Recessive TT + TC 49 70.0 59 84.3 / 1.00 CC 21 30.0 11 15.7 0.047 2.299 (1.010–5.230) Dominant TT 18 25.7 26 37.1 / 1.00 TC + CC 52 74.3 44 62.9 0.147 1.707 (0.829–3.517)
Table 7. Comparative results in selected ATG polymorphism distribution in risk factor-matched oral cavity
14. Burada, F. Autophagy in colorectal cancer: An important switch from physiology to pathology. World J. Gastrointest. Oncol. 7, 271 (2015).
15. Mathew, R., Karantza-Wadsworth, V. & White, E. Role of autophagy in cancer. Nat. Rev. Cancer 7, 961–7 (2007).
16. Cosway, B. & Lovat, P. The role of autophagy in squamous cell carcinoma of the head and neck. Oral Oncology 54, 1–6 (2016). 17. Glick, D., Barth, S. & Macleod, K. F. Autophagy: Cellular and molecular mechanisms. Journal of Pathology 221, 3–12 (2010). 18. Kishi-Itakura, C., Koyama-Honda, I., Itakura, E. & Mizushima, N. Ultrastructural analysis of autophagosome organization using
mammalian autophagy-deficient cells. J Cell Sci 127, 4089–4102 (2014).
19. Usategui-Martín, R. et al. Polymorphisms in autophagy genes are associated with paget disease of bone. PLoS One 10, e0128984 (2015).
20. Qin, Z. et al. Potentially functional polymorphisms in ATG10 are associated with risk of breast cancer in a Chinese population. Gene 527, 491–5 (2013).
21. Kishi-Itakura, C., Koyama-Honda, I., Itakura, E. & Mizushima, N. Ultrastructural analysis of autophagosome organization using mammalian autophagy-deficient cells. J. Cell Sci. 127, 4984–4984 (2014).
22. Velikkakath, A. K. G., Nishimura, T., Oita, E., Ishihara, N. & Mizushima, N. Mammalian Atg2 proteins are essential for autophagosome formation and important for regulation of size and distribution of lipid droplets. Mol. Biol. Cell 23, 896–909 (2012). 23. Salem, M., Haagen Nielsen, O., Nys, K., Yazdanyar, S. & Benedict Seidelin, J. Impact of T300A Variant of ATG16L1 on Antibacterial Response, Risk of Culture Positive Infections, and Clinical Course of Crohn’s Disease. Clin. Transl. Gastroenterol. 6, e122–9 (2015). 24. White, K. A. M. et al. Variants in autophagy-related genes and clinical characteristics in melanoma: a population based study. Cancer
Med. 5, 3336–3345 (2016).
25. Murthy, A. et al. A Crohn’s disease variant in Atg16l1 enhances its degradation by caspase 3. Nature 506, 456–462 (2014). 26. Nicoli, E. R. et al. Determination of autophagy gene ATG16L1 polymorphism in human colorectal cancer. Rom. J. Morphol. Embryol.
55, 57–62 (2014).
27. Boada-Romero, E. et al. The T300A Crohn’s disease risk polymorphism impairs function of the WD40 domain of ATG16L1. Nat.
Commun 7, 11821 (2016).
28. Feller, L., Altini, M. & Lemmer, J. Inflammation in the context of oral cancer. Oral Oncol. 49, 887–892 (2013).
29. Seijas-Tamayo, R. et al. Epidemiological characteristics of a Spanish cohort of patients diagnosed with squamous cell carcinoma of head and neck: distribution of risk factors by tumor location. Clin. Transl. Oncol. 18, 1114–1122 (2016).
30. Schleinitz, D., Distefano, J. K. & Kovacs, P. Targeted SNP genotyping using the TaqMan
®
assay. Methods Mol. Biol. 700, 77–87 (2011).31. Rosenbaum, B. Y. P. R. & Rubin, D. B. The central role of the propensity score in observational studies for causal effects. Biometrika 70, 41–55 (1979).
32. Streiner, D. L. & Norman, G. R. The pros and cons of propensity scores. Chest 142, 1380–2 (2012).
Acknowledgements
This study was supported by the health research program of the “Instituto de Salud Carlos III” (PI11/00519, PI13/01741 and PIE14/00066) co financed with FEDER founds and for the Health Regional Management of the Junta de Castilla y León (GRS630/A11). J. Fernández-Mateos was partially supported by a predoctoral research grant from the Consejería de Educación—Junta de Castilla y León and the European Social Fund to CC-B (EDU/1084/2012). Moreover the authors thank the 790 individuals who consented to participate in this study, and all their colleagues who have participated in this study and are not included in the list of authors, in alphabetical order: Daniel Almenar Cubells (H.U. Dr. Peset de Valencia), Ruth Alvarez Cabellos (H. Virgen de la Salud), Teresa Bonfill Abella (Corporación Sanitaria Parc Taulí), Beatriz Castelo Fernández (H.U. de La Paz), José Fuster Salva (H. Son Espases), José Angel García Saenz (H. Clínico San Carlos), María Belén González Gragera (H. Son Llatzer), Oscar Salvador Gallego Rubio (H. De la Santa Creu I Sant Pau), Alicia Hurtado Nuño (H.U. Alcarcón), Ana López Alfonso (H. Infanta Leonor), Julio Lambea Sorrosal (H.C.U. Lozano Blesa), Javier Martínez Trufero (H.U. Miguel Servet), Isabel Ruiz Martín (Complejo Hospitalario de Palencia), Michalina Rusiecka (H. Clinic I Provincial) and Sergio Eloy Vázquez Estévez (H. U. Lucus Augusti). We also thank to the Spanish Head and Neck Cancer Cooperative Group (TTCC) and the Institute of Biomedical Research of Salamanca (IBSAL) for their efforts on behalf of the patients and protocol.
Author Contributions
The study conception and design was elaborated by J.F.M., R.S.T., E.D.B., J.C.A.K., J.J.C.H. & R.G.S., the analysis and interpretation was performed by J.F.M., R.S.T., J.C.A.K., J.J.C.H. & R.G.S. M.P.B., E.P.R., R.M., E.D.B., C.S.C., A.R.D., J.C.D., E.F.R. and J.J.C.H. collected and assembled the data. J.F.M., R.S.T. did the statistical analysis and the study supervision or coordination was done by J.J.C.H. & R.G.S. J.F.M. did the drafting of the article. All authors reviewed the manuscript.
Additional Information
Competing Interests: The authors declare that they have no competing interests.
Publisher's note: Springer Nature remains neutral with regard to jurisdictional claims in published maps and
institutional affiliations.
Open Access This article is licensed under a Creative Commons Attribution 4.0 International
License, which permits use, sharing, adaptation, distribution and reproduction in any medium or format, as long as you give appropriate credit to the original author(s) and the source, provide a link to the Cre-ative Commons license, and indicate if changes were made. The images or other third party material in this article are included in the article’s Creative Commons license, unless indicated otherwise in a credit line to the material. If material is not included in the article’s Creative Commons license and your intended use is not per-mitted by statutory regulation or exceeds the perper-mitted use, you will need to obtain permission directly from the copyright holder. To view a copy of this license, visit http://creativecommons.org/licenses/by/4.0/.