http://siba-ese.unisalento.it
Protein biomarkers as indicator for water pollution
in some lagoons of Sardinia (Italy)
S.E. Ielmini1, G. Piredda1, S. Mura2, G.F. Greppi2*
1Department for the Research in Animal Production, Agris Sardegna, SS 291 Sassari-Fertilia, Km 18,600, loc. Bonassai, 07100, Sassari, Italy
2Department of Agriculture, Desertification Research Center (NRD), University of Sassari, Viale Italia 39, 07100, Sassari, Italy
*Corresponding author: e-mail address: [email protected]
Abstract
1 - Studying the expressed proteome in mussel tissues is important to understand many different biological, physiological and ecological aspects that may be of advantage in shellfish rearing, encompassing growth cycle, food safety and traceability as well as understanding the biological effects of environmental pollution and climate change.
2 - The present work attempted to accomplish a systematic characterization of the foot muscle proteome of M. galloprovincialis, to gather data about its variability in physiological conditions occurring in different environments of mussel rearing and to identify a putative set of protein biomarkers that may be significantly correlated to environmental factors.
3 - A total of 360 mussels were sampled from three different lagoons of Sardinia, each one characterized by its different environmental and ecological system. According to a double latin square design, a smaller subgroup of 54 mussels that was representative of the original population was submitted to proteomics analysis and trace metals quantification. Classical and multivariate statistics was performed to correlate protein expression data to trace metal content and to environmental parameters recorded in situ.
4 - A protein expression pattern of 79 protein was identified as related to the response to environmental stressors like dissolved oxygen, water acidity, temperature and trace metals.
5 - The identified proteins are cytoskeletal proteins (α-tubulin, β-tubulin, myosin light chains and tropomyosin) or are involved in metabolic pathways (fructose bisphosphate aldolase), in energy pathways (cytosolic malate dehydrogenase and arginine kinase), in antioxidant defense (protein disulfide isomerase) and in protein turnover (different isoforms of the heat shock proteins Hsp70 and the Hsc71); also the histone protein H2B is reported.
6 - Our preliminary results show that there is correlation between the expressed protein pattern and the environmental conditions, confirming the findings of other proteomics works carried out on different mussel tissues and other marine invertebrates. Further validation procedures of the identified correlations must be accomplished in order to regard the identified proteins as biomarkers for environmental pollution and climate change.
Keywords: Ecotoxicology, Mytilus galloprovincialis, proteomics, pollutants, environmental effects. RESEARCH ARTICLE
and human health. Recently, a growing interest is devoted to the development of new biomarkers of exposure and effect to pollutants in rivers and seas. A biomarker is defined as “a variation occurring in cellular or biochemical components or processes, structures, or functions that is measurable in a biological system or sample and that may be indicative of xenobiotic exposure and/or effect” (Lam, 2009). The principle laying down the biomarker approach is the analysis of an organism with reference to the response to persistent pollutant exposure in terms of sub-organismic (cellular, biochemical, molecular, or physiological) changes, (Lam, 2009). In practical terms, biomarkers are ecotoxicological endpoints that register an effect on a living organism (Lam, 2009). In a wider perspective, even responses at the whole organism, population, community or ecosystem levels can be considered as biomarkers (Lam, 2009). Various aquatic organisms occur in rivers, lakes, seas and marines that are potentially useful as biomarkers of metal pollutants, including fish, shellfish, oysters, mussels, clams, algae, aquatic animals and plants. The development of new strategies and methods for biomarkers discovery is essential to define early warning signals for the design of prevention interventions and strategies. In this respect, “omics” techniques like genomics, transcriptomics, proteomics and metabolomics, together with the system biology approach, can provide new knowledge to develop tools for the identification of threshold values and exposure/effect relationships. "From bench to risk assessment": in the near future the biomarkers approach could successfully make the most of “omics” techniques and their employment both for environmental monitoring, health surveillance and epidemiology. The proteome is traditionally defined as "the set of protein expressed by the genome of a cell, a tissue or an entire
Introduction
Water is one of our most important natural resources, and there are many conflicting demands upon it. Skillful management of water bodies is required if they are to be used for diverse purposes, such as domestic and industrial supply, crop irrigation, transport, recreation, sport and commercial fisheries, power generation and waste disposal. Water pollution is most commonly associated with the drainage into rivers, lakes and seas of effluents coming from drains and sewers or from sewage treatment plants of urban sites, farms and factories. Environmentally persistent chemical substances like toxic metals, polycyclic aromatic hydrocarbons (PAHs), endocrine disrupting chemicals, pesticides, either produced specifically for industrial or agricultural purposes or arising as byproducts from combustion, urban or industrial processes like dioxins, tributyltin (TBT) and polychlorinated biphenyls (PCBs), can accumulate in waters, sediments and enter the marine food chain. Besides anthropogenic contamination, ocean and sea waters are becoming warmer and more saline in certain zones of the Earth as a consequence of climate change. Temperature rise produces changes in metabolic routes in almost every species of marine beings and induces species, particularly those with shorter life spans, to change their lifetime cycle, thus contributing to changes in marine species distribution patterns (Marques et al., 2010). One of the effects of temperature rise is the enhancement of plankton blooms, particularly harmful algal blooms that produce toxins which are persistent in waters and can enter the seafood chain. When reaching a substantially high level, the toxicity of pollutants and phycotoxins may be a relevant problem for plants, animals and humans. Over the next few decades environmental pollution and climate change will have a profound and direct impact on agricultural and food systems, ultimately affecting environmental
the interactions between living organisms, their ecosystems and stressors. Elucidating the effects of toxicants and physical stressors at the protein level of several ecologically relevant organisms in order to unravel mechanisms underlying toxicological effects of stressors and to discover new potential biomarkers has resulted in the emergence of “ecotoxicoproteomics” (Lemos et al., 2010). Many ecotoxicoproteomics studies have been conducted on molluscs, as they are considered as major natural sentinels for aquatic toxicity (Rodríguez-Ortega et al., 2003). Particularly, mussels belonging to the genus Mytilus have been object of several proteomics studies to identify proteomic signatures of exposure (PES) to marine and water pollutants (Knigge et al., 2004; Manduzio et al., 2005; Apraiz et al., 2006; Bjørnstad et al., 2006; Amelina et al., 2007; Letendre et al., 2011) or to study the effects of oxidative stress on protein structure and degradation pathways (McDonagh and Sheehan, 2008). Also, there is great concern about the effects of global climate change on seafood products (Piñeiro et al., 2010) and the number of studies on the topic is increasing; for instance, the proteomic response to acute thermal stress have been assessed in M. galloprovincialis (Tomanek and Zuzow, 2010).
The aim of the present study was to evaluate the potential of proteomics as a tool for biomarker discovery, providing a characterization of the proteome of the mussel M. galloprovincialis reared in Sardinia. By using a proteomic hypothesis-independent approach, this work is intended to discover protein expression patterns underlying the effects of ecological stressors in the form of chemical pollutants and environmental conditions, in the attempt of identifying a putative set of protein biomarkers. In this work, by means of two-dimensional electrophoresis the protein expression patterns were characterized in the foot muscle in mussels of M. galloprovincialis that have been reared in organism” (Wilkins et al., 1996). Proteomics
is essentially based on classical “Analytical Chemistry” strategies: separation by electrophoresis techniques, identification and quantitative analysis through mass spectrometry. Thanks to the many advances made in the field of electrophoresis and MS analysis, proteomics has become a high-throughput discipline that can simultaneously analyse thousands of proteins, thus providing a quantitative description of protein expression profiles, their distribution within the cell and their changes under the influence of biological perturbations as well as the occurrence of post-translational modifications. In the last decade proteomic strategies have been increasingly employed in several studies on fish biology, aquaculture and seafood research. The physiology and developmental biology of several fish species and molluscs have been investigated (Forné et al., 2010) particularly in mussels (Funabara et al., 2001; Sagert and Waite, 2009). Proteomics have been applied on seafood for species identification (Piñeiro, et al., 2003), as well as on marine organisms for population identification (Gonzalez et al., 2010), environmental adaptation (Martínez-Fernández et al., 2008) and to better understand the process of maternal effects in genetic heritability (Diz et al., 2009). One of the “hot topics” of proteomics investigation regards the eco-toxicology of fish, crustaceans and molluscs. Traditional toxicological approaches allow to study many events happening at both the cellular and the organismal levels of organization. Yet, the same traditional approach made it clear that no single biomarker will be sufficient enough to explain the full effect of chemical and physical stressors at biological level, since very often the changes involve multiple expressed proteins and different pathways of the molecular machinery of the cell. In this framework, proteomics relevantly contributes to study
Materials and methods
Mussel farming and sampling
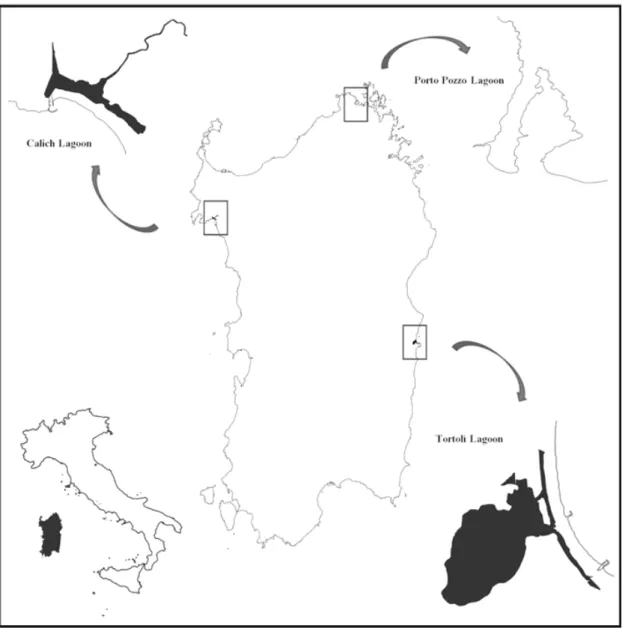
Juveniles of the species Mytilus galloprovincialis, about 35-40 mm of size, were supplied from a commercial mussel farmer and cultured in long-line systems, kept in place by nylon nets for growth. Mussels were farmed in three different lagoon sites of Sardinia, each one characterized for their different environmental features. The lagoon of Porto Pozzo (41°12’N 09°17’E), three different lagoons of Sardinia (Figure
1): the lagoon of Calich, the lagoon of Porto Pozzo and the lagoon of Tortolì, each one characterized by different environmental and ecological features. Insights on the proteome variability that may be associated to different environmental conditions like water parameters (temperature, pH, salinity and dissolved oxygen) and quantity of trace metals in the animals have been gathered and presented, showing preliminary results.
sampling site and sampling time, reducing to 54 the number of individuals to be submitted to chemical and proteomic analysis according to a double latin square design. Each sample was labeled with a code that reports the abbreviation of locality, sampling period, class size and replicate number (Appendix A). Proteomics analysis
About 40 µg of foot muscle tissue were collected and minced using a clean scalpel. The tissue was homogenized with 1 mL of lysis buffer with composition 7 M urea, 2 M thiourea, 4% CHAPS, 40 mM DTT and protease inhibitors mix (Complete Mini, Roche Applied Science, Mannheim, Germany) in 0.1 X concentration. The mixture was incubated in ice for 30 additional minutes, then subjected to three cycles of Ultraturrax
Homogenizer (IKA-Werke, Staufen,
Germany) at 13,500 rpm for 30 seconds, each one followed by 1 minute of ice incubation. All extracts were clarified by centrifugation for 20 min at 14,000 rpm at 4 °C (Eppendorf, Hamburg, Germany), then divided in 100 µL aliquots that were stored at −80 °C until needed. The quantification results and the quality of the protein extracts was performed by the modified Bradford method (Ramagli and Rodriguez, 1985), measuring the samples extracts in duplicates and using bovine serum albumin (BSA) as protein standard. The results of the quantification were checked by running 25 µg of each protein extract on 12.5% vertical SDS-PAGE gels according to Laemmli’s protocol (Laemmli, 1970). For 2D-PAGE, protein extracts were diluted in rehydration buffer with composition 7 M urea, 2 M thiourea, 2% CHAPS, 1% DTT, 0.5% IPG Buffer pH 3-11 NL, 0.002% BBF. Resuspended proteins, approximately 200 μg, were absorbed overnight into 7 cm Immobiline Drystrip pH 3–11 NL (GE Healthcare, Buckinghamshire, UK) and focused at 50 µA per strip according to the manufacturer’s protocol, for a total of 6,500 situated in the North-East of Sardinia, is
an oligotrophic lagoon with wide seawater inlets and low freshwater intakes, resulting in an annual mean salinity of about 38‰. The lagoon of Tortolì (39°57’N 09°40’E), in the middle-south part of the east coast, is seasonally supplied with relevant freshwaters intakes (Rio Girasole) and two sea-connecting channels that regiment seawater intakes; it is a eutrophic ecosystem with an annual mean salinity varying from 25 ‰ to 35 ‰; the lagoon hosts one of the most important mussels rearing plants of Sardinia. The lagoon of Calich (40°36’N 08°18’E) is a eutrophic ecosystem situated on the North-West coast of Sardinia; it is characterized by the very low salinity levels, consequence of relevant fresh waters intakes due to the presence of different affluents, which cause the occurrence of eutrophication and anoxia episodes. In August and September, when mussels reached the minimum commercialized length of 50 mm according to the Italian regulation (D.P.R. 02/10/98, n. 1639), 60 mussel individuals were sampled for each sampling site and sampling time, measured for maximum length and width, the weights of the soft part and the shell were recorded, then the entire mollusk was stored at -80°C until proteomics analysis and trace metal determination.
Experimental design
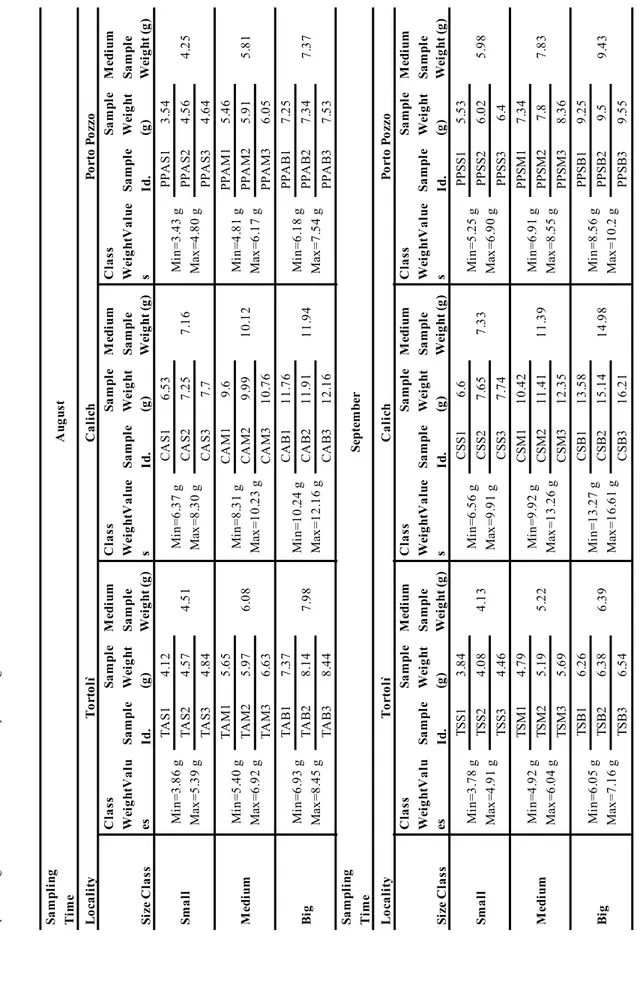
In order to perform proteomic analysis, the total number of 360 sampled individuals was reduced to a smaller subgroup of mussels that was representative of the original population. Accordingly, individuals of the same sampling site were grouped into three size classes (small, medium and big) on the basis of the analysis of molluscs weight data (Table 1). Three individuals were randomly selected for each size class, thus having a subgroup of 9 individuals representing the original population of 60 individuals. This sampling scheme was repeated for each
Sa m pl ing Ti m e A ug us t Lo ca lity To rto lì C al ich Po rto P ozzo Si ze C la ss C la ss Wei ghtV al u es Sa m pl e Id. Sa m pl e Wei ght (g ) M edi um Sa m pl e Wei ght (g ) C la ss Wei ghtV al ue s Sa m pl e Id. Sa m pl e Wei ght (g ) M ed ium Sa m pl e Wei ght (g ) C la ss Wei ghtV al ue s Sa m pl e Id. Sa m pl e Wei ght (g ) M ed ium Sa m pl e Wei ght (g ) Sm al l Mi n= 3. 86 g Max =5 .3 9 g TA S1 4. 12 4. 51 Mi n= 6. 37 g Max =8 .3 0 g CA S1 6. 53 7. 16 Mi n= 3. 43 g Max =4 .8 0 g PPA S1 3. 54 4. 25 TA S2 4. 57 CA S2 7. 25 PPA S2 4. 56 TA S3 4. 84 CA S3 7. 7 PPA S3 4. 64 M edi um Mi n= 5. 40 g Max =6 .9 2 g TA M1 5. 65 6. 08 Mi n= 8. 31 g Max =1 0. 23 g CA M1 9. 6 10 .1 2 Mi n= 4. 81 g Max =6 .1 7 g PPA M1 5. 46 5. 81 TA M2 5. 97 CA M2 9. 99 PPA M2 5. 91 TA M3 6. 63 CA M3 10 .7 6 PPA M3 6. 05 Bi g Mi n= 6. 93 g Max =8 .4 5 g TA B1 7. 37 7. 98 Mi n= 10 .2 4 g Max =1 2. 16 g CA B1 11 .7 6 11 .9 4 Mi n= 6. 18 g Max =7 .5 4 g PPA B1 7. 25 7. 37 TA B2 8. 14 CA B2 11 .9 1 PPA B2 7. 34 TA B3 8. 44 CA B3 12 .1 6 PPA B3 7. 53 Sa m pl ing Ti m e Septem ber Lo ca lity To rto lì C al ich Po rto P ozzo Si ze C la ss C la ss Wei ghtV al u es Sa m pl e Id. Sa m pl e Wei ght (g ) M edi um Sa m pl e Wei ght (g ) C la ss Wei ghtV al ue s Sa m pl e Id. Sa m pl e Wei ght (g ) M ed ium Sa m pl e Wei ght (g ) C la ss Wei ghtV al ue s Sa m pl e Id. Sa m pl e Wei ght (g ) M ed ium Sa m pl e Wei ght (g ) Sm al l Mi n= 3. 78 g Max =4 .9 1 g TS S1 3. 84 4. 13 Mi n= 6. 56 g Max =9 .9 1 g CS S1 6. 6 7. 33 Mi n= 5. 25 g Max =6 .9 0 g PPSS 1 5. 53 5. 98 TS S2 4. 08 CS S2 7. 65 PPSS 2 6. 02 TS S3 4. 46 CS S3 7. 74 PPSS 3 6. 4 M edi um Mi n= 4. 92 g Max =6 .0 4 g TS M1 4. 79 5. 22 Mi n= 9. 92 g Max =1 3. 26 g CS M1 10 .4 2 11 .3 9 Mi n= 6. 91 g Max =8 .5 5 g PPSM1 7. 34 7. 83 TS M2 5. 19 CS M2 11 .4 1 PPSM2 7. 8 TS M3 5. 69 CS M3 12 .3 5 PPSM3 8. 36 Bi g Mi n= 6. 05 g Max =7 .1 6 g TS B1 6. 26 6. 39 Mi n= 13 .2 7 g Max =1 6. 61 g CS B1 13 .5 8 14 .9 8 Mi n= 8. 56 g Max =1 0. 2 g PPSB1 9. 25 9. 43 TS B2 6. 38 CS B2 15 .1 4 PPSB2 9. 5 TS B3 6. 54 CS B3 16 .2 1 PPSB3 9. 55 Ta bl e 1 - M us se l s iz e cl as si fi ca ti on ta bl e re po rt in g, f or e ac h lo ca li ty a nd s am pl in g ti m e, th e si ze c la ss in te rv al s an d va lu es , t he id en ti fi ca ti on n am es , t he sa m pl e w ei gh t an d th e m ed iu m s am pl e w ei gh t of t he s el ec te d m us se ls .
Vh in an IPGphor isoelectrofocusing unit (GE Healthcare). After focusing, strips were equilibrated in 7 M urea, 75 mM Tris HCl, pH 8.8, 2% SDS, 30% glycerol, supplemented with 1% DTT for 15 min, and then with 2.5% iodoacetamide for 15 min. The second dimension SDS PAGE was performed on 12.5% denaturing polyacrylamide gels (12.5% acrylamide-bisacrylamide (29:1), 37.5 mM Tris HCl (pH 8.8), and 0.1% SDS) using the Laemmli tris-glycinate (0.025 M Tris, 0.192 M glycine, and 0.1% SDS, final pH 8.3) electrode buffer system (Laemmli, 1970) on a Protean Tetra Cell (Bio-Rad) following the manufacturer instructions (90V for 15 minutes, then 150V until the BBF reached the gel bottom)and Precision Plus All Blue Protein Standard (Bio-Rad). Gels were stained with EZBlue Coomassie staining (Sigma Aldrich, St Louis, USA). All gels were digitalized after run using a GS-800 imaging densitometer (Bio-Rad), with a 63.5 x 63.5 µm resolution.
Gel image analysis
Mono-dimensional SDS-PAGE gels were analyzed with the Quantity One software (Bio-Rad). Protein patterns in digitalized 2D-PAGE gel images were analyzed using the PDQuest Advanced software (Bio-Rad). The digitalized gel images were subjected to the software analysis workflow, consisting of spot detection, spot matching and spot analysis. The spot detection and matching steps performed by the software were manually checked in order to eliminate errors such as artifactual spots, splitted spots and missed spots. All the experiments of gel image analysis were visually double – checked for better efficiency of control. As for spot quantification, the raw values of protein spot volumes were normalized by dividing each volume value by the total for that gel and the resulting values were logarithmically transformed for better analysis robustness. All the spot analysis steps consisting in
spot volume quantification, volume ratio normalization and logarithm transformation were performed with the same PDQuest software. In order to identify the possible up or down-regulated candidate proteins, a 2-fold threshold volume value and a statistical significance of a two-tailed Student’s t-test with a 95% confidence level (P<0.05) were considered as analysis constraints to compare protein expression levels. The significant results, indicated as interesting spots, were selected and submitted to statistical analysis. Determination of environmental parameters For each farming site, environmental parameters were recorded on-site twice a month, with the only exception of September when only one monitoring session was performed for unscheduled causes. The values of temperature and pH, salinity and oxygen dissolved in water were monitored using a field – analysis water analyser, the multiparameter Ocean Seven 316 plus CTD probe (Idronaut, Milan, Italy).
Determination of trace metal concentrations After the sampling for the proteomics analysis, the mussels coming from each lagoon, deprived of the foot muscle, were destined to trace metal determination. Individual mussels were pooled according to size, washed to take away sand an impurities that may interfere with the analysis, and minced with a clean scalpel to obtain a blended mixture. About 1 g ± 0.01 g were weighted, mixed with 5 ml of nitric acid and 5 ml of bidistilled (MilliQ) water in teflon vessels and microwaves digested in a conventional oven model Mars 5 (CEM Corporation, Matthews, USA) according to the conditions of temperature, pressure and time described in Table 2. The digested solutions were cooled to room temperature, then transferred in 50 ml tubes and made up to 50 g ± 0.1 g with bidistilled water. An aliquot of the resulting solution was diluted
metal content data were analysed by one-way and multifactorial ANOVA. Statistical analysis was performed to study and interpret the expression data of the identified protein spots. Comparisons between groups were made using Student’s t-test, one-way and multifactorial ANOVA. Then, the relations among the expression levels of the proteins of interest, the quantities of heavy metals in mussels and environmental parameters were predicted using an unsupervised principal component analysis (PCA). The softwares Excel 2007 (Microsoft Corp., Redmond, USA), Statistica (StatSoft Inc., Tulsa, USA) were used for conducting data manipulation and statistical analysis, while the software The Unscrambler (CAMO Softwares, Oslo, Norway) was employed for Principal Component Analysis (PCA).
Results
Determination of environmental parameters and trace metal concentrations in mussels tissues
The environmental parameters (temperature, salinity, dissolved oxygen and pH) recorded in August and September show significant differences (p<0.05) between the three lagoons examined, Calich, Tortolì and Porto Pozzo, except the temperature (p>0.05). The lower values of mean salinity and higher dissolved oxygen and pH recorded in Calich lagoon were as expected on the basis of the ecological features of this locality (Table 3). All trace metal concentrations assessed by ICP-MS in mussels are below the concentration limits defined by the European Regulation for the levels of contaminants in food products (EU Regulation n. 1881/2006 of 19th of December 2006). The multifactorial ANOVA showed that there are no differences of concentration value neither among class size nor among sampling times. However, metal concentration values differently characterize the mussels coming from the to a 1:5 ratio and analyzed for zinc, copper,
manganese, arsenic, cadmium, mercury and lead by Inductively Coupled Plasma-Mass Spectrometry (ICP-MS) according to the international regulations (EPA Method 6020a, Regulation (EC) No. 1881/2006). The ICP-mass spectrometer was an Agilent 7500ce with Octopole Reaction System (Agilent Technologies, Palo Alto, USA), equipped with an ASX-520 autosampler (Cetac Technologies, Omaha, USA). The instrument has a mass range 5-240 m/z (AMU), a 1 m/z (AMU) resolution and a 5% half-height-peak width. Before samples analyzing, the instrument had been tuned for mass calibration, sensitivity and presence of interfering substances using a solution consisting of 1 mg/L each of Li, Y, Ce, Tl and Co in 2% HNO3 and 0.2% HCl. The accuracy and precision of the method were controlled by comparison with a certified standard: mussel tissue reference material CRM 278 R from the Community Bureau of Reference (CBR) (Commission of the European Communities, Brussels, Belgium). Statistical data analysis
Mussels weight data were submitted to Exploratory Data Analysis (EDA) to assess the normality of their distribution and identify possible outliers in order to define size classes. Environmental data and trace
Stage 1 2 3 4 5
Run Time (min) 10 10 10 10 6
Power (%) 20 30 40 60 60
Pressure (psi) 40 40 85 130 130 Temperature (°C) 100 100 100 150 150 Fan Speed (%) 100 100 100 100 100 Table 2 - Experimental conditions of Microwave-assisted digestion for trace metals ICP-MS determination.
spots were considered as spots of interest for statistical data analysis.
Multifactorial Analysis of Variance
The protein expression data were analysed by a multifactorial analysis of variance (ANOVA) in order to identify the effects of multiple independent variables and its interactions. Protein expression data were screened according to size class, locality and sampling time. When analysing the pool of data, no statistical differences in protein expressions were found among individuals from different size class. However, some spots showed marked expression variations that are statistically significant (p ≤ 0.05); the graphics reporting their spot intensity in log form are showed in Appendix B. In general, a clear increase in protein expression intensity was registered for the mussels sampled in Porto Pozzo lagoon, both in August and September, with respect to individuals sampled in Tortolì and Calich lagoons. Spots named SSP2, SSP18, SSP1602, SSP8003 and SSP8208 showed an over-expression related to mussels sampled in August, while the spots identified as SSP2703, SSP2903, SSP5802 three farming sites, with Porto Pozzo having
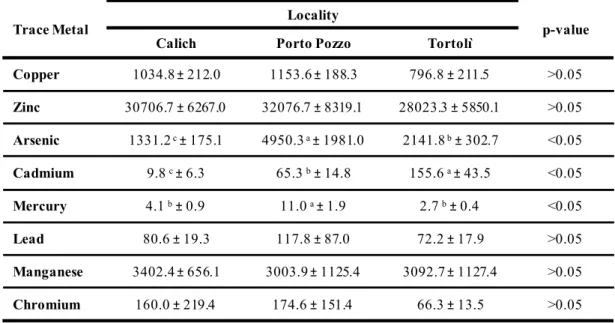
the highest concentrations of arsenic and mercury (p<0.05) and substantially relevant concentrations of cadmium, while Tortolì is characterized for the highest content of cadmium among the three lagoons (p<=0.05) (Table 4). These differences can be observed also comparing the data of the three localities for each sampling times August and September (Table 5).
Analysis of 2-DE protein maps
The protein extracts were analyzed by 2D-PAGE within isoelectric point (pI) and molecular mass (MM) intervals of 3 – 11 pH units and 10 – 250 kDa, respectively. In Figure 2 a typical 2-DE map of foot muscle proteins is reported. Spots were quite homogeneously distributed across the entire pI range, although some significant protein clusters of high molecular mass appear. The conditions of gel electrophoresis and analysis allowed to discriminate a mean of 749.5 ± 73 protein spots per gel, among which a mean of 16% has been matched. A total of 79 spots have been detected as differentially expressed in all the analysed gels; accordingly, these
Table 3 - Environmental parameter recorded in the three lagoon ecosystems. Mean values and standard deviations were calculated pooling together all the recorded values. Different superscript letters (a, b, c) within each column represent significant differences (p<0.05, multifactorial ANOVA) between different localities.
Locality Calich Tortolì Porto Pozzo p-value
Mean temperature (°C) 24.66 ± 0.69 26.57 ± 0.82 25.08 ± 0.86 0.057
Mean Salinity (‰)a 31.74 b±1.42 37.76 a±0.04 39.47 a±0.07 0.000
Mean Dissolved Oxygen (%)a 109.32 a±12.01 80.27 b±2.87 88.58 b±4.71 0.009
Mean Dissolved Oxygen (mg/L)a 7.55 a±0.81 5.19 b±0.17 5.82 b±0.25 0.003
with number SSP1311, SSP1805, SSP2810, SSP3102, SSP3105, SSP4302, and SSP5504) and in September (SSP8115); other spots were over-expressed in mussels from Calich sampled at both sampling times (SSP2507, SSP2813, SSP3104, SSP4109, SSP4201, SSP6514, and SSP6609). Conversely, mussels farmed in Tortolì showed very low variations in their protein expression levels, generally without remarkable trends. The spots named SSP2102 and SSP2104 show a marked over-expression in the individuals from Tortolì of August. The protein spots number SSP18 showed a significant high expression in the mussels of Tortolì sampled in September and of Porto Pozzo sampled in August (p<0.05). The spots named SSP111, SSP606, SSP803, SSP2805 and SSP8301 showed a variability that is statistically significant in some cases (spots SSP111 and SSP606) and that seems related to the sampling time or to a parameter varying with the sampling time; are over-expressed in the individuals sampled
in September; some other spots are over-expressed at both sampling times (SSP201, SSP1605, SSP2404, SSP2601, SSP4502 and SSP5701). Spots named SSP201, SSP1605, SSP2404, SSP2601, SSP2903, SSP4502, SSP5701 and SSP5802 do not show a statistically significant variability in their expression (p>0.05), while spots with number SSP2, SSP18, SSP1602, SSP2703, SSP8003 and SSP8208 showed a significant increase in their expression level (p< 0.05). It is noteworthy that the individuals sampled in Porto Pozzo in August and Tortolì of September show a significant over-expression for the spot with number SSP18. Another trend was observed in the mussels from Calich lagoon, which show an increased expression when compared to the individuals of Tortolì and Porto Pozzo lagoons. Some spots showed an over-expression both for the individuals sampled in August (spots
Table 4 - Trace metal contents of mussels (means ± standard deviation) sampled in the lagoons of Porto Pozzo, Calich and Tortolì. Mean values and standard deviations were calculated pooling together both sampling times (August and September). Different superscript letters (a, b, c) within each column represent significant differences (P<0.05, multifactorial ANOVA) between different localities.
Trace Metal Locality p-value
Calich Porto Pozzo Tortolì
Copper 1034.8 ± 212.0 1153.6 ± 188.3 796.8 ± 211.5 >0.05 Zinc 30706.7 ± 6267.0 32076.7 ± 8319.1 28023.3 ± 5850.1 >0.05 Arsenic 1331.2 c±175.1 4950.3 a±1981.0 2141.8 b±302.7 <0.05 Cadmium 9.8 c±6.3 65.3 b±14.8 155.6 a±43.5 <0.05 Mercury 4.1 b±0.9 11.0 a±1.9 2.7 b±0.4 <0.05 Lead 80.6 ± 19.3 117.8 ± 87.0 72.2 ± 17.9 >0.05 Manganese 3402.4 ± 656.1 3003.9 ± 1125.4 3092.7 ± 1127.4 >0.05 Chromium 160.0 ± 219.4 174.6 ± 151.4 66.3 ± 13.5 >0.05
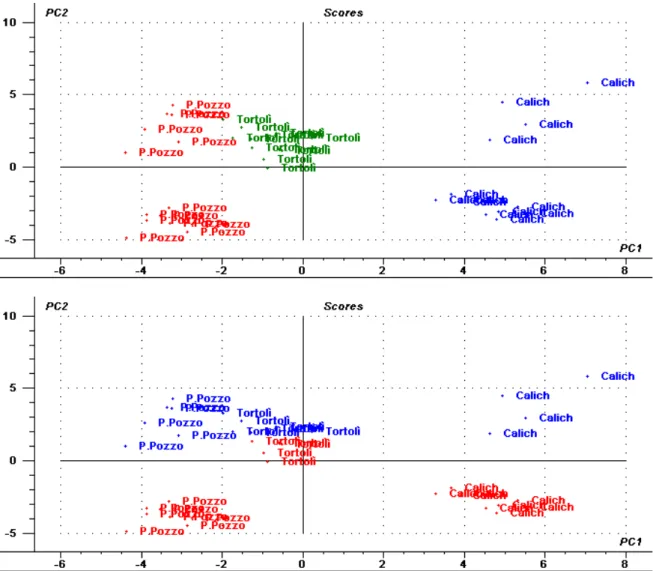
and three clusters corresponding to the three studied localities can be observed (Figure 3, top). Along the second principal component, samples separate on the basis of the sampling time August or September; moreover, samples of each localities Calich and Porto Pozzo are grouped according to their sampling time (Figure 3, bottom). The same clustering trend of the samples according to locality and sampling date is confirmed when analyzing protein expression signatures data both with and without environmental parameters data and metal concentrations values (results not shown). No clustering patterns have been found according to mussel size class.
Discussion
Identification of differentially expressed protein spots
Some authors have previously identified proteins expressed in mussel foot muscle and other tissues such as gill by MS analysis from similarly, also the spot SSP4807 showed a
higher intensity level in mussels sampled in September. In other cases (SSP6613) an over expression was registered which is not apparently correlated with neither locality nor sampling time.
Principal Component Analysis
In order to simplify the biological system complexity and to identify possible correlations and trends the Principal Component Analysis (PCA) has been chosen to study the relations among the expression pattern of the proteins of interest, the recorded environmental data values and the concentrations of trace metals assessed in the studied mussels. The performed PCA explains about 27% of the total variation of the studied system. Some groups can be clearly identified along the first two components of the scores plot according to both locality and sampling time (Figure 3). Samples separate according to locality along the first principal component
Locality Calich Porto Pozzo Tortolì p-value
Sampling
Time August September August September August September August September
Copper ±936.0 218.7 1215.5 ±187.6 1170.1 ±254.9 1137.0 ±151.0 801.1 ±203.9 792.4 ±246.9 >0.05 >0.05 Zinc 25850.0 ±4581.6 ±36785.0 2536.9 ±39016.7 2422.2 ±25136.7 4760.4 ±27353.3 86381.2 ±28693.3 2974.6 >0.05 >0.05 Arsenic 1218.7 ± b 45.5 1968.5 b ±191.3 3257.3 a ±649.5 6643.3 a ±888.9 2277.7 ±399.3 2006.0 b ±119.7 <0.05 <0.05 Cadmium 10.0 b ±6.3 22.1 b ±7.7 ±73.7 13.3 56.8 b ±12.5 138.6 a ±41.2 172.6 a ±46.4 <0.05 <0.05 Mercury ±4.0 b 1.2 5.5 b ±0.9 9.9 a ±1.0 12.1 a ±2.0 2.9 b ±0.3 2.4 b ±0.4 <0.05 <0.05 Lead 71.0 ±17.7 ±85.8 18.5 ±147.7 120.9 ±88.0 40.4 ±62.0 11.0 ±82.4 19.2 >0.05 >0.05 Manganese ±3658.8 728.2 3020.0 ±590.5 3618.5 ±1418.4 2389.3 ±145.0 3319.3 ±1499.4 2866.0 ±880.3 >0.05 >0.05 Chromium ±65.8 15.3 ±212.9 305.6 ±243.6 206.4 ±105.6 20.0 ±70.817.1 ±61.7 10.2 >0.05 >0.05
Table 5 - Trace metal contents of mussels (means ± standard deviation) sampled in the lagoons of Porto Pozzo, Calich and Tortolì during the two sampling times August and September. Mean values and standard deviations were calculated pooling together 9 individual samples. Different superscript letters (a, b, c) within each column represent significant differences (P<0.05, one-way ANOVA) between different localities.
et al., 2002). Moreover, several proteins expressed in foot muscle can be found also in gills (Letendre et al., 2011; Tomanek and Zuzov, 2010). Many ecotoxicoproteomics studies have been conducted on different mussel tissues, as well as on other organisms (Rodríguez-Ortega et al., 2003; Manduzio et al., 2005; Amelina et al., 2006; Apraiz et al., 2006; Sarry et al., 2006; Silvestre et al., 2006; McDonagh and Sheehan, 2008; Brun et al., 2008; Tomanek and Zuzov, 2010; Letendre et al., 2011). These studies reported the expression of cytoskeleton proteins and heat shock proteins in the protein expression patterns (PES) involved in the response to toxicant. Also several energy metabolism proteins like ATP synthase, glyceraldehyde-3-phosphate dehydrogenase (GAPDH), arginine kinase and malate dehydrogenase were found, as well as proteins involved in oxidative stress response, like various isoforms of superoxide dismutase and 2D-PAGE maps (López et al., 2001 and 2002;
Mosquera et al., 2003; Diz and Skibinski, 2007; Tomanek and Zuzov, 2010; Letendre et al., 2011). In general, the identified proteins expressed in mussel foot muscle can be classified into the following functional groups: Cell metabolism and energy, DNA metabolism, Cell signaling, Oxidative stress and Protein structure. Skeletal proteins like actin, tropomyosin, myosins and tubulins, together with matrilin, a protein involved in the extracellular matrix, are the most relevantly expressed proteins. Also proteins involved in energy and metabolic processes like PEP phosphomutase, ATP synthase, ATP-binding proteins and NADH-ubiquinone oxidoreductase are highly expressed in mussel foot muscle. Oxidative stress enzymes and signaling proteins can be detected in 2-DE maps as well, like protein disulfide isomerase, calreticulin and some chaperone proteins like hsp 70 (López
M ol ec ul ar M as s ( kD a) 250 150 100 75 50 37 25 15 10 Isoelectrical point (pH) 20 3 11
highest and the Calich lagoon the one with the lowest salinity values, the PCA results show that protein expression does not vary with this variable, indicating that water salinity does not significantly affect or influence the biochemical and metabolic profile of mussels. The proteins identified as SSP2507, SSP2813, SSP3104, SSP4109, SSP4201, SSP4302, SSP5504 and SSP6609 show expression levels that are highly correlated to the mean value of pH and the quantity glutathione-S transferase (GST) were found
as highly expressed (Manduzio et al., 2005; Mi et al., 2005; Amelina et al., 2006; Apraiz et al., 2006; Sarry et al., 2006; Silvestre et al., 2006; Tomanek and Zuzov, 2010). Analyzing the bi-plot PCA graphs (Figure 4), some associations among locality, environmental variables and protein expression signatures can be identified. Even if mean water salinity values discriminate the three lagoons, being the lagoon of Porto Pozzo the one with the
Figure 3. PCA scores plots for the two first components obtained by analyzing 54 samples and 79 selected spots. Top plot: sample grouping according to locality Porto Pozzo, in red; Tortolì, in green; Calich, in red). Bottom plot: sample grouping according to sampling time (August, in blue; September, in red).
bisphosphate aldolase. The enzyme fructose bisphosphate aldolase takes part in the fourth step of glycolysis, catalyzing the cleavage of fructose 1,6 bisphosphate in glyceraldehyde 3-phosphate. The work of Letendre and colleagues (2011) identified two different spots as isoforms of the enzyme fructose bisphosphate aldolase; both spots show increased expression in intertidal mussels, whatever the contamination is (Letendre et al., 2011). The observed variations clearly indicate an attempt of the mussel to adjust the energetic metabolism in the attempt to face the reduced oxygen tension in tissues and fluids that occur under hypoxia condition (Letendre et al., 2011). In our case, confirmation by MS analysis for the identity of the proteins is compulsory.
The results of the PCA analysis also report that the expressed proteins identified with numbers SSP111, SSP606, SSP803 and SSP2805 are correlated to water temperature change occurring between the localities and during the observed months, while the spot number SSP8301 is conversely affected to the same environmental variable. Some previous works have studied the association between environmental temperature and proteins expression signatures. Heat shock proteins are a group of highly conserved and functionally-related molecular chaperones that are involved in protein-protein interactions. They carry old proteins to the cell's proteasome for their degradation and they help newly synthetised proteins fold properly. Consequently, they are part of the cell repair system. Heat shock proteins (Hsps) levels are differentially induced as a consequence of thermal response. Their expression is increased when cells are exposed to elevated temperatures or other physical chemical stress. The effects of thermal stress on the induction of Hsps isoforms has been studied in different species. The electrophoretic and immunochemical study performed on the scallop species of dissolved oxygen. This relation between
the studied environmental variables pH and dissolved oxygen and the expression of some proteins is in accordance with the Calich features of a eutrophic lagoon. The study of the proteomic response to heat shock on M. galloprovincialis and M. trossolus reported the correlation between temperature change and the protein identified as cytosolic malate dehydrogenase (cMDH) (Tomanek and Zuzov, 2010). The enzyme cMDH is connected through direct metabolic reactions to the other two enzymes phosphoenolpyruvate carboxykinase (PEPCK) and aspartate aminotransferase (AAT); the three reactions linking cMDH, PEPCK and AAT constitute an alternative pathway for energy production during anaerobiosis in marine invertebrates (Tomanek and Zuzov, 2010). Consequently, the three enzymes are active in molluscs during anaerobiosis, a condition that occurs at high water temperatures (Tomanek and Zuzov, 2010). However, a decrease in the expression of the three enzymes cMDH, PEPCK and AAT has been reported in M. galloprovincialis at temperatures around 32°C, suggesting a decrease in metabolism in response to heat stress (Tomanek and Zuzov, 2010). Also the work by Letendre and colleagues (2011) reported a high level of expression for the cytosolic enzyme malate dehydrogenase in the mussels M. edulis exposed to polycyclic hydrocarbons (PAHs) during intertidal condition, particularly during periods of emersion from water corresponding to hypoxia (Letendre et al., 2011). The preliminary result found in the present work is in accordance with what reported by Tomanek and Zuzov (2010) and by Letendre and colleagues (2011) and the spot SSP4302 may be reasonably considered as a putative cytosolic malate dehydrogenase; we expect to confirm the protein identity of the spot SSP4302 through MS analysis. One of the two spots SSP3104 and SSP4109 may correspond to a putative fructose
chance that heat shock proteins may be suitable biomarkers for the assessment of the physiological and metabolic consequences induced in organisms by adaptation to climate change, as it has been considered by other authors (Gonzalez et al., 2010). Comparison with the results of these previous works suggests that the protein identified with name SSP2805 may correspond to a putative Hsp70, while the spot SSP803 may correspond to a heat shock cognate 71; however, it is necessary to confirm our hypothesis through MS protein analysis and identification in protein or genomic database.
In accordance with the results of previous works, the spot SSP111 may be identified as a cytoskeletal protein, whether it is a putative β-tubulin (Tomanek and Zuzov, 2010) or a tropomyosin (Letendre et al., 2011). However, the over-expression of several spots corresponding to β-tubulin isoforms, northern bay scallop (Argopecten irradians),
a relatively heat tolerant estuarine species, and sea scallop (Placopecten magellanicus) living in cold and deep waters, revealed that a prolonged heat shock elicited a significant increase in both Hsp70 and Hsp40 response expression (Brun et al., 2008). Similarly, the expression of heat shock proteins has been studied also in mussels, revealing the existence of several isoforms between closely-related species, whose expression varies as temperature changes, as in M. galloprovincialis and M. trossolus (Tomanek and Zuzov, 2010). Moreover, the heat shock protein Hsp90-α has been identified as a possible biomarker for temperature in the carp (McLean et al., 2007), as well as the heat shock cognate 70 (Hsc70) was detected as putative biomarker for temperature stress in populations of European hake (Gonzalez et al., 2010). These works suggest the future
Figure 4. PCA scores and loadings plot (bi-plot) for the two first components. The associations between the environmental variables and the trace metal content recorded, and the proteins identified as relevant on the basis of ANOVA analysis can be observed. The interactions are: arsenic and mercury content with PES of Porto Pozzo mussels (in green); cadmium content with PES of mussels of Tortolì (in light blue); mean dissolved oxygen and pH with PES of Calich mussels (in red); mean water temperature with PES for proteins commons to all the localities (in dark yellow).
organisms (Kim et al., 2005; Silvestre et al., 2006; Sarry et al., 2006). It has been reported that an acute cadmium exposure elicits the expression of a large number of enzymes involved in energy metabolism, such as the glycolisis and the pentose phosphate pathway (pyruvate kinase [PK], fructose bisphosphate aldolase [ALF], transketolase [TKL] and glyceraldehyde 3-phosphate dehydrogenase [GAPDH]), the tricarboxylic acid pathway (the mitochondrial enzymes malate dehydrogenase [mt-MDH]) and the production of energy (NADH dehydrogenase [NDH]). Also, the over-expression of cytoskeletal proteins like α-tubulin has been reported, as well as of antioxidant enzymes (glutathione S-transferase [GST], thioredoxin peroxidase [TPx] and protein disulfide isomerase) and enzymes involved in the protein turn-over (heat shock protein 70 and proteasome subunits). It is widely assumed that cadmium exerts its toxicity by binding to protein sulfhydryl groups and inducing oxidative stress inside the cell, which consequently increases the production of antioxidant enzymes and chaperonines as a defense system against cadmium-induced toxicity (Silvestre et al., 2006). Consequently, boosting the cell metabolic pathways is necessary to increase the production flux of ATP and NAD(P) H, in order to sustain the energetic demand during the production of reducing molecules and chelating agents involved in the defense process (Sarry et al., 2006). Conversely, a chronic exposure of cadmium induces the down-regulation of some enzymes involved in the energy production process at different levels. These enzymes are ATP synthase (oxidative phosphorylation), arginine kinase (ATP buffering and energy shuttle), GAPDH (glycolysis) and MDH (tricarboxylic acid cycle). Antioxidant enzymes including GST and TPx, chaperonines and proteasomes still keep on being over expressed during the phase of metal acclimation. Notably, responsible for microtubule polymerization,
and to tropomyosin isoforms have been reported both in condition of thermal stress (Tomanek and Zuzov, 2010) and hypoxia (Letendre et al, 2011). Even though changes in the levels of cytoskeletal and structural proteins have been recurrently detected in proteomics whatever the biological question (Monsinjon and Knigge, 2007), changes in the expression of this class of proteins can be very often attributed to the attempt of maintaining cell shape and functionality in cases of hypoxia and heat shock stress (Tomanek and Zuzov, 2010; Letendre et al., 2011). Similarly, also the protein spot named SSP1311, whose expression is related to cadmium levels, may be regarded as a putative α-tubulin.
Correlations can be identified also for the expression of some proteins and the trace metal content in mussel individuals. PCA results show that, on the one hand, the high cadmium content elicits the expression of the proteins identified with names SSP2, SSP18, SSP201, SSP1311, SSP2102, SSP2104, SSP2601, SSP4502, SSP5802, SSP8003 and SSP8208 for mussels reared in the lagoons of Tortolì and Porto Pozzo. For the spots SSP2, SSP201 and SSP8003 expression is significant for the only locality of Porto Pozzo, while for the spot SSP18 the differential expression is significant for both localities Tortolì and Porto Pozzo. On the other hand, Porto Pozzo lagoon is characterized by a correlation between a high content of arsenic and mercury and the patterns of over-expression for the proteins identified as SSP1602, SSP1605, SSP2404, SSP2703, SSP2903 and SSP5701. It is remarkable to note that the differential expression of the spot SSP2601 is positively correlated to the contents of cadmium and negatively correlated to arsenic and mercury. Several studies on the proteomic effects of trace metal exposure (Rodríguez-Ortega et al., 2003; Romero-Ruiz et al., 2006) particularly cadmium have been carried out on different
first attempt to study and characterize the proteome expressed by mussels of the species Mytilus galloprovincialis that have been reared in Sardinia. In our study, the 2D-PAGE reference map of the proteome expressed by the foot muscle of the mussel was reported, elucidating some of the most relevant proteins expressed. It was possible to observe that skeletal and energy metabolism proteins are the most abundantly expressed proteins in the studied tissue. Moreover, by using gel image analysis and statistical data treatment, changes in protein abundances among the three populations of M. galloprovincialis reared in different environmental conditions were explored by using an hypothesis-free approach according to what described by Monsinjon and Knigge (2007). In this very case, from the multivariate nature of proteomic data, a protein expression pattern was recognised that is related to the response to environmental stressor like dissolved oxygen, water acidity, temperature and trace metals.
Some correlations between the expression patterns of specific proteins of interest and the studied environmental variables had been found and our preliminary results are in accordance or confirm the findings of other proteomics works that have been carried out on mussels or other marine invertebrates. Particularly, some proteins can be identified among the selected protein expression pattern of interest and regarded as putative proteins. The identified protein and enzymes are proteins involved in metabolic pathways, like the enzyme fructose bisphosphate aldolase, or in energy pathways, like the cytosolic malate dehydrogenase and the arginine kinase; there are also several cytoskeletal proteins like α-tubulin and β-tubulin, myosin light chains and tropomyosin; proteins involved in antioxidant defense, like the protein disulfide isomerase, and proteins acting in the protein turnover, like different isoforms of the heat shock proteins Hsp70 and the different isoforms of GST are expressed
during the phases of acute and chronic exposure to cadmium, suggesting that the different isoforms have diverse affinity towards the metal ions and they differently react depending on the type of metal exposure (Silvestre et al., 2006). It is evident that chronic metal exposure induces the cell to act a metabolic reshuffling. Several hypothesis have been formulated to explain the reduction in the expression of enzymes involved in metabolic pathways and energy transfer during the process of acclimation to chronic exposure. It is possible that the down-regulation of the enzymes ATP synthase and MDH reflects the decrease in mitochondrial oxidation or, alternatively, a redirection of the energy flux towards the production of NADPH instead of NADH, that can be used as a source of reducing equivalents by the antioxidant systems (Silvestre et al., 2006). Some of the spots considered as differentially expressed in our study may be reasonably identified as putative myosin light chain (spot SSP2), β-tubulin (spot SSP201) and protein disulfide isomerase (spot SSP4502), as well as the spot SSP2601, which is characterized by an expression influenced by cadmium, arsenic and mercury levels, and may reasonably correspond to an isoform of the chaperone protein Hsp70. Moreover, the increase in the expression of the spot SSP8003, corresponding to the histone protein H2B, reflects the modulation of gene transcription by the cell in the attempt to activate specific genes involved in energetic metabolism and antioxidant defences (Letendre et al., 2011). One more time, the preliminary results regarding the protein expression patterns that we have identified in our study have to be confirmed by protein identification by MS analysis and homology research in protein or genomic database.
Conclusions
Diz AP, Skibinski DOF 2007. Evolution of 2-DE protein patterns in a mussel hybrid zone. Proteomics 7: 2111–2120.
Forné I, Abián J, Cerdà J 2010. Fish proteome analysis: Model organisms and non-sequenced species. Proteomics 10: 858-872.
Funabara D, Nakaya M, Watabe S 2001. Isolation and characterization of a novel 45 kDa calponin-like protein from anterior byssus retractor muscle of the mussel Mytilus galloprovincialis. Fish Science 67: 511-517.
Gonzalez EG, Krey G, Espiñeira M, Diez A, Puyet A, Bautista JM 2010. Population Proteomics of the European Hake (Merluccius merluccius). Journal of Proteome Research 9: 6392–6404. Kim YK, Yoo WI, Lee SH, Lee MY 2005. Proteomic
analysis of cadmium-induced protein profile alterations from marine alga Nannochloropsis oculata. Ecotoxicology 14: 589-596.
Knigge T, Monsinjon T, Andersen OK 2004. Surface-enhanced laser desorption/ionization-time of flight-mass spectrometry approach to biomarker discovery in blue mussel (Mytilus edulis) exposed to polyaromatic hydrocarbons and heavy metals under field conditions. Proteomics 4: 2722-2727.
Laemmli UK, 1970. Cleavage of structural proteins during the assembly of the head of bacteriofphage T4. Nature 227: 680-685. Lam PKS 2009. Use of biomarkers in environmental
monitoring. Ocean & Coastal Management 52: 348-354.
Lemos MFL, Soares AMVM, Correia AC, Esteves AC 2010. Proteins in ecotoxicology – How, why and why not? Proteomics 10: 873-887.
Letendre J, Dupont-Rouzeyrol M, Hanquet A-C, Durand F, Budzinski H, Chan , Vaudry D, Rocher B 2011. Impact of toxicant exposure on the proteomic response to intertidal condition in Mytilus edulis. Comparative Biochemistry and Physiology Part D: Genomics and Proteomics 6: 357-369.
López JL, Mosquera E, Fuentes J, Marina A, Vázquez J, Álvarez G 2001. Two-dimensional gel electrophoresis of Mytilus galloprovincialis: differences in protein expression between intertidal and cultured mussels. Marine Ecology Progress Series 224: 149-156.
López JL, Marina A, Vázquez J, Álvarez G 2002. A proteomic approach to the study of the marine mussels Mytilus edulis and M. galloprovincialis. Marine Biology 141: 217-223.
Manduzio H, Cosette P, Gricourt L, Jouenne T, Hsc71; lastly, also the histone protein H2B
is reported. However, in order to confirm and eventually integrate the preliminary findings of this study, more future work is necessary that will be oriented to identify the proteins of interest by means of MS analysis and homology research in protein and genetic sequence database. Moreover, the identified putative proteins will be regarded as possible biomarkers for environmental pollution and climate change only after an adequate procedure of validation of the identified correlations.
Acknowledgement
Sara Elisa Ielmini was recipient of grant of “Master and Back” 2009 Program by Regione Autonoma della Sardegna (RAS). The work was supported by Grant financed by RAS (Regione Autonoma della Sardegna, PO Sardegna FSE 2007-2013 L.R. 7/2007 - “Promozione della ricerca scientifica e dell’innovazione tecnologica in Sardegna”. The authors would like to thank Dr. Giannina Chessa, Istituto Zooprofilattico della Sardegna “Pegreffi” (Sassari) for ICP-MS analysis of trace metal concentration.
References
Amelina H, Apraiz I, Sun W, Cristobal S 2007. Proteomics-based method for the assessment of marine pollution using liquid chromatography coupled with two-dimensional electrophoresis. Journal of Proteome Research 6: 2094–2104. Apraiz I, Mi J, Cristobal S 2006. Identification
of proteomic signatures of exposure to marine pollutants in mussels (Mytilus edulis). Molecular and Cellular Proteomics 5: 1274–1285.
Bjørnstad A, Larsen BK, Skadsheim A, Jones MB, Andersen OK 2006. The potential of ecotoxicoproteomics in environmental monitoring: biomarker profiling in mussel plasma using ProteinChip array technology. Journal of Toxicology and Environmental Health, Part A 69: 77-96.
Brun NT, Bricelj VM, MacRae TH, Ross NW 2008. Heat shock protein responses in thermally stressed bay scallops, Argopecten irradians, and sea scallop, Placopecten magellanicus. Journal of Experimental Marine Biology and Ecology 358: 151-162.
Changes in protein expression profiles in bivalve molluscs (Chamaelea gallina) exposed to four model environmental pollutants. Proteomics 3: 1535-1543.
Romero-Ruiz A, Carrascal M, Alhama J, Gómez-Ariza JL, Abian J, López-Barea J 2006. Utility of proteomics to assess pollutants response of clams from the Doñana bank of Guadalquivir Estuary (SW Spain). Proteomics 6: S245-S255. Sagert J, Waite JH 2009. Hyperunstable
matrix proteins in the byssus of Mytilus galloprovincialis. The Journal of Experimental Biology 212: 2224-2236.
Sarry J-E, Kuhn L, Ducruix C, Lafaye A, Junot C, Hugovieux V, Jourdain A, Bastien O, Fievet JB, Vailhen D, Amekraz B, Moulin C, Ezan E, Garin J, Bourguignon J 2006. The early response of Arabidopsis thaliana cells to cadmium exposure explored by protein and metabolite profiling analyses. Proteomics 6: 2180-2198.
Silvestre F, Dierick JF, Dumont V, Dieu M, Raes M, Devos P 2006. Differential protein expression profiles in anterior gills of Eriocheir sinensis during acclimation to cadmium. Aquatic Toxicology 76: 46–58.
Tognotti E 2002. La coltivazione delle cozze nel golfo di Olbia. In Brigaglia M (ed ), Parliamo della Sardegna. Il Messaggero Sardo, Anno XXXIV, December 2002, Cagliari.
Tomanek L, Zuzov MJ 2010. The proteomic response of the mussel congeners Mytilus galloprovincialis and M. trossolus to acute heat stress: implications for thermal tolerance limits and metabolic costs of thermal stress. The Journal of Experimental Biology 213: 3559-3574.
Viale I 2009. Il comparto dell’acquacoltura in Sardegna alla luce dei risultati dell’indagine conoscitiva Laore, Regional Agency for the development in Agriculture of Sardinia, Siamaggiore, 2nd October 2009.
Wilkins MR, Pasquali C, Appel RD, Ou K, Golaz O, Sanchez J-C, Yan JX, Gooley AA, Hughes G, Humphery-Smith I, Williams KL, Hochstrasser DF 1996. From proteins to proteomes: Large scale protein identification by two-dimensional electrophoresis and amino acid analysis. Nature Biotechnology 14: 61–65.
Lenz C, Andersen OK, Leboulenger F, Rocher B 2005. Proteome modifications of blue mussel (Mytilus edulis L.) gills as an effect of water pollution. Proteomics 5: 4958-4963.
Marques A, Nunes ML, Moore SK, Strom MS 2010. Climate change and seafood safety: Human health implications. Food Research International 43: 1766–1779.
Martínez-Fernández M, Rodríguez-Piñeiro AM, Oliveira E, Páez de la Cadena M, Rolán-Alvarez E 2008. Proteomic comparison between two marine snail ecotypes reveals details about the biochemistry of adaptation. Journal of Proteome Research 7: 4926–4934.
McDonagh B, Sheehan D 2008. Effects of oxidative stress on protein thiols and disulphides in Mytilus edulis revealed by proteomics: Actin and protein disulphide isomerase are redox targets. Marine Environmental Research 66: 193-195.
McLean N, Nam S, Williams D, Lavender L 1995. Book of Abstracts: Molecular Biology in Fish, Fisheries and Aquaculture: an international symposium, Fish Society of British Isles, Plymouth, UK.
Mi J, Orbea A, Syme N, Ahmed M, Cajaraville MP, Cristóbal S 2005. Peroxisomal proteomics, a new tool for risk assessment of peroxisome proliferating pollutants in the marine environment. Proteomics 5: 3954-3965.
Monsinjon T, Knigge T 2007. Proteomic applications in ecotoxicology. Proteomics 7: 2997–3009.
Mosquera E, López JL, Alvarez G 2003. Genetic variability of the marine mussel Mytilus galloprovincialis assessed using two-dimensional electrophoresis. Heredity 90: 432-442.
Piñeiro C, Barros-Velázquez J, Vázquez J, Figueras A, Gallardo JM 2003. Proteomics as a tool for the investigation of seafood and other marine products. Journal of Proteome Research 2: 127–135.
Piñeiro C, Cañas B, Carrera M 2010. The role of proteomics in the study of the influence of climate change on seafood products. Food Research International 43: 1791-1802.
Ramagli LS, Rodriguez L 1985. Quantitation of microgram amounts of protein in two-dimensional polyacrylamide gel electrophoresis sample buffer. Electrophoresis 6: 559-563. Ortega MJ, Grøsvik BE,
LOCALITY SIZE CLASS SAMPLING TIME REPLICATES Calich (C) September (S) August (A) 1 Big (B) 2 Medium (M) 3 Small (S) Tortolì (T) Big (B) Medium (M) Small (S) September (S) August (A) Big (B) Medium (M) Small (S) Porto Pozzo (PP) Big (B) Medium (M) Small (S) September (S) August (A) 1 2 3 1 2 3 1 2 3 1 2 3 1 2 3
TAS 1 TSS 1 CAS 1 CSS 1 PPAS 1 PPSS 1
TAS 2 TSS 2 CAS 2 CSS 2 PPAS 2 PPSS 2
TAS 3 TSS 3 CAS 3 CSS 3 PPAS 3 PPSS 3
TAM 1 TSM 1 CAM 1 CSM 1 PPAM 1 PPSM 1
TAM 2 TSM 2 CAM 2 CSM 2 PPAM 2 PPSM 2
TAM 3 TSM 3 CAM 3 CSM 3 PPAM 3 PPSM 3
TAB 1 TSB 1 CAB 1 CSB 1 PPAB 1 PPSB 1
TAB 2 TSB 2 CAB 2 CSB 2 PPAB 2 PPSB 2
TAB 3 TSB 3 CAB 3 CSB 3 PPAB 3 PPSB 3
Appendix A - Experimental design adopted for proteomics analysis.Two sampling sites (locality), two
sampling periods (sampling times) and three size classes were accounted. Three replicates were randomly sampled for each locality, sampling time and size class. In total, in the three study sites were established eighteen sampling effort conditions. The double latin square experimental design for proteomics analysis is reported. (Locality: T: Tortolì; C: Calich;PP: Porto Pozzo. Size Class: S: Small; M: Medium; B: Big. Sampling Time: A: August; S: September; 1, 2, 3: replicates).
Appendix B - Variation in the expression intensity levels (log form) for the protein spots that resulted
statistically significant. Intensity levels are expressed as mean ± standard deviation (vertical bars denote 0,95 confidence interval). Spot order from left to right and from top to bottom:SSP2, SSP18, SSP111, SSP201, SSP606, SSP803, SSP1311, SSP1602, SSP1605, SSP1805, SSP1808, SSP2102, SSP2104, SSP2404, SSP2507, SSP2601, SSP2703, SSP2805, SSP2810, SSP2813, SSP2903, SSP3102, SSP3104, SSP3105, SSP4109, SSP4201, SSP4302, SSP4502, SSP4807, SSP5504, SSP5701, SSP5802, SSP6514, SSP6609, SSP6613, SSP8003, SSP8115, SSP8208, SSP8301. Histogram order: Tortolì (TA), Calich (CA), Porto Pozzo (PPA) sampled in August, Tortolì (TS), Calich (CS), Porto Pozzo (PPS) sampled in September.