1678
use, distribution and reproduction in any medium, provided the original work is properly cited and is not used for commercial purposes.
B R I E F R E P O R T
Spinal Radiographic Progression in Early Axial
Spondyloarthritis: Five- Year Results From the DESIR Cohort
Sofia Ramiro,
1Désirée van der Heijde,
2Alexandre Sepriano,
3Miranda van Lunteren,
2Anna Moltó,
4Antoine Feydy,
5Maria Antonietta d’Agostino,
6Damien Loeuille,
7Maxime Dougados,
4Monique Reijnierse,
2and
Pascal Claudepierre
8Objective. To analyze the progression of spinal radiographic damage in patients with early axial spondyloarthritis
(SpA).
Methods. Axial SpA patients from the DESIR (Devenir des Spondylarthropathies Indifférenciées Récentes) cohort
with 5- year spinal (cervical and lumbar) radiographs available (n = 549) were included. Two- and 5- year modified
Stoke Ankylosing Spondylitis Spine Score (mSASSS) progression and development of new syndesmophytes (net
change: the number of patients with positive change minus the number of patients with negative change divided by
the total number of patients) were assessed in subgroups defined at baseline according to the Assessment of
Spon-dyloArthritis international Society axial SpA criteria and its arms, modified New York criteria (mNYC) and the presence
of syndesmophytes.
Results. Mean ± SD mSASSS progression was 0.2 ± 0.9 at 2 years and 0.4 ± 1.8 at 5 years. Five- year progression
was higher in the imaging arm (mean ± SD 0.6 ± 2.3), magnetic resonance imaging (MRI)+/mNYC+ (mean ± SD 1.3 ±
4.0), than in the clinical arm only (mean ± SD 0.1 ± 0.7), and highest in patients with syndesmophytes (mean ± SD 2.7
± 5.0). At 5 years, 7% of all patients had a net change of any new syndesmophyte; this value was 10% for the imaging
arm (mNYC+/MRI+ with 18%), 17% for mNYC+ patients, and 42% for patients with syndesmophytes.
Conclusion. Spinal radiographic progression, although limited in early axial SpA, can be captured after 2 years.
Inflammation and damage in the sacroiliac joint are associated with higher radiographic progression. The presence
of baseline syndesmophytes already strongly predicts the development of further structural damage early in the
disease.
INTRODUCTION
The development and evolution of spinal structural damage over time has been investigated in patients with radiographic axial spondyloarthritis (SpA). At a group level, an average progression of 2 modified Stoke Ankylosing Spondylitis Spine Score (mSASSS) units per 2 years (i.e., at the level of the cervical and lumbar spine)
is seen when radiographs are scored with known time order, or 1 mSASSS unit per 2 years when scoring is blinded for chro nologic order (1,2). The presence of syndesmophytes is known to be the strongest predictor for the development of further damage in radi-ographic axial SpA (1).
So far, no studies have focused on the development of structural damage over time in patients with early axial SpA. The
Supported by Pfizer. The DESIR study is conducted as a Programme Hospitalier de Recherche Clinique with Assistance Publique Hopitaux de Paris as the sponsor. The DESIR study is also under the umbrella of the French Society of Rheumatology, which financially supports the cohort.
1Sofia Ramiro, MD, PhD: Leiden University Medical Center, Leiden, and Zuyderland Medical Center, Heerlen, The Netherlands; 2Désirée van der Heijde, MD, PhD, Miranda van Lunteren, Msc, Monique Reijnierse, MD, PhD: Leiden University Medical Center, Leiden, The Netherlands; 3Alexandre Sepriano, MD: Leiden University Medical Center, Leiden, The Netherlands, and NOVA Medical School, Universidade Nova de Lisboa, Lisbon, Portugal; 4Anna Moltó, MD, Msc, PhD, Maxime Dougados, MD: Paris Descartes University, Hôpital Cochin, Hôpitaux de Paris, INSERM U1153, and PRES Sorbonne Paris-City, Paris, France; 5Antoine Feydy, MD, PhD: Paris Descartes
University, Paris, France; 6Maria Antonietta d’Agostino, MD, PhD: Ambroise Paré Hospital, AP-HP, Boulogne-Billancourt, and INSERM U1173, UFR Simone Veil, Université Versailles-Saint Quentin en Yvelines, Saint-Quentin en Yvelines, France; 7Damien Loeuille, MD, PhD: University of Nancy, Nancy, France; 8Pascal Claudepierre, MD: Henri Mondor Hospital, AP-HP, and Université Paris-Est Créteil, Créteil, France.
No potential conflicts of interest relevant to this article were reported.
Address correspondence to Sofia Ramiro, MD, PhD, Department of Rheumatology, Leiden University Medical Center, Albinusdreef 2, 2333 GA Leiden, The Netherlands. E-mail: [email protected].
Submitted for publication June 27, 2018; accepted in revised form October 16, 2018.
development of the Assessment of SpondyloArthritis interna-tional Society (ASAS) classification criteria, although not meant for diagnosis, has raised awareness for early forms of the dis-ease (3). However, radiographic progression in these patients without radiographic sacroiliitis, and also in patients fulfilling the different arms of the classification criteria, has not yet been investigated.
Recently we have shown that the mSASSS is also the most valid, feasible, and sensitive- to- change scoring method in patients with early axial SpA (4). The aim of the current study was to analyze the development and progression of spinal radiographic damage in patients with early axial SpA.
MATERIALS AND METHODS
Study population. Patients from the DESIR (Devenir des
Spondylarthropathies Indifférenciées Récentes) cohort were included (5). Briefly, the DESIR cohort includes 708 patients with a high suspicion of recent axial SpA (<3 years of symptoms). Radiographs of cervical and lumbar spine were performed at baseline, at 2 years, and at 5 years and were read in 1 read-ing campaign. Patients were included in this analysis provided they had ≥2 observations with available radiographs and with an mSASSS progression score calculated. The database used for this analysis was locked in June 2016. DESIR received ethics approval from the Comité de Protections des Personnes Ile de France III.
Scoring methods. Radiographs were scored using the
mSASSS (6). The anterior vertebral corners of the cervical and lumbar segments (total of 24 vertebral corners) were scored in the lateral view for the presence of erosion and/or sclerosis and/or squaring (1 point), syndesmophyte (2 points), and bridg-ing syndesmophyte (3 points). The total score range was 0–72. The radiographs were independently scored by 3 trained readers (scores were averaged) blinded to chronologic order, clinical characteristics, and other imaging data. For the mSASSS, only scores of radiographs with ≤3 missing verte-bral corners per segment (cervical or lumbar) were used (7,8). Individual missing vertebral corners were imputed following a previous method (8). Reliability of the mSASSS readings of this study was good (4).
SIGNIFICANCE & INNOVATIONS
• Spinal radiographic progression, though limited in early axial spondyloarthritis, can be captured after 2 years.
• Inflammation and damage in the sacroiliac joints, i.e., the imaging arm of the Assessment of SpondyloArthritis international Society criteria, particularly magnetic resonance imaging positive/ modified New York criteria positive, are associated with higher spinal radiographic progression. • Syndesmophytes, which can already be present
early in the axial disease, strongly predispose pa-tients for the development of further structural damage.
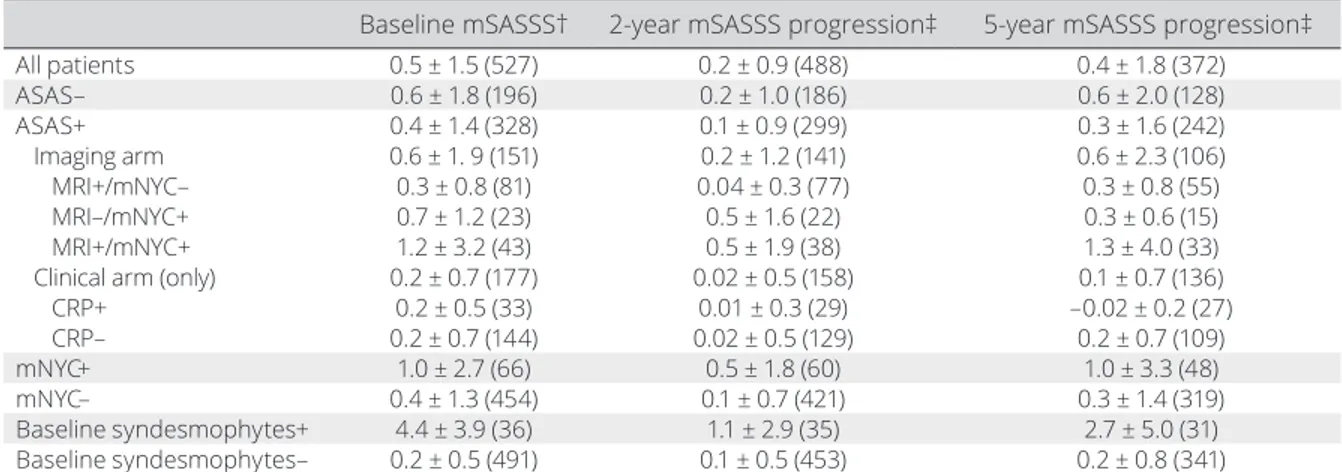
Figure 1. Categories of 5- year modified Stoke Ankylosing Spondylitis Spine Score (mSASSS) progression for the different subgroups
according to the Assessment of SpondyloArthritis international Society (ASAS) and modified New York criteria (mNYC) at baseline. The total number of patients included in this flowchart is lower than the number of included patients, due to a missing radiograph at 5 years. MRI = magnetic resonance imaging; CRP = C- reactive protein.
To classify patients into different subgroups, baseline radio-graphs of the sacroiliac (SI) joints were also scored for the fulfill-ment of the modified New York criteria (mNYC) (9), and magnetic resonance imaging (MRI) for the presence of inflammation (i.e., axial SpA suggestive of bone marrow edema lesions) according to the ASAS definition (MRI+) (10).
Radiographic progression. Two- and 5- year progression
scores (from baseline) were analyzed (mean ± SD) in subgroups of patients defined at baseline according to the following: ASAS axial SpA classification criteria (3) (ASAS+ or ASAS–) and its arms (imaging and clinical); fulfilment of the mNYC (mNYC+ or mNYC–), regardless of the MRI SI joint assessment (9); and the presence or absence of syndesmophytes (Figure 1). To get more insight into the progression scores, these scores were also analyzed in cate-gories: <0, 0, >0 and <2, and ≥2 mSASSS units.
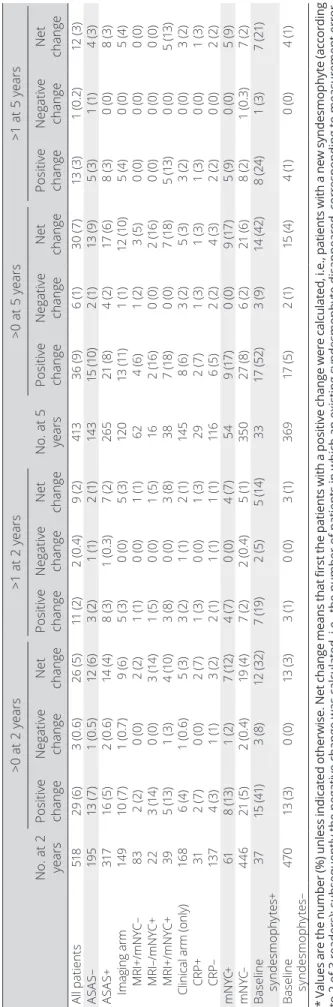
Syndesmophytes, assessed in all available vertebral cor-ners independently of the missing vertebral corcor-ners per seg-ment, were considered present when at least 2 of 3 readers identified them at exactly the same vertebral corner and time point. The number of syndesmophytes was analyzed at baseline and then new syndesmophytes (from baseline) were analyzed at 2 and 5 years. Both cutoffs of >0 and >1 new syndesmo-phytes were considered. The proportion of change is shown as the change above the cutoff (positive change), change below the cutoff (negative change), and net change. Net change cor-responds to the number of patients with a positive change (e.g., ≥1) minus the number of patients with a negative change (e.g., ≥ –1) (numerator) divided by the total number of patients included in the analysis (denominator) (10).
A sensitivity analysis was conducted in a subpopulation, excluding patients who throughout follow- up obtained a different diagnosis than axial SpA (n = 25) and only including patients with an averaged (from all visits) level of confidence in the diagnosis of axial SpA of ≥5 (range 0–10). Additionally, the same analysis was conducted but restricted to patients with an averaged level of confidence in the diagnosis of axial SpA of ≥7. Stata SE software, version 12, was used.
RESULTS
In total, 549 patients were included, mean ± SD age was 34 ± 9 years, mean ± SD symptom duration was 1.5 ± 0.9 years, 46% were males, and 61% were HLA– B27 positive. In all, 63% of patients fulfilled the ASAS classification criteria (ASAS+), 13% fulfilled the mNYC criteria (mNYC+), and 7% had ≥1 baseline syndesmophyte (42% of these patients did not fulfill the ASAS classification criteria [ASAS–]). At baseline, no patients were treated with tumor necrosis factor inhibitors (TNFi), while at 2 years 31% of the included patients and at 5 years 43% were treated with a TNFi. Included patients were somewhat older, were more frequently HLA– B27 positive and ASAS+, and had a slightly higher baseline mSASSS score than those patients with missing radiographs, but differences were small (see Supplementary Table 1, available on the
Arthri-tis Care & Research web site at http://onlin elibr ary.wiley.com/
doi/10.1002/acr.23796/ abstract).
Radiographic progression results. At baseline, the
mean ± SD mSASSS score was 0.5 ± 1.5 for all patients, 0.6 ± 1.8 for ASAS– patients, and 0.4 ± 1.4 for ASAS+ patients, with
Table 1. Mean baseline damage and 2- and 5- year radiographic progression for the different subgroups according to the
ASAS criteria, mNYC, and baseline syndesmophytes*
Baseline mSASSS† 2- year mSASSS progression‡ 5- year mSASSS progression‡
All patients 0.5 ± 1.5 (527) 0.2 ± 0.9 (488) 0.4 ± 1.8 (372) ASAS– 0.6 ± 1.8 (196) 0.2 ± 1.0 (186) 0.6 ± 2.0 (128) ASAS+ 0.4 ± 1.4 (328) 0.1 ± 0.9 (299) 0.3 ± 1.6 (242) Imaging arm 0.6 ± 1. 9 (151) 0.2 ± 1.2 (141) 0.6 ± 2.3 (106) MRI+/mNYC– 0.3 ± 0.8 (81) 0.04 ± 0.3 (77) 0.3 ± 0.8 (55) MRI–/mNYC+ 0.7 ± 1.2 (23) 0.5 ± 1.6 (22) 0.3 ± 0.6 (15) MRI+/mNYC+ 1.2 ± 3.2 (43) 0.5 ± 1.9 (38) 1.3 ± 4.0 (33)
Clinical arm (only) 0.2 ± 0.7 (177) 0.02 ± 0.5 (158) 0.1 ± 0.7 (136)
CRP+ 0.2 ± 0.5 (33) 0.01 ± 0.3 (29) –0.02 ± 0.2 (27) CRP– 0.2 ± 0.7 (144) 0.02 ± 0.5 (129) 0.2 ± 0.7 (109) mNYC+ 1.0 ± 2.7 (66) 0.5 ± 1.8 (60) 1.0 ± 3.3 (48) mNYC– 0.4 ± 1.3 (454) 0.1 ± 0.7 (421) 0.3 ± 1.4 (319) Baseline syndesmophytes+ 4.4 ± 3.9 (36) 1.1 ± 2.9 (35) 2.7 ± 5.0 (31) Baseline syndesmophytes– 0.2 ± 0.5 (491) 0.1 ± 0.5 (453) 0.2 ± 0.8 (341)
* Values are the mean ± SD (number of patients). Progression is measured compared to baseline. ASAS = Assessment of SpondyloArthritis international Society; mNYC = modified New York criteria; mSASSS = modified Stoke Ankylosing Spondylitis Spine Score; MRI = magnetic resonance imaging; CRP = C- reactive protein.
† In 22 of the included patients, the baseline mSASSS was missing, but at least 1 mSASSS progression interval was available and therefore the patient could be included in the analysis.
‡ The 2- and 5- year progression scores cannot be directly compared, because patients are not exactly the same in both groups (due to missing radiographs).
Table 2.
Net change for the development of new syndesmophytes at 2 and 5 years compar
ed to baseline* No. at 2 years >0 at 2 years >1 at 2 years No. at 5 years >0 at 5 years >1 at 5 years Positive change Negative change Net change Positive change Negative change Net change Positive change Negative change Net change Positive change Negative change Net change Al l pa tie nt s 51 8 29 (6 ) 3 ( 0. 6) 26 (5 ) 11 (2 ) 2 ( 0. 4) 9 ( 2) 41 3 36 (9 ) 6 ( 1) 30 ( 7) 13 (3 ) 1 ( 0. 2) 12 (3 ) AS AS – 19 5 13 (7 ) 1 ( 0. 5) 12 (6 ) 3 ( 2) 1 ( 1) 2 ( 1) 14 3 15 (1 0) 2 ( 1) 13 (9 ) 5 ( 3) 1 ( 1) 4 ( 3) AS AS + 317 16 (5 ) 2 ( 0. 6) 14 (4 ) 8 ( 3) 1 ( 0. 3) 7 ( 2) 26 5 21 (8 ) 4 ( 2) 17 (6 ) 8 ( 3) 0 ( 0) 8 ( 3) Imaging arm 14 9 10 (7 ) 1 ( 0. 7) 9 (6 ) 5 ( 3) 0 ( 0) 5 ( 3) 12 0 13 (11 ) 1 ( 1) 12 (1 0) 5 (4 ) 0 ( 0) 5 (4 ) MRI+/mNYC– 83 2 ( 2) 0 ( 0) 2 ( 2) 1 ( 1) 0 ( 0) 1 ( 1) 62 4 (6 ) 1 ( 2) 3 ( 5) 0 ( 0) 0 ( 0) 0 ( 0) MRI–/mNYC+ 22 3 ( 14 ) 0 ( 0) 3 ( 14 ) 1 ( 5) 0 ( 0) 1 ( 5) 16 2 ( 16 ) 0 ( 0) 2 ( 16 ) 0 ( 0) 0 ( 0) 0 ( 0) MRI+/mNYC+ 39 5 ( 13 ) 1 ( 3) 4 ( 10 ) 3 (8 ) 0 ( 0) 3 (8 ) 38 7 ( 18 ) 0 ( 0) 7 ( 18 ) 5 ( 13 ) 0 ( 0) 5 ( 13 )
Clinical arm (only)
16 8 6 (4 ) 1 ( 0. 6) 5 ( 3) 3 ( 2) 1 ( 1) 2 ( 1) 14 5 8 (6 ) 3 ( 2) 5 ( 3) 3 ( 2) 0 ( 0) 3 ( 2) CRP+ 31 2 ( 7) 0 ( 0) 2 ( 7) 1 ( 3) 0 ( 0) 1 ( 3) 29 2 ( 7) 1 ( 3) 1 ( 3) 1 ( 3) 0 ( 0) 1 ( 3) CRP– 13 7 4 ( 3) 1 ( 1) 3 ( 2) 2 ( 1) 1 ( 1) 1 ( 1) 11 6 6 ( 5) 2 ( 2) 4 ( 3) 2 ( 2) 0 ( 0) 2 ( 2) m N YC+ 61 8 ( 13 ) 1 ( 2) 7 ( 12 ) 4 ( 7) 0 ( 0) 4 ( 7) 54 9 ( 17 ) 0 ( 0) 9 ( 17 ) 5 (9 ) 0 ( 0) 5 (9 ) m N YC– 446 21 (5 ) 2 ( 0. 4) 19 (4 ) 7 ( 2) 2 ( 0. 4) 5 ( 1) 35 0 27 (8 ) 6 ( 2) 21 (6 ) 8 ( 2) 1 ( 0. 3) 7 ( 2) Ba se lin e sy nd es m op hy tes + 37 15 (4 1) 3 (8 ) 12 (3 2) 7 ( 19 ) 2 ( 5) 5 ( 14 ) 33 17 (5 2) 3 (9 ) 14 (4 2) 8 ( 24 ) 1 ( 3) 7 ( 21) Ba se lin e sy nd es mop hy te s– 47 0 13 (3 ) 0 ( 0) 13 (3 ) 3 ( 1) 0 ( 0) 3 ( 1) 369 17 (5 ) 2 ( 1) 15 (4 ) 4 ( 1) 0 ( 0) 4 ( 1) * Values are the number (%) unless indicated otherwise. Net change means that first the patients with a positive change were calculated, i.e., patients with a new syndesmophyte (according to 2 of 3 readers); subsequently the negative change was calculated, i.e., the number of patients in which an existing syndesmophyte disappeared, corresponding to measurement error. Net change is the number of patients with a positive change minus the number of patients with a negative change and divided by the total number of patients. ASAS = Assessment of Spon
-dyloArthritis international Society; MRI = magnetic resonance i
maging; mNYC = modified New York criteria; CRP =
an increasing gradient for patients who were MRI+/mNYC–, followed by MRI–/mNYC+, and then MRI+/mNYC+ (Table 1). Mean ± SD 2- year mSASSS progression for all patients was 0.2 ± 0.9 and 5- year progression was 0.4 ± 1.8. Following the baseline difference, 5- year progression was slightly higher in patients who were ASAS– (mean ± SD 0.6 ± 2.0) than ASAS+ patients (mean ± SD 0.3 ± 1.6). mSASSS progression was higher in the imaging arm than in the clinical arm only. Within the imaging arm, there was a gradient starting in the MRI+/ mNYC– patients, with a 5- year progression of mean ± SD 0.3 ± 0.8, followed by MRI–/mNYC+ (mean ± SD 0.3 ± 0.6) and then MRI+/mNYC+ (mean ± SD 1.3 ± 4.0). mNYC+ patients had higher progression (mean ± SD 1.0 ± 3.3) than mNYC– patients, just like patients with baseline syndesmophytes, the group with the highest progression (mean ± SD 2.7 ± 5.0), compared to those patients without syndesmophytes (mean ± SD 0.2 ± 0.8). At 5 years, 23% of the patients showed mSASSS progression (16% progression >0 and <2 units, 7% progression ≥2). These percentages were higher in patients fulfilling the imaging arm criteria (26% progression >0), mNYC+ (30%, with 13% progression ≥2) (Figure 1), and were the high-est in patients with baseline syndesmophytes, with a total of 74% showing a progression >0 and 39% a progression ≥2. At a group level, mean mSASSS values per time point increased from 0.5 at baseline to 1.1 at 5 years (see Supplementary Figure 1, available on the Arthritis Care & Research web site at http://onlin elibr ary.wiley.com/doi/10.1002/acr.23796/ abstract).
New syndesmophytes. At 5 years, 91% of the patients
did not show any new syndesmophytes, 6% had 1 new syn-desmophyte, 1% had 2 new syndesmophytes, and 2% had >2 new syndesmophytes (see Supplementary Figure 2, avail-able on the Arthritis Care & Research web site at http://onlin elibr ary.wiley.com/doi/10.1002/acr.23796/ abstract). Table 2 shows the proportion of patients with a new syndesmophyte. The proportion of patients showing any new syndesmophytes (net change >0) at 5 years was 7% for all patients, 10% for the patients in the imaging arm (ranging from 5% MRI+/mNYC– to 18% MRI+/mNYC+), 17% for mNYC+, and 42% for patients with baseline syndesmophytes. Using a cutoff of >1 new syn-desmophyte, the percentages dropped importantly, and the presence of new syndesmophytes was mostly captured in the patients who were mNYC+ (9%) and especially in patients with baseline syndesmophytes (21%).
Sensitivity analysis. Radiographic progression in the
selected population of patients with a level of confidence in the diagnosis of axial SpA ≥5, and excluding patients with another diagnosis than axial SpA during follow- up, was very similar to the main results (see Supplementary Tables 2–4, available on the Arthritis Care & Research web site at http://onlin elibr ary.
wiley.com/doi/10.1002/acr.23796/ abstract). Radiographic pro-gression in both continuous and categorical forms, as well as net change of new syndesmophytes, was similar across all sub-groups of patients analyzed. Only in the subgroup of patients with baseline syndesmophytes was progression slightly higher in the population of patients from the sensitivity analysis. Similar results are for the patients with a level of confidence of the diag-nosis of axial SpA ≥7 (data not shown).
DISCUSSION
Spinal radiographic damage progression can already be captured after 2 and 5 years of follow- up in early axial SpA. Interestingly, 7% of the patients already presented with syn-desmophytes at baseline, which means that the process of structural damage starts, at least for some, early in the disease.
Radiographic damage and progression were slightly higher in ASAS– patients compared to ASAS+ patients, which was surprising. However, the difference was small and it can likely be explained by the fact that almost half of the patients with baseline syndesmophytes were ASAS– and 8% of the ASAS– patients had baseline syndesmophytes, a strong predictor of further damage, also confirmed in this study (1,11,12). The presence of syndesmophytes is already associated with a bad prognosis in early axial SpA; 74% of the patients with base-line syndesmophytes showed radiographic progression (any mSASSS progression) at 5 years, and almost half developed new syndesmophytes. For the first time, syndesmophytes have been analyzed as a net change. Net change considers a neg-ative change, i.e., a situation in which a syndesmophyte dis-appeared from baseline to a subsequent time point (according to at least 2 of 3 readers), in principle meaning measurement error. Despite being a conservative approach, net change still captured new syndesmophytes in an early axial SpA popula-tion and with varying frequencies in different subgroups, as expected. Net change represents a method that should be further encouraged, also when analyzing the development of new syndesmophytes (10).
As expected, the imaging arm showed more progression than the clinical arm. Within the imaging arm, a gradient was seen, with the lowest progression in the MRI+/mNYC– patients, followed by MRI–/mNYC+ patients, and by MRI+/mNYC+ patients. These findings suggest that the presence of bone marrow edema on the MRI SI joint assessment (i.e., MRI+) is associated with more structural damage in the spine in comparison to patients with a negative MRI SI joint result. Additionally, the findings show that radiographic sacroiliitis (i.e., mNYC+), and particularly the combi-nation of both SI joint inflammation and damage (MRI+/mNYC+), seems to predispose patients to more spinal radiographic pro-gression (10,13). New syndesmophytes at 5 years beyond meas-urement error are mainly seen in the subgroup of patients who are
both MRI+/mNYC+. Structural damage in axial SpA seems, at the group level, to start in the SI joint and expand cranially in the spine. Having a positive C- reactive protein level did not make any differ-ence in the patients in the clinical arm, while clinical inflammation, i.e., disease activity, is known to be associated with spinal radio-graphic progression (14). Possibly a relationship between inflam-mation and structural progression only happens in patients who are already prone for progression, i.e., who have SI joint damage, because such a relationship has only been demonstrated in radi-ographic axial SpA. Sensitivity analyses in a population of patients with a high level of confidence in the diagnosis and excluding patients with other diagnoses during follow- up provided similar results, which adds to the robustness of the findings.
In this study we did not consider the influence of other important factors in radiographic progression, such as patient characteristics (e.g., sex, HLA– B27 positivity, or smoking) or medication (the observed progression was under treatment of TNFi in 40–50% of the patients during any period of the follow- up). Neither did we score degenerative changes. We aimed at evaluating the progression in the different subgroups according to classification criteria or presence of syndes-mophytes. Particularly the influence of medication requires specific analyses and handling potential confounding by indi-cation, which requires a dedicated study.
In conclusion, spinal radiographic progression in early axial SpA is low but measurable beyond measurement error. Inflam-mation and damage in the SI joint, i.e., the imaging arm of the ASAS criteria, particularly MRI+/mNYC+, are associated with higher spinal radiographic progression. Syndesmophytes, which can be present early in the axial disease, seem to strongly predis-pose patients for the development of further structural damage.
ACKNOWLEDGMENTS
The DESIR cohort is conducted under the control of Assis-tance Publique Hopitaux de Paris via the Clinical Research Unit Paris Center and under the umbrella of the French Soci-ety of Rheumatology and Institut National de la Santé et de la Recherche Médicale (INSERM). Database management is performed within the Department of Epidemiology and Bio-statistics (Jean- Pierre Daures, Nimes, France). We also thank the different regional participating centers: Maxime Douga-dos (Paris- Cochin B), Andre Kahan (Paris- Cochin A), Philippe Dieudé (Paris- Bichat), Bruno Fautrel (Paris- La Pitie- Salpetriere), Francis Berenbaum (Paris- Saint- Antoine), Pascal Claudepierre (Creteil), Maxime Breban (Boulogne- Billancourt), Bernadette Saint- Marcoux (Aulnay- sous- Bois), Philippe Goupille (Tours), Jean Francis Maillefert (Dijon), Emmanuelle Dernis (Le Mans), Daniel Wendling (Besancon), Bernard Combe (Montpellier), Liana Euller- Ziegler (Nice), Pascal Richette (Paris Lariboisière), Pierre Lafforgue (Marseille), Patrick Boumier (Amiens), Martin Soubrier (Clermont- Ferrand), Nadia Mehsen (Bordeaux),
Damien Loeuille (Nancy), Rene- Marc Flipo (Lille), Alain Saraux (Brest), Xavier Mariette (Le Kremlin- Bicêtre), Alain Cantagrel (Toulouse), and Olivier Vittecoq (Rouen). We also thank the research nurses, the staff members of the Clinical Research Unit of Paris Center, the staff members of the Biological Resource Center of Bichat Hospital, the staff members of the Department of Statistics of Nimes, and all the investigators, and in particular Jerome Allain, Emmanuelle Dernis, Salah Ferkal, Clement Prati, Marie- Agnes Timsit, and Eric Toussirot for active patient recruitment and monitoring.
AUTHOR CONTRIBUTIONS
All authors were involved in drafting the article or revising it critically for important intellectual content, and all authors approved the final ver-sion to be submitted for publication. Dr. Ramiro had full access to all of the data in the study and takes responsibility for the integrity of the data and the accuracy of the data analysis.
Study conception and design. Ramiro, van der Heijde, Sepriano, van Lunteren, Moltó, Feydy, d’Agostino, Loeuille, Dougados, Reijnierse, Claudepierre.
Acquisition of data. Ramiro, van der Heijde, Sepriano, van Lunteren, Moltó, Feydy, d’Agostino, Loeuille, Dougados, Reijnierse, Claudepierre. Analysis and interpretation of data. Ramiro, van der Heijde, Sepriano, van Lunteren, Moltó, Feydy, d’Agostino, Loeuille, Dougados, Reijnierse, Claudepierre.
ROLE OF THE STUDY SPONSOR
Pfizer had no role in the study design or in the collection, analysis, or interpretation of the data, the writing of the manuscript, or the decision to submit the manuscript for publication. Publication of this article was not contingent upon approval by Pfizer.
REFERENCES
1. Ramiro S, Stolwijk C, van Tubergen A, van der Heijde D, Dougados M, van den Bosch F, et al. Evolution of radiographic damage in an-kylosing spondylitis: a 12 year prospective follow- up of the OASIS study. Ann Rheum Dis 2015;74:52–9.
2. Van der Heijde D, Landewé R, Baraliakos X, Houben H, van Tubergen A, Williamson P, et al. Radiographic findings following two years of infliximab therapy in patients with ankylosing spondylitis. Arthritis Rheum 2008;58:3063–70.
3. Rudwaleit M, van der Heijde D, Landewe R, Listing J, Akkoc N, Brandt J, et al. The development of Assessment of SpondyloArthritis interna-tional Society classification criteria for axial spondyloarthritis (part II): validation and final selection. Ann Rheum Dis 2009;68:777–83. 4. Ramiro S, Claudepierre P, Sepriano A, van Lunteren M, Molto A,
Feydy A, et al. Which scoring method depicts spinal radiographic damage in early axial spondyloarthritis best? Five- year results from the DESIR cohort. Rheumatology (Oxford) 2018;57:1991–2000. 5. Dougados M, Etcheto A, Molto A, Alonso S, Bouvet S, Daures JP, et
al. Clinical presentation of patients suffering from recent onset chron-ic inflammatory back pain suggestive of spondyloarthritis: the DESIR cohort. Joint Bone Spine 2015;82:345–51.
6. Creemers MC, Franssen MJ, van ’t Hof MA, Gribnau FW, van de Putte LB, van Riel PL. Assessment of outcome in ankylosing spon-dylitis: an extended radiographic scoring system. Ann Rheum Dis 2005;64:127–9.
7. Wanders AJ, Landewé RB, Spoorenberg A, Dougados M, van der Linden S, Mielants H, et al. What is the most appropriate radiolog-ic scoring method for ankylosing spondylitis? A comparison of the
available methods based on the Outcome Measures in Rheumatolo-gy Clinical Trials filter. Arthritis Rheum 2004;50:2622–32.
8. Ramiro S, van Tubergen A, Stolwijk C, Landewe R, van de Bosch F, Dougados M, et al. Scoring radiographic progression in ankylosing spondylitis: should we use the modified Stoke Ankylosing Spondy-litis Spine Score (mSASSS) or the Radiographic Ankylosing Spon-dylitis Spinal Score (RASSS)? Arthritis Res Ther 2013;15:R14. 9. Van der Linden S, Valkenburg HA, Cats A. Evaluation of diagnostic
criteria for ankylosing spondylitis: a proposal for modification of the New York criteria. Arthritis Rheum 1984;27:361–8.
10. Dougados M, Sepriano A, Molto A, van Lunteren M, Ramiro S, de Hooge M, et al. Sacroiliac radiographic progression in recent onset axial spondyloarthritis: the 5- year data of the DESIR cohort. Ann Rheum Dis 2017;76:1823–8.
11. Van Tubergen A, Ramiro S, van der Heijde D, Dougados M, Mielants H, Landewe R. Development of new syndesmophytes and bridges
in ankylosing spondylitis and their predictors: a longitudinal study. Ann Rheum Dis 2012;71:518–23.
12. Baraliakos X, Listing J, Rudwaleit M, Haibel H, Brandt J, Sieper J, et al. Progression of radiographic damage in patients with ankylosing spondylitis: defining the central role of syndesmophytes. Ann Rheum Dis 2007;66:910–5.
13. Van der Heijde D, Machado P, Braun J, Hermann KG, Baraliakos X, Hsu B, et al. MRI inflammation at the vertebral unit only mar-ginally predicts new syndesmophyte formation: a multilevel analysis in patients with ankylosing spondylitis. Ann Rheum Dis 2012;71:369–73.
14. Ramiro S, van der Heijde D, van Tubergen A, Stolwijk C, Dougados M, van den Bosch F, et al. Higher disease activity leads to more structural damage in the spine in ankylosing spondylitis: 12- year longitudinal data from the OASIS cohort. Ann Rheum Dis 2014;73:1455–61.