International Journal of Economic Behavior, 5, n. 1, pp. 3
HOW DO THE RICHEST 1% OWN 50% OF
THE NATIONAL WEALTH IN AN INTEGRATED
WALRASIAN EQUILIBRIUM AND
NEOCLASSICAL GROWTH MODEL
Received: Feb 23, 2015
This paper proposes a dynamic economic model of heterogeneous households to explain economic mechanisms of how the richest one per cent of the population own 50% of national wealth. We explain inequality in a purely
wealth and human capital accumulation. The production technologies and economic structure follow the Uzawa two-sector model.
traditional disposable income
after taxes and transfers in the Solow model and many empirical studies) plus the value of the household’s wealth. By applying Zhang’s concept of disposable income and utility function, we describe consumers’ wealth accumulation and consumption behavior. We show how
accumulation, human capital accumulation, and division of labor, and time distribution interact with each other under perfect competition.
people, the rich, the middle, and the poor %, 69%, and 20%. We demonstrate
own more than half of the national wealth and the poo
wealth. The rich household works only 4 hours a day and the poor household 11 hours a day. We show how the system moves to the equilibrium from an initial state and confirm that the equilibrium point is stable. We also d
the capital goods sector, the rich
learning through consuming, and the rich’s propensities to save, leisure, affect growth and inequality
Keywords: Inequality and growth; heterogeneous households.
1. Introduction
It has been reported that the richest 1% of the world population is owning almost half o world’s wealth. Moreover, it does seem that inequality be enlarged in the near future in tandem with rapid economic globalization. There is a need to know
International Journal of Economic Behavior, vol 5, n. 1, pp
International Journal of Economic Behavior, 5, n. 1, pp. 3-14, 201
HOW DO THE RICHEST 1% OWN 50% OF
THE NATIONAL WEALTH IN AN INTEGRATED
WALRASIAN EQUILIBRIUM AND
NEOCLASSICAL GROWTH MODEL
WEI
Ritsumeikan Asia Pacific University, Japan
Accepted: March 24, 2015 Online Published:
Abstract
This paper proposes a dynamic economic model of heterogeneous households to explain economic mechanisms of how the richest one per cent of the population own 50% of national wealth. We explain inequality in a purely competitive economic environment with endogenous wealth and human capital accumulation. The production technologies and economic structure sector model. In this study a household’s disposable income is the (which is the income that a household earns each period of time after taxes and transfers in the Solow model and many empirical studies) plus the value of the household’s wealth. By applying Zhang’s concept of disposable income and utility function, we
scribe consumers’ wealth accumulation and consumption behavior. We show how
accumulation, human capital accumulation, and division of labor, and time distribution interact under perfect competition. We simulate the model with three g
the rich, the middle, and the poor whose shares of the population are
demonstrate the existence of an equilibrium point at which the rich 1% own more than half of the national wealth and the poor 20% less than 10% of the national wealth. The rich household works only 4 hours a day and the poor household 11 hours a day. We show how the system moves to the equilibrium from an initial state and confirm that the We also demonstrate how changes in the total factor productivity of he rich’s human capital utilization efficiency, the rich’s efficiency of learning through consuming, and the rich’s propensities to save, to consume, and to enjoy
growth and inequality.
Inequality and growth; learning by consuming; wealth and income distribution;
It has been reported that the richest 1% of the world population is owning almost half o world’s wealth. Moreover, it does seem that inequality be enlarged in the near future in tandem with rapid economic globalization. There is a need to know determinants
International Journal of Economic Behavior, vol 5, n. 1, pp. 59-80
14, 201
HOW DO THE RICHEST 1% OWN 50% OF
THE NATIONAL WEALTH IN AN INTEGRATED
WALRASIAN EQUILIBRIUM AND
NEOCLASSICAL GROWTH MODEL
WEI-BIN ZHANG
Ritsumeikan Asia Pacific University, Japan
Published: August 10, 2015
This paper proposes a dynamic economic model of heterogeneous households to explain economic mechanisms of how the richest one per cent of the population own 50% of national competitive economic environment with endogenous wealth and human capital accumulation. The production technologies and economic structure In this study a household’s disposable income is the (which is the income that a household earns each period of time after taxes and transfers in the Solow model and many empirical studies) plus the value of the household’s wealth. By applying Zhang’s concept of disposable income and utility function, we scribe consumers’ wealth accumulation and consumption behavior. We show how wealth accumulation, human capital accumulation, and division of labor, and time distribution interact with three groups of the whose shares of the population are, respectively, the 1 at which the rich 1% r 20% less than 10% of the national wealth. The rich household works only 4 hours a day and the poor household 11 hours a day. We show how the system moves to the equilibrium from an initial state and confirm that the the total factor productivity of ’s human capital utilization efficiency, the rich’s efficiency of to consume, and to enjoy
; wealth and income distribution;
It has been reported that the richest 1% of the world population is owning almost half of the world’s wealth. Moreover, it does seem that inequality be enlarged in the near future in tandem determinants of inequality and
dynamics of inequality. This need is emphasized by Forbes (2000) as follows: “careful reassessment of the relationship between these two variables (growth rate and income inequality) needs further theoretical and empirical work evaluating the channels through which inequality, growth, and any other variables are related.” Surprisingly theoretical economics still has little to say about determinants and dynamics of economic growth and inequality. In a systematic review on the literature of economic growth and inequality of income and wealth, Zhang (2006) points out that although the importance of issues related to growth and inequality was well recognized long time ago by economists such as Marx and Kaldor, modern theoretical economics has failed in providing a proper analytical framework to analyze relations between growth and inequality.
Without a proper analytical framework, economics can hardly analyze extremely complicated dynamic issues with nonlinear interactions among many variables over time. Even mathematically it had been hopeless for any theoretical economists to deal with the issues in free market economies in an insightful and comprehensive manner even a few decades ago before computer was available for simulating high dimensional nonlinear dynamic models. The purpose of this study is to re-address issues related to growth and inequality with Zhang’s concept of disposable income and utility function. We are especially interested in a phenomenon of contemporary free-market economies where the richest 1% of the population own more than almost half of wealth. By comparative dynamic analysis we also demonstrate some possibilities that inequalities will not be shrunk but will be enlarged in free market economies with rapid technological changes and connected markets. In order to analyze these issues, we introduce endogenous human capital and human capital externalities into the general equilibrium theory with heterogeneous households and endogenous wealth.
This study is based on Zhang’s integrated Walrasian general equilibrium and neoclassical growth theory (Zhang, 2006, 2014). Both the Walrasian general equilibrium theory and neoclassical growth theory have played a key role in the development of formal economic theories in modern times. The Walrasian general equilibrium theory was initially developed by Walras (Walras, 1874). The theory was further developed and refined mainly in the 1950s by Arrow, Debreu and others (e.g., Arrow and Debreu, 1954; Gale, 1955; Nikaido, 1956, 1968; Debreu, 1959; McKenzie, 1959; Arrow and Hahn, 1971; Arrow, 1974; and Mas-Colell et al., 1995). The theory solves equilibrium of pure economic exchanges with heterogeneous supplies and households. From the perspective of modern economies the theory has a serious shortcoming which is failures of properly including endogenous wealth (and other factors such as environment, resources, human capital and knowledge) irrespective many attempts done by many economists. Walras failed in developing a general equilibrium theory with endogenous saving and capital accumulation (e.g., Impicciatore et al., 2012).
Over years many economists attempted to further develop Walras’ capital accumulation within Walras’ framework (e.g., Morishima, 1964, 1977; Diewert, 1977; Eatwell, 1987; Dana et al. 1989; and Montesano, 2008). As it lacks proper economic mechanisms for determining wealth accumulation, the traditional Walrasian general equilibrium theory is not proper for addressing issues related to growth and inequality. On the other hand, the neoclassical growth theory deals with endogenous wealth accumulation with microeconomic foundation (e.g., Ramsey model). Nevertheless, the theory is not successful in dealing with growth with heterogeneous households. Almost all of the neoclassical growth models are built for a homogenous population. Some neoclassical growth models with endogenous wealth accumulation consider heterogeneous households. Nevertheless, the heterogeneity in these studies is by the differences in the initial endowments of wealth among different types of households rather than in preferences (see, for instance, Chatterjee, 1994; Caselli and Ventura, 2000; Maliar and Maliar, 2001; Penalosa and Turnovsky, 2006; and Turnovsky and Penalosa, 2006). Different households are essentially homogeneous in the sense that all the households
International Journal of Economic Behavior, 5, n. 1, pp. 3
have the same preference utility function in the traditional Ramsey approach. In our approach we consider different ethnic groups have different utility functions.
analyzing growth and inequality. Zhang (2006, 2014) integrates with the Walrasian general equilibrium theory
function.
This study is based on Zhang’s approach to discuss growth and inequality. noted that economists made efforts in
equilibrium analysis (e.g., Jensen and Larsen, 2005). As far as the Walrasian general equilibrium theory and the traditional capital theory are concerned, the issues examined by
approach with heterogeneous capital and heterogeneous households ( Bewley, 1982; Amir and Evstigneev, 1999
main difference between Polterovich modeling of household behavior.
Ramsey model, while this study is based on Zhang take account of endogenous human capital.
Both physical wealth and human c
inequality. Wealth differs between households partly because people have different propensities to save and human capital differs between people partly because they have different abilities and preferences in accumulating human capital.
model in describing economic
generalized and extended in different ways over years (see, Diamond, 1965; Stiglitz, 1967; Mino, 1996; and Drugeon and Venditti, 2001).
with the Walrasian general equilibrium theory for studying dynamic interactions among growth, wealth and income distribution, and economic structures.
treat human capital accumulation as an endogenous process of economic growth. In economic theory there are only a few theoretical models which
endogenous wealth and human capital accumulation is influenced by Arrow
and Zhang’s learning through consuming (leisure creativity). paper on economic growth with heterog
difference between this study and Zhang (2012) is that this study treats human capital as endogenous process while the previous study by Zhang considers human capital fixed. The main difference between this study and Zhang (2014) is that this study treats time distribution as endogenous and the previous study by Zhang neglects time distribution issues. The two studies have different human capital accumulation equations.
The rest of this paper is organized a
households neoclassical growth model with capital accumulation and accumulation. Section 3 shows that the dynamics of the economy with can be described by 2J-dime
system is too complicated, we demonstrate some of the dynamic properties by simulation when the economy consists of three types of households. Section 4 carries
analysis with regard to the total factor productivity of the capital goods sector, t
capital utilization efficiency, the rich’s efficiency of learning through consuming, and the rich’s propensities to save, to consum
2. The Basic Model
The economy consists of one capital good production sectors are similar to the
Burmeister and Dobell 1970; Azariadis, 1993
International Journal of Economic Behavior, 5, n. 1, pp. 3-14, 201
tility function in the traditional Ramsey approach. In our approach we consider different ethnic groups have different utility functions. It implies its limited power in analyzing growth and inequality. Zhang (2006, 2014) integrates the neoclassical growth
with the Walrasian general equilibrium theory with his concept of disposable income and utility This study is based on Zhang’s approach to discuss growth and inequality.
economists made efforts in integrating the neoclassical growth theory with the general equilibrium analysis (e.g., Jensen and Larsen, 2005). As far as the Walrasian general equilibrium theory and the traditional capital theory are concerned, the issues examined by
geneous capital and heterogeneous households (Polterovich, 1977, 1983; Amir and Evstigneev, 1999) are quite similar to the model in this study.
Polterovich’s model and our approach is human capital dynamics the of household behavior. Polterovich’s approach to household is mainly based on the Ramsey model, while this study is based on Zhang’s approach. Polterovich’
take account of endogenous human capital.
Both physical wealth and human capital are the determinants of economic growth and inequality. Wealth differs between households partly because people have different propensities to save and human capital differs between people partly because they have different abilities and in accumulating human capital. This study follows Uzawa’s two sector growth model in describing economic structure (Uzawa, 1961). Uzawa’s two-sector model has been generalized and extended in different ways over years (see, Diamond, 1965; Stiglitz, 1967; Mino, 1996; and Drugeon and Venditti, 2001). We will integrate the neoclassical growth theory with the Walrasian general equilibrium theory for studying dynamic interactions among growth, wealth and income distribution, and economic structures. A unique feature of our approach is to treat human capital accumulation as an endogenous process of economic growth. In economic theory there are only a few theoretical models which study inequality and growth
wealth and human capital accumulation. Our approach to human capital is influenced by Arrow’s learning by doing, Uzawa’s learning formal education, and Zhang’s learning through consuming (leisure creativity). This paper also extends a recent paper on economic growth with heterogeneous households by Zhang (2012
difference between this study and Zhang (2012) is that this study treats human capital as endogenous process while the previous study by Zhang considers human capital fixed. The main study and Zhang (2014) is that this study treats time distribution as endogenous and the previous study by Zhang neglects time distribution issues. The two studies have different human capital accumulation equations.
The rest of this paper is organized as follows. Section 2 defines the heterogeneous households neoclassical growth model with capital accumulation and
. Section 3 shows that the dynamics of the economy with J types of households ensional differential equations. As mathematical analysis of the system is too complicated, we demonstrate some of the dynamic properties by simulation when the economy consists of three types of households. Section 4 carries out comparative dynamic
the total factor productivity of the capital goods sector, t
capital utilization efficiency, the rich’s efficiency of learning through consuming, and the rich’s to consume, and to enjoy leisure. Section 5 concludes the study.
The economy consists of one capital goods and one consumer goods sectors.
are similar to the standard two-sector growth model by Uzawa (Uzaw Azariadis, 1993; Barro and Sala-i-Martin, 1995
14, 201
tility function in the traditional Ramsey approach. In our approach we It implies its limited power in the neoclassical growth theory with his concept of disposable income and utility This study is based on Zhang’s approach to discuss growth and inequality. It should be neoclassical growth theory with the general equilibrium analysis (e.g., Jensen and Larsen, 2005). As far as the Walrasian general equilibrium theory and the traditional capital theory are concerned, the issues examined by Polterovich’s Polterovich, 1977, 1983; ) are quite similar to the model in this study. The model and our approach is human capital dynamics the approach to household is mainly based on the ’s approach does not apital are the determinants of economic growth and inequality. Wealth differs between households partly because people have different propensities to save and human capital differs between people partly because they have different abilities and s two sector growth sector model has been generalized and extended in different ways over years (see, Diamond, 1965; Stiglitz, 1967; the neoclassical growth theory with the Walrasian general equilibrium theory for studying dynamic interactions among growth, ature of our approach is to treat human capital accumulation as an endogenous process of economic growth. In economic study inequality and growth with both . Our approach to human capital , Uzawa’s learning formal education, This paper also extends a recent eneous households by Zhang (2012, 2014). The main difference between this study and Zhang (2012) is that this study treats human capital as endogenous process while the previous study by Zhang considers human capital fixed. The main study and Zhang (2014) is that this study treats time distribution as endogenous and the previous study by Zhang neglects time distribution issues. The two studies s follows. Section 2 defines the heterogeneous households neoclassical growth model with capital accumulation and human capital types of households nsional differential equations. As mathematical analysis of the system is too complicated, we demonstrate some of the dynamic properties by simulation when out comparative dynamic the total factor productivity of the capital goods sector, the rich’s human capital utilization efficiency, the rich’s efficiency of learning through consuming, and the rich’s
. Section 5 concludes the study.
and one consumer goods sectors. Most aspects of the by Uzawa (Uzawa, 1965; 1995). Households own
assets of the economy and distribute their incomes to consume and to save. Firms use labor and physical capital inputs to supply goods and services.
Exchanges take place in perfectly competitive markets. Factor markets work well and the available factors are fully utilized at every moment. Saving is undertaken only by households. All earnings of firms are distributed in the form of payments to factors of production, labor, managerial skill and capital ownership. The population is classified into J groups. Each group has a fixed population, Nj, ( j =1,..., J). Let prices be measured in terms of the commodity
and the price of the commodity be unit. Let p
( )
t denote the price of consumer goods at time .tWe denote wage and interest rates by wj
( )
t and r( )
t , respectively. We use Hj( )
t to stand for group j ’s level of human capital. It should be noted that although we call it human capital, thevariable Hj
( )
t may consist of not only human capital such as skills and knowledge but also intangible assets such as social status, reputation, and social relations.We use subscript index i and s to respectively stand for capital goods and consumer goods. We use Nm
( )
t and Km( )
t to stand for the labor force and capital stocks employed by sector m . Let Tj( )
t stand for the work time of a typical worker in group .j The variableN( )
t representsthe total qualified labor force. A worker’s labor force is T
( )
t Hmj( )
t ,j
j where m is a parameter j
measuring utilization efficiency of human capital by group .j The labor input is the work
time by the effective human capital. A group’s labor input is the group’s population by each member the labor force, that is, Tj
( )
t Hmj j( )
t Nj.As the total qualified labor force is the sum of all the groups’ labor forces, we have N
( )
t as follows( )
( )
( )
, 1∑
= = J j j m j j t H t N T t N j j =1,..., J. (1)Full employment of labor and capital
The total labor force is employed by the two sectors. The condition of full employment of labor force implies
( )
t N( )
t N( )
t .Ni + s = (2) The total capital stock K
( )
t is allocated between the two sectors. As full employment of capital is assumed, we have( )
t K( )
t K( )
t .Ki + s = (3) Let kj
( )
t denote per capita wealth of group j at .t Group j ’s wealth is kj( )
t Nj. As wealth is held by the households, we have
( )
( )
. 1∑
= = J j j j t N k t K (4)International Journal of Economic Behavior, 5, n. 1, pp. 3
The capital goods sector
Let Fm
( )
t stand for the productithe capital goods sector is specified as follows
( )
= i i( ) ( )
i , ii t A K t N t
F αi βi α
where A i,
α
i, andβ
i are positive parameters. factors, capital and labor force.marginal conditions for the capita
( )
( )
( )
, w( )
t t K t F t r i i i k α δ = = +The consumer goods sector
The production function of the
( )
= s s( ) ( )
s , s t A K t N tF αs βs α
where A s, αs, and βs are
( )
( ) ( )
( )
, t K t F t p t r s s s kα
δ
= +Consumer behaviors and wealth dynamics
Consumers make decisions on choice of leisure time, consumption levels of services and commodities as well as on how much to save.
( ) ( )
t wt H( )
t , j 1,w mj
j
j = =
Per capita current income from the interest
( ) ( )
t w tTj j is
( ) ( ) ( )
t r t k t T( ) (
t wyj = j + j j
We call yj
( )
t the current income in the sense that it comes from consumers human capital and efforts and consumersvalue of wealth that consumers c
can be conducted instantaneously without any transac is given by
( )
( )
( ) (
1 ˆ t y t k tyj = j + j = +
International Journal of Economic Behavior, 5, n. 1, pp. 3-14, 201
stand for the production function of sector m , m=i, s. The production function of is specified as follows , 1 , 0 , i > i + i = i β α β are positive parameters. The capital goods sector
labor force. We assume that all the markets are perfectly competitive. capital goods sector are
( )
( )
. t N t F i i i β =he production function of the consumer goods sector is specified as follows , 0 , , 1 > = + s s s s β α β α
are technological parameters. The marginal conditions are
( )
( ) ( )
( )
. t N t F t p t w s s sβ
=Consumer behaviors and wealth dynamics
Consumers make decisions on choice of leisure time, consumption levels of services and commodities as well as on how much to save. We note that the wage rate of g
. ,
,L J
income from the interest payment r
( ) ( )
t kj t and the wage payment( )
t . the current income in the sense that it comes from consumersan capital and efforts and consumers’ current earnings from ownership of wealth. The total value of wealth that consumers can use is kj
( )
t . Here, we assume that selling and buying wealthcan be conducted instantaneously without any transaction cost. The per capita disposable income
( )) ( )
t k t W( )
t .r j + j
+
14, 201
The production function of
(5) capital goods sector employs two input We assume that all the markets are perfectly competitive. The
(6)
(7) The marginal conditions are
(8)
Consumers make decisions on choice of leisure time, consumption levels of services and We note that the wage rate of group j is
(9)
and the wage payment
the current income in the sense that it comes from consumers’ payment for current earnings from ownership of wealth. The total Here, we assume that selling and buying wealth per capita disposable income
where Wj
( )
t ≡Tj( ) ( )
t wj t is the wage income. The disposable income is used for saving, consumption, and education. It should be noted that the value, kj( )
t , (i.e., p( ) ( )
t kj t with( )
t =1p ), in (10) is a flow variable. Under the assumption that selling wealth can be conducted instantaneously without any transaction cost, we may consider kj
( )
t as the amount of the income that the consumer obtains at time t by selling all of his wealth. Hence, at time t the consumer has the total amount of income equaling yˆj( )
t to distribute between saving and consumption. It should be noted that in the traditional neoclassical growth theory and most empirical studies disposable income is defined as the income that a household earns each period of time after taxes and transfers. It is supposed to be the money available to the household for spending on goods and services. Indeed, when wealth plays minor role in analyzing behavior of households the traditional concept is not misleading. Nevertheless, when wealth is large and plays an important role in affecting household behavior, the omission in the money available for spending may be misleading. Obviously, a rich man with the net value of wealth US$70 billions will save a lot even if he had no current income (no pension and wealth earning a net zero rate of return) as common sense tells us.According to the neoclassical growth theory (such as the most well-known Solow model in growth theory), the rich man makes neither consumption nor saving as his disposable income is zero. In our model, the man’s disposable income is 0 + 70 = 70. If his consumption annually is 0.1 billions, his saving is 70 – 0.1 = 69.9 billions US dollars. His actual saving rate is saving/(disposable income) = 69.9/70, rather than 0 as in a national statistical record. In our approach rich people have a high propensity to save than poor people partly as the extremely rich have too much to spend. As our approach accumulated wealth will play another important role in protecting the social status as wealth helps the rich to accumulate more physical capital (due to interest returns of wealth) as well as human capital (due to easy access to best education, for instance), to build more useful social networks, and maintain reputation of being rich.
The typical consumer distributes the total available budget between saving sj
( )
t , consumption of consumer goods cj( )
t . The budget constraint is( ) ( )
t c t s( )
t yˆ( )
t(
1 r( )
t) ( )
k t w( ) ( )
t T t ,p j + j = j = + j + j j (11) The time constraint for everyone
( )
t T( )
t T0,Tj + j = (12) where Tj
( )
t is the leisure time of the representative household and T is the total available 0time. Substituting (12) into (11) yields
( ) ( ) ( ) ( )
t T t pt c t s( )
t y( )
t(
1 r( )
t) ( )
k t T0w( )
t .wj j + j + j = j ≡ + j + j (13) The variable yj
( )
t is the disposable income when the household spends all the availabletime on work. We assume that the consumer’s utility function is dependent on Tj
( )
t , cj( )
t , and( )
tInternational Journal of Economic Behavior, 5, n. 1, pp. 3
( )
= 0( ) ( ) (
0 0 j t c t s t T t U σj ξj λjwhere σj0 is the propensity to use leisure time, the propensity to own wealth. This utility function different economic problems. Maximizing
( )
( )
( )
, c( )
t t w t y t T j j j j jσ
= = where , 0 0 0 j j j j jρ
σ
ξ
ρ
σ
≡ ≡Change in the household wealth
According to the definitions of group j is given by
( )
t s( )
t k( )
t .k&j = j − j
This equation simply states that the change in wealth is equal to saving minus dissaving.
Dynamics of human capital
In economic theory there are “learning by producing”, and
doing into growth theory. The basic idea is that people accumulate more skills and have more ideas when they are engaged in economic production.
between investment in education and capital accumulation
The basic idea is that education uses social resources but enable people to have more skills and knowledge. Zhang (2007) introduced impact of consumpti
the so-called creative leisure) into growth theory.
knowledge can be obtained mainly through working experiences. His idea has narrow implications as there are many othe
which are classified neither as formal education as in the Uzawa model nor as production as in the Arrow model, such as playing computer games, having social parties, being brought up by rich and educated parents, living in a decent society, touring different parts of the world, and being extremely rich, may have strong effects on human capital. Influencing by the three approaches just mentioned and being concerned with providing a case of richest 1
wealth, we propose that the human capital accumulation is described as follows
( )
~( ) ( )
( )
t H T t k t c t H j j j a j j j j j j jυ
π θ υ = &International Journal of Economic Behavior, 5, n. 1, pp. 3-14, 201
)
,σ
j0,ξ
j0,λ
j0 > 0, is the propensity to use leisure time,ξ
j0 is the propensity to consume, and the propensity to own wealth. This utility function proposed by Zhang (1993)Maximizing Uj
( )
t subject to (13) yields( )
( )
t , s( )
t y( )
t , p t y j j j s j jλ
ξ
= . 1 , , 0 0 0 0 0 0 j j j j j j j jλ
ρ
λ
ρ
σ
ξ
λ
ξ
+ + ≡ ≡ wealthfinitions of sj
( )
t , the wealth accumulation of the representative household in This equation simply states that the change in wealth is equal to saving minus dissaving.n economic theory there are three sources of improving human capital, through education , and “learning by leisure”. Arrow (1962) first introduced learning by
. The basic idea is that people accumulate more skills and have more ideas when they are engaged in economic production. Uzawa (1965) took account of
between investment in education and capital accumulation in his well-known two
The basic idea is that education uses social resources but enable people to have more skills and Zhang (2007) introduced impact of consumption on human capital accumulation (via called creative leisure) into growth theory. Arrow’s idea of learning by doing is that useful knowledge can be obtained mainly through working experiences. His idea has narrow implications as there are many other sources of accumulating skills and knowledge. Activities which are classified neither as formal education as in the Uzawa model nor as production as in the Arrow model, such as playing computer games, having social parties, being brought up by ducated parents, living in a decent society, touring different parts of the world, and being extremely rich, may have strong effects on human capital. Influencing by the three approaches just mentioned and being concerned with providing a case of richest 1
wealth, we propose that the human capital accumulation is described as follows
( )
( )
, t H t j hjδ
− 14, 201 (14) is the propensity to consume, andλ
j0 proposed by Zhang (1993) is applied to(15)
of the representative household in
(16) This equation simply states that the change in wealth is equal to saving minus dissaving.
sources of improving human capital, through education, Arrow (1962) first introduced learning by . The basic idea is that people accumulate more skills and have more Uzawa (1965) took account of trade-offs known two-sector model. The basic idea is that education uses social resources but enable people to have more skills and on on human capital accumulation (via Arrow’s idea of learning by doing is that useful knowledge can be obtained mainly through working experiences. His idea has narrow r sources of accumulating skills and knowledge. Activities which are classified neither as formal education as in the Uzawa model nor as production as in the Arrow model, such as playing computer games, having social parties, being brought up by ducated parents, living in a decent society, touring different parts of the world, and being extremely rich, may have strong effects on human capital. Influencing by the three approaches just mentioned and being concerned with providing a case of richest 1% owing 50% wealth, we propose that the human capital accumulation is described as follows
where δhj is the depreciation rates of human capital, 0<δhj<1. In (17), υ~j, aj, υj, and j
θ are non-negative parameters, and πj is a parameter. In our approach different groups may have different depreciation rates of human capital. The human capital accumulation in this study is influenced by different approaches to human capital accumulation in the literature of endogenous human capital. We now interpret the items in ~ j j j / j.
j j j a j jc k T H π θ υ
υ
The item aj j cwhich implies a positive relation between human capital accumulation and consumption is influenced by Uzawa’s learning through education and Zhang’s learning through consumption. As education is classified as the consumption of services, a higher level of consumption may imply a higher investment in education. On the other hand, a higher consumption also implies that the household may accumulate more through other consumption activities. The item j
j
kυ
which implies a positive relation between wealth and human capital accumulation can be interpreted that more wealth means, for instance, a higher social status. More wealth may also help one to maintain professional reputation. The specification of j
j
Tθ is influenced by Arrow’s learning by doing. More work accumulates more human capital. The term j
j
Hπ implies that more human capital makes it easier (more difficult) to accumulate knowledge in the case of
0 < j
π
(π
j >0).Demand of and supply for consumer goods
The output of the consumer goods sector is consumed only by the households. The demand for consumer goods from a group is cj
( )
t Nj. The condition that the total demand is equal to thetotal supply implies
( )
( )
. 1 t F N t c s J j j j =∑
= (18)Demand of and supply for capital goods
As output of the capital goods sector is used only as capital goods, the output equals the depreciation of capital stock and the net savings. That is
( )
( )
( )
( )
. 1 t F t K t K N t s k i J j j j − + =∑
=δ
(19)We completed the model. The model is structurally general in the sense that some well-known models in theoretical economics can be considered as its special cases. For instance, if we fix wealth and human capital and allow the number of types of households equal the population, then the model is a Walrasian general equilibrium model. If the population is homogeneous, our model is structurally similar to the neoclassical growth model by Solow (1956) and Uzawa (1961). It is structurally similar to the multi-class models by Pasinetti and Samuelson (e.g., Samuelson, 1959; Pasinetti, 1960, 1974). We now examine dynamics of the model.
International Journal of Economic Behavior, 5, n. 1, pp. 3
3. The Dynamics and Its Properties
As the system consists of any number of types of households, its dynamics dimensional. The following lemma shows that the economic dynamics is represented by dimensional differential equations.
( ) ( )( )
. t w t r t z ≡ +δ
k LemmaThe dynamics of the economy equations system with z
( )
t ,{
k( )
( )
(
H1 t ,L, HJ t)
, as the variables( )
t 1(
z( )
t ,(
H( )
t)
,{
k(
z& =Λ j j( )
t(
z( )
t ,(
H( )
t)
,{
k k&j =Λj j j( )
t(
z( )
t ,(
H( )
t) {
, H& j =Ωj jin which Λj and Ωj are unique functions of defined in the appendix. For given
determined at any point in time by the following procedure: (A4) → p
( )
t by (A5) → k1(
t(A8) → y
( )
tj by (A6) → K
( )
t ,Tj cj
( )
t , and sj( )
t by (15)Following the lemma, we have a computational program to follow the motion of the dynamic economic system by simulating
households. As the system is nonlinear and is of high dimension, it is difficul analyze behavior of the system.
0 . 0 0 , 20 69 1 3 2 1 3 2 1 = = m m m N N N 1 . 0 2 . 0 3 . 0 , 1 . 0 4 . 0 8 . 0 3 2 1 3 2 1 = = a a a v v v 32 . 0 , 9 . 0 , 1 = = = s i i A A
α
. 05 . 0 , 08 . 0 3 = k = hδ
δ
Group 1, 2 and 3 populations are respectively 's
population. The capital goods sector and
International Journal of Economic Behavior, 5, n. 1, pp. 3-14, 201
Dynamics and Its Properties
As the system consists of any number of types of households, its dynamics e following lemma shows that the economic dynamics is represented by dimensional differential equations. First we introduce a variable
economy is governed by the following 2 dimensional differential J
( )
t}
, kj and(
Hj( )
t)
, where{ }
kj( )
t ≡(
k2( )
t ,L,k as the variables( )
t})
,( )
t})
, j 2,...,J, j =( )
{ })
kj t , j =1,..., J,are unique functions of z
( )
t ,{ }
kj( )
t ,and(
Hj( )
t)
at any pppendix. For given z
( )
t ,{ }
kj( )
t ,and(
Hj( )
t)
, the other variables are uniquely time by the following procedure: r( )
t and w( )
t by (A3))
t by (A18) → Ni
( )
t by (A12) → N( )
t by (A11)( )
tKi and Ks
( )
t by (A1) → F( )
ti and Fs
( )
t by the definitions ) → K( )
t by (4).Following the lemma, we have a computational program to follow the motion of the dynamic economic system by simulating the dynamic equations with any number of types of
he system is nonlinear and is of high dimension, it is difficul analyze behavior of the system. For illustration, we specify the parameters as follows:
, 6 . 0 5 6 . 0 4 9 . 0 , 2 . 0 18 . 0 1 . 0 , 1 . 0 5 1 . 7 . 0 30 20 10 30 20 10 30 20 10 = =
σ
σ
σ
λ
λ
λ
ξ
ξ
ξ
0 0 0 , 4 . 0 35 . 0 3 . 0 , 1 . 0 1 . 0 2 . 0 , 1 2 3 3 2 1 3 2 1 3 2 1 = = = π
π
π
θ
θ
θ
v v v 0 , 04 . 0 , 24 , 34 . 0 , 32α
s = T0 =δ
h1 =δ
h2 = populations are respectively 1,69 and 20 Group .The capital goods sector and consumer goods sector’s total productivities are 14, 201
As the system consists of any number of types of households, its dynamics is highly e following lemma shows that the economic dynamics is represented by J2
dimensional differential
( )
t)
kJ and
(
Hj( )
t)
≡at any point in time, the other variables are uniquely
by (A3) → w
( )
tj by
by (A11) → Ns
( )
t by by the definitions →Following the lemma, we have a computational program to follow the motion of the the dynamic equations with any number of types of he system is nonlinear and is of high dimension, it is difficult to generally
the parameters as follows:
, 2 . 0 2 . 0 25 . 0 = , 4 . 0 2 . 0 1 . 0 , 06 . 0 (20) Group 2 has the largest s total productivities are
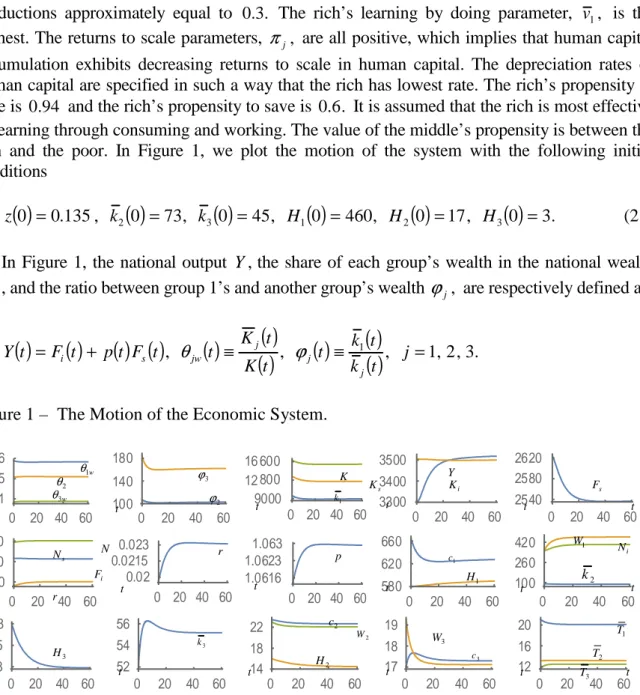
respectively 1 and 0.9. Group 1,2 and 3 utilization efficiency parameters, 's m are j, respectively 0.7, 0.15 and 0.1.Group 1 utilizes human capital mostly effectively; group 2 next and group 3 lest effectively. We call the three groups respectively as the rich, the middle, and the poor. We We specify the values of the parameters, αj, in the Cobb-Douglas productions approximately equal to 0.3. The rich’s learning by doing parameter, v is the 1, highest. The returns to scale parameters, πj, are all positive, which implies that human capital accumulation exhibits decreasing returns to scale in human capital. The depreciation rates of human capital are specified in such a way that the rich has lowest rate. The rich’s propensity to save is 940. and the rich’s propensity to save is 0.6. It is assumed that the rich is most effective in learning through consuming and working. The value of the middle’s propensity is between the rich and the poor. In Figure 1, we plot the motion of the system with the following initial conditions
( )
0 =0.135, k2( )
0 =73, k3( )
0 =45, H1( )
0 =460, H2( )
0 =17, H3( )
0 =3.z (21)
In Figure 1, the national output Y the share of each group’s wealth in the national wealth , jw
θ , and the ratio between group 1’s and another group’s wealth ϕj, are respectively defined as
( )
=( ) ( ) ( )
+ ,( )
≡( )
( )
,( )
≡ 1( )
( )
, j =1,2,3. t k t k t t K t K t t F t p t F t Y j j j jw s iθ
ϕ
Figure 1 – The Motion of the Economic System.
With different initial conditions, the economy experiences different paths of development. Under (21), the national output and wealth experience negative growth over time. The rich’s human capital is increased and the middle’s and poor’s human capital fall over time. A rich household works more hours and a household from the other two groups works less. The rich own more than half of the national wealth with 1 percent of the population and the poor own less 10 per cent of the national wealth with the 20 percent of the national population. The representative household from the rich owns more than 160 times wealth than the household from the poor.
0 20 40 60 0.1 0.35 0.6 0 20 40 60 100 140 180 0 20 40 60 9000 12 800 16 600 0 20 40 60 3300 3400 3500 0 20 40 60 2540 2580 2620 0 20 40 60 800 1250 1700 0 20 40 60 0.02 0.0215 0.023 0 20 40 60 1.0616 1.0623 1.063 0 20 40 60 580 620 660 0 20 40 60 100 260 420 0 20 40 60 2.3 2.65 3 0 20 40 60 52 54 56 0 20 40 60 14 18 22 0 20 40 60 17 18 19 0 20 40 60 12 16 20 t t t t t t t t t i F Y 1 H 2 c i K s K r 1 W 2 W 3 W 1 k 2 k 3 k 1 c 3 c t t t K N s F s N Ni 2 H p r w 3 θ 2 T 3 T 3 H 1 T t t t 2 θ θ1w ϕ3 2 ϕ
International Journal of Economic Behavior, 5, n. 1, pp. 3 We start with different initial states not far aw
system approaches to an equilibrium point. Under ( equilibrium. The equilibrium values are listed in (2
highest wage income. The rich household spends lest hours on working and t spends longest time on working. The
much higher than the household from the two other groups. , 373 . 0 , 559 . 0 2 1w =
θ
w =θ
, 6 . 804 , 4 . 1708 = = Fi F N , 06 . 1 , 023 . 0 = 1 = = p w r , 9 . 591 , 13 . 17 1 3 = H = H W , 66 . 22 , 7 . 629 2 3 1 = c = c cIt is straightforward to calculate the , 18 . 0 , 32 . 0 , 8 3 . 0 − − − −
As all the eigenvalues are negative, we see that the equilibrium point is locally stable.
4. Comparative Dynamic Analysis
We simulated the motion of the dynamic system. change in one group’s propensity to save or t inequality and each class’s wealth and consumption. analysis, we introduce a variable
percentage due to changes in a
The rich applying human capital more effectively
Different people in society have different opportunities to expected that the rich has more opportunities to util
human capital. There are many possible determinants of inequality of income and wealth in modern societies. It is expected that the rich get richer in the near future. For instance, if the society is developed toward such a direction that enables the rich (and successful ones) to apply their human capital more effectively, one may expect changes in inequality between the rich and the poor. We now increase the
. 71 . 0 7 . 0 : 1 ⇒
m As the rich increases their efficiency in applying human capital, the inequality between the rich and the poor is greatly enlarged.
The rich get higher share of the national wealth and the ratios of per household wealth between the poor and rich and between the middle and rich are increased. The improved efficiency by the rich benefits the growth of the national wealth, GDP and total labor supply. The output levels and two input factors of the two sectors are augmented. The rate o
tandem with rising national wealth. The price of consumer goods falls. The rich’s human capital as well as the poor and the middle are all enhanced, with the rich’s human capital being increased much higher than the poor and middle’s. I
rich’s human capital utilization efficiency increases not only the rich’s per household wealth, consumption level of services and wage income, but also the middle’s and the poor’s. In summary, an improvement in
International Journal of Economic Behavior, 5, n. 1, pp. 3-14, 201
We start with different initial states not far away from the equilibrium point and find that the system approaches to an equilibrium point. Under (21) we find that the system has a unique equilibrium. The equilibrium values are listed in (22). The rich has highest human capital and
The rich household spends lest hours on working and t
longest time on working. The rich household’s consumption level and wealth are also much higher than the household from the two other groups.
3503 , 7 . 162 , 4 . 103 , 069 . 0 2 3 3w =
ϕ
=ϕ
= Y =θ
, 3 . 12566 , 3526 , 2 . 2539 = = = i s i s K K N F , 4 . 462 , 48 . 1 , 04 . 2 , 9 . 118 2 = 3 = 1 = = w w W , 23 . 8988 , 28 . 2 , 47 . 14 3 1 2 2 = H = k = k = H 43 . 12 , 15 . 13 , 11 . 20 , 31 . 17 1 2 3 3 = T = T = T =It is straightforward to calculate the six eigenvalues as follows . 03 . 0 , 07 . 0 , 11 . 0 − − −
e eigenvalues are negative, we see that the equilibrium point is locally stable.
Comparative Dynamic Analysis
We simulated the motion of the dynamic system. It is important to ask questions such as how a s propensity to save or to obtain education affects the economic growth, s wealth and consumption. Before carrying out comparative dynamic a variable ∆xj
( )
t to stand for the change rate of the variable,parameter.
applying human capital more effectively
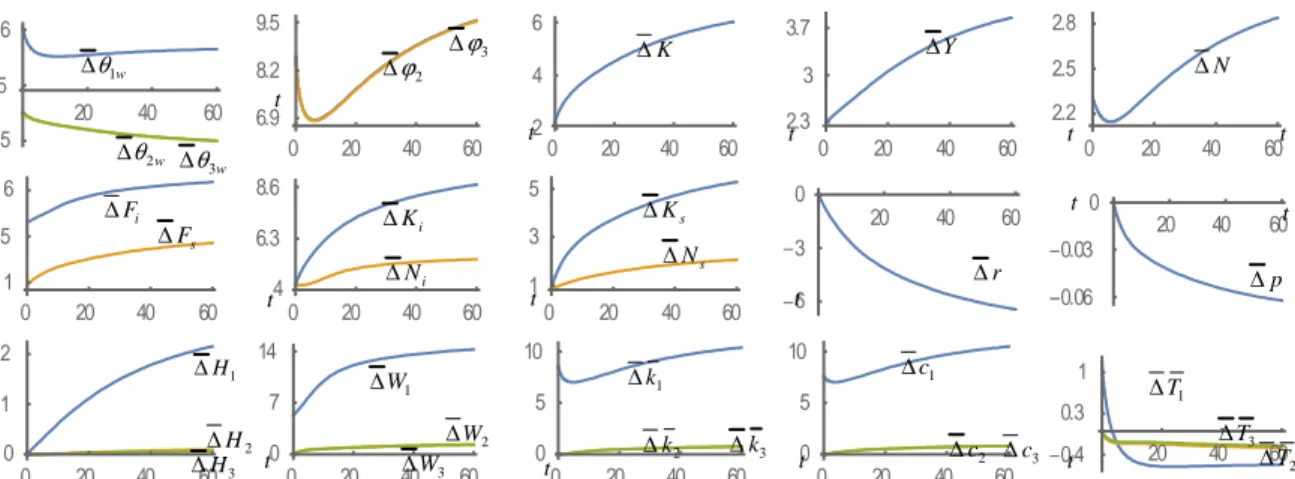
Different people in society have different opportunities to apply their human capital. It is expected that the rich has more opportunities to utilize and tends to be more capable of applying human capital. There are many possible determinants of inequality of income and wealth in modern societies. It is expected that the rich get richer in the near future. For instance, if the oward such a direction that enables the rich (and successful ones) to apply their human capital more effectively, one may expect changes in inequality between the rich and We now increase the rich’s human capital utilization efficiency as follows
As the rich increases their efficiency in applying human capital, the inequality between the rich and the poor is greatly enlarged.
The rich get higher share of the national wealth and the ratios of per household wealth he poor and rich and between the middle and rich are increased. The improved efficiency by the rich benefits the growth of the national wealth, GDP and total labor supply. The output levels and two input factors of the two sectors are augmented. The rate o
tandem with rising national wealth. The price of consumer goods falls. The rich’s human capital as well as the poor and the middle are all enhanced, with the rich’s human capital being increased much higher than the poor and middle’s. It should be noted that an improvement in the rich’s human capital utilization efficiency increases not only the rich’s per household wealth, consumption level of services and wage income, but also the middle’s and the poor’s. In summary, an improvement in the rich’s human capital utilization efficiency enlarges the gaps
14, 201
ay from the equilibrium point and find that the ) we find that the system has a unique has highest human capital and The rich household spends lest hours on working and the poor household s consumption level and wealth are also
, 3 . 16092 , 5 . 3503 K = , 9 . 1306 , 4 . 401 = = Ns , 1 . 22 2 = W , 19 . 55 , 96 . 86 3 = = k . 43 (22)
e eigenvalues are negative, we see that the equilibrium point is locally stable.
It is important to ask questions such as how a the economic growth, Before carrying out comparative dynamic stand for the change rate of the variable, xj
( )
t , intheir human capital. It is ize and tends to be more capable of applying human capital. There are many possible determinants of inequality of income and wealth in modern societies. It is expected that the rich get richer in the near future. For instance, if the oward such a direction that enables the rich (and successful ones) to apply their human capital more effectively, one may expect changes in inequality between the rich and human capital utilization efficiency as follows: As the rich increases their efficiency in applying human capital, the inequality The rich get higher share of the national wealth and the ratios of per household wealth he poor and rich and between the middle and rich are increased. The improved efficiency by the rich benefits the growth of the national wealth, GDP and total labor supply. The output levels and two input factors of the two sectors are augmented. The rate of interest falls in tandem with rising national wealth. The price of consumer goods falls. The rich’s human capital as well as the poor and the middle are all enhanced, with the rich’s human capital being t should be noted that an improvement in the rich’s human capital utilization efficiency increases not only the rich’s per household wealth, consumption level of services and wage income, but also the middle’s and the poor’s. In the rich’s human capital utilization efficiency enlarges the gaps
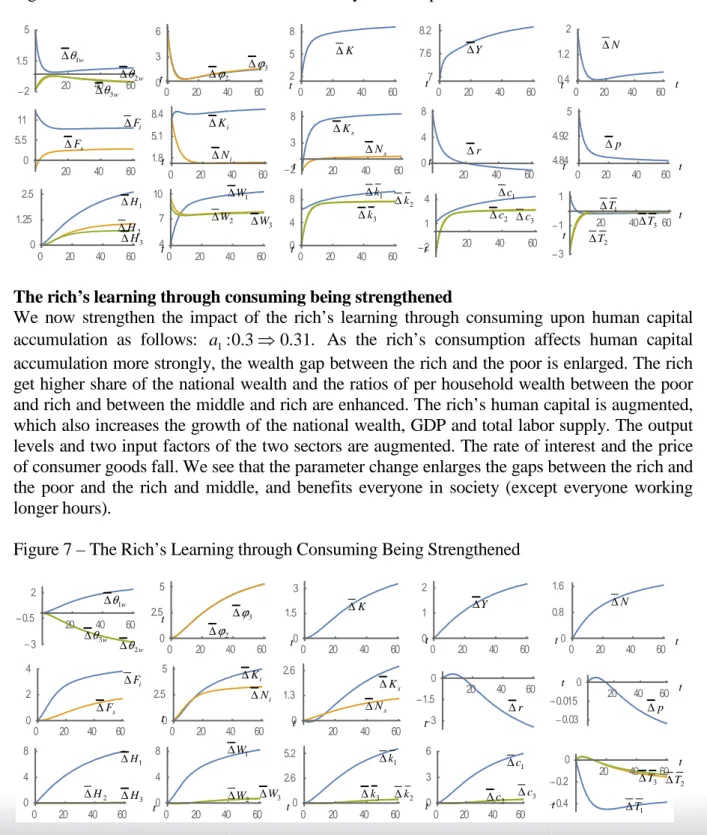
between the rich and the poor and the rich and middle, and benefits everyone in society (except everyone working longer hours). By the way it should be remarked that the impact of human capital is currently a main topic in economic theory and empirical research (e.g., Easterlin, 1981, Hanushek and Kimko, 2000; Barro, 2001; Krueger and Lindahl, 2001; Bandyopadhyay and Tang, 2011; Castelló-Climent and Hidalgo-Cabrillana, 2012). There are different empirical conclusions about inequalities and human capital (e.g., Tilak, 1989; Could et al. 2001; Tselios, 2008; Fleisher et al. 2011). Our study addresses issues related to dynamic interactions among growth, inequality and distribution by assuming heterogeneity in preferences and human capital utilization efficiencies among different types of people. Our conclusion with regard to the rich’s human capital change is that it benefits everyone and worsen equality.
Figure 2 – The Rich Applying Human Capital More Effectively
The rich’s propensity to save being augmented
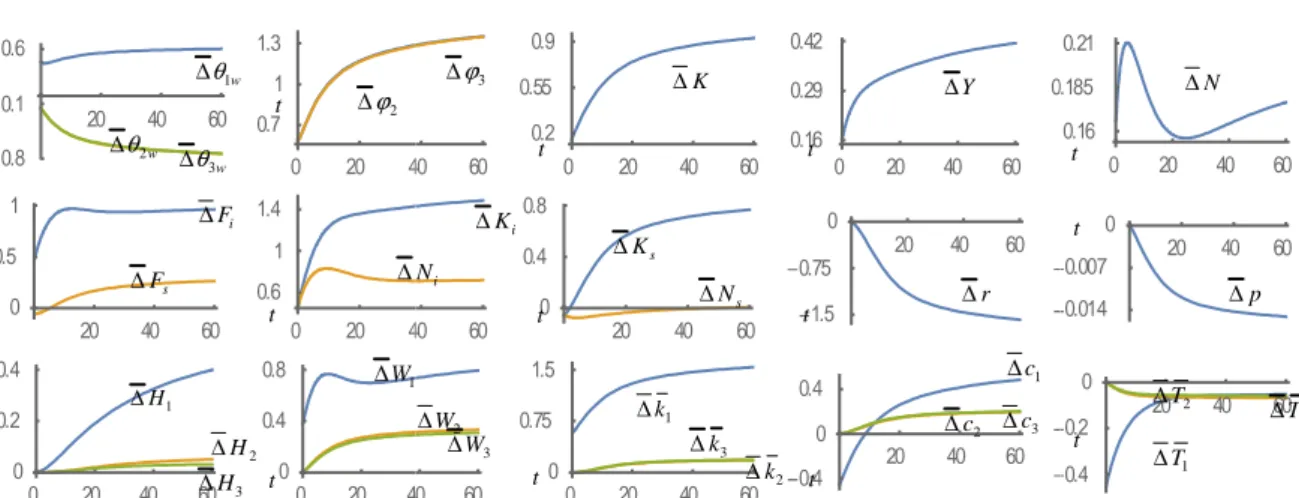
If the rich has become too rich to spend their wealth and become less interested in showing off with wealth, their propensity to save tends to be enhanced. We now increase the rich’s propensity to save in the following way: λ10:0.94⇒0.95. The simulation results are plotted in Figure 3. The effects caused by the rise in the rich’s propensity to save are quite similar to the effects of an improvement in the rich’s human capital utilization efficient. As the rich increases their propensity to save, the inequality between the rich and the poor is enlarged. The rich get higher share of the national wealth and the ratios of per household wealth between the poor and rich and between the middle and rich are increased.
The national wealth, GDP and total labor supply are augmented. The output levels and two input factors of the two sectors are increased. The rate of interest and the price of consumer goods are lowered. The rich’s human capital as well as the poor and the middle are all enhanced. It should be noted that although the rich’s consumption of consumer goods is reduced in the short term, it is enhanced in the long term. This occurs as in the short term the increased propensity to save makes the rich consume less from the disposable income. But their consumption is increased in the long term as more wealth enables the rich to accumulate more human capital and the rich work long hours due to the change in the preference. We see that in the long term any household’s per household wealth, consumption level of services and wage income are augmented. In summary, a rise in the rich’s propensity to save benefits the national economic variables, enlarges the gaps between the rich and the poor and the rich and middle, and benefits everyone in society (except everyone working longer hours).
20 40 60 5 0.5 6 0 20 40 60 6.9 8.2 9.5 0 20 40 60 2 4 6 0 20 40 60 2.3 3 3.7 0 20 40 60 2.2 2.5 2.8 0 20 40 60 1 3.5 6 0 20 40 60 4 6.3 8.6 0 20 40 60 1 3 5 20 40 60 6 3 0 20 40 60 0.06 0.03 0 0 20 40 60 0 2.1 4.2 0 20 40 60 0 7 14 0 20 40 60 0 5 10 0 20 40 60 0 5 10 20 40 60 0.4 0.3 1 t t t t t t 1 H ∆ Y ∆ 3 H ∆ s N ∆ 2 W ∆ 2 H ∆ ∆k3 i F ∆ 1 c ∆ t t t t t t N ∆ K ∆ s F ∆ i N ∆ ∆r w 1 θ ∆ i K ∆ ∆Ks 2 k ∆ 1 k ∆ 1 W ∆ 3 W ∆ 1 T ∆ 2 T ∆ 3 T ∆ 2 c ∆ ∆c3 p ∆ t t t w 2 θ ∆ w 3 θ ∆ 3 ϕ ∆ 2 ϕ ∆
International Journal of Economic Behavior, 5, n. 1, pp. 3 Figure 3 – The Rich’s Propensity to Save Being Augmented
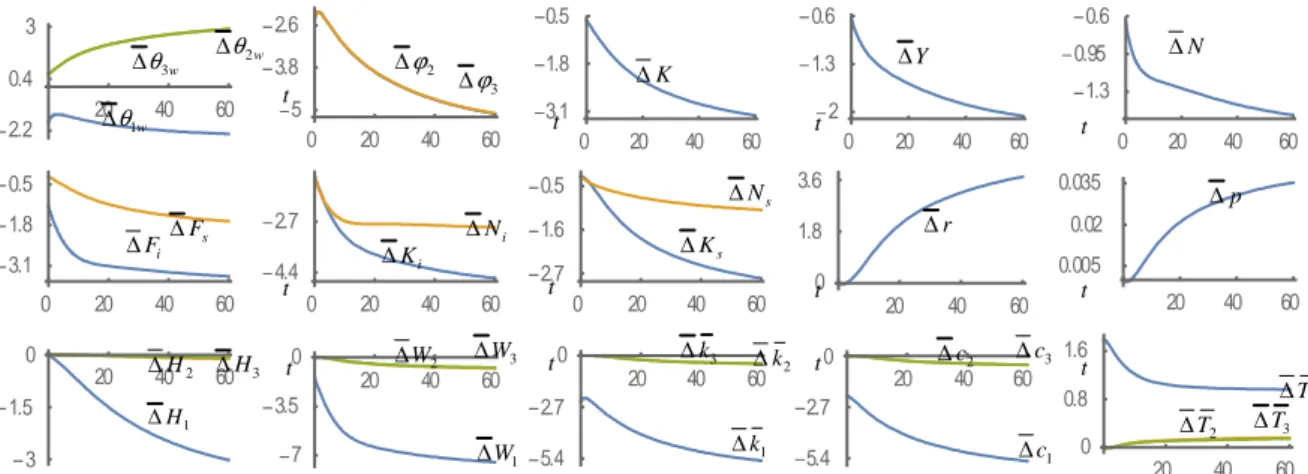
The rich’s propensity to consume We now increase the rich’s propensity simulation results are plotted in Figure
rich’s preference change. In the short term the inequalities are “improved” as the share of the rich in the national wealth falls and the ratios of the per household’s wealth levels are shrunk. In the long term the inequalities are “deteriorated” as the share of the r
and the ratios of the per household’s wealth levels are enhanced. This occurs partly because in our approach working experiences, owning wealth and consuming experiences all can affect human capital accumulation. As the ric
opportunities, learn more about business and build more productive/useful human relations. The rich’s human capital is thus enhanced. As they earn more income, their share of national wealth will be increased more rapidly than the other two groups. The rich work more hours and the middle and the poor work less hours. The rich get more wage income and the other two groups less. The national wealth is reduced and the national GDP and labor supply are augmented. The rate of interest and price of consumer goods rise. The output of the consumer goods sector is enhanced and the output of the capital goods sector is reduced.
Figure 4 – The Rich’s Propensity to Consume Being Increased
20 40 60 0.8 0.1 0.6 0 20 40 0.7 1 1.3 20 40 60 0 0.5 1 0 20 40 0.6 1 1.4 0 20 40 60 0 0.2 0.4 0 20 40 0 0.4 0.8 20 40 60 1 0 1 20 2 0.7 0.6 20 40 60 3 0.3 2.4 20 4.4 1.7 1 20 40 60 0 2.5 5 20 40 0 8 16 t t 1 H ∆ 3 H ∆ ∆ 2 H ∆ i F ∆ t s F ∆ w 1 θ ∆ i K ∆ 1 W ∆ w 2 θ ∆ w 3 θ ∆ ∆ t t 1 H ∆ 3 H ∆ 2 H ∆ i F ∆ t s F ∆ ∆ w 1 θ ∆ 1 W ∆ w 2 θ ∆ w 3 θ ∆ 2 ϕ ∆
International Journal of Economic Behavior, 5, n. 1, pp. 3-14, 201 The Rich’s Propensity to Save Being Augmented
consume being increased
propensity to consume in the following way: ξ10
simulation results are plotted in Figure 4. Per household of all the households is reduced by the rence change. In the short term the inequalities are “improved” as the share of the rich in the national wealth falls and the ratios of the per household’s wealth levels are shrunk. In the long term the inequalities are “deteriorated” as the share of the rich in the national wealth rises and the ratios of the per household’s wealth levels are enhanced. This occurs partly because in our approach working experiences, owning wealth and consuming experiences all can affect human capital accumulation. As the rich consume more, they may grasp more business opportunities, learn more about business and build more productive/useful human relations.
The rich’s human capital is thus enhanced. As they earn more income, their share of national re rapidly than the other two groups. The rich work more hours and the middle and the poor work less hours. The rich get more wage income and the other two national wealth is reduced and the national GDP and labor supply are rate of interest and price of consumer goods rise. The output of the consumer goods sector is enhanced and the output of the capital goods sector is reduced.
The Rich’s Propensity to Consume Being Increased
40 60 0 20 40 60 0.2 0.55 0.9 0 20 40 60 0.16 0.29 0.42 0.185 40 60 20 40 60 0 0.4 0.8 20 40 60 1.5 0.75 0 40 60 0 20 40 60 0 0.75 1.5 20 40 60 0.4 0 0.4 40 60 20 40 60 1.6 0.8 0 0 20 40 60 0 1 2 40 60 20 40 60 1 1.5 4 0 20 40 60 0 4 8 40 60 20 40 60 2.5 1 0.5 20 40 60 0 6 12 t t t Y ∆ s N ∆ 2 W ∆ 3 k ∆ 1 c ∆ t t t K ∆ i N ∆ ∆r s K ∆ 2 k ∆ 1 k ∆ 1 3 W ∆ 2 c ∆ 3 c ∆ 3 ϕ ∆ 2 ϕ ∆ t t t Y ∆ s N ∆ 2 W ∆ 3 k ∆ 1 c ∆ t t t K ∆ i N r ∆ i K ∆ s K ∆ 2 k ∆ 1 k ∆ 1 3 W ∆ ∆c2 ∆c3 3 ϕ ∆ 14, 201 . 08 . 0 07 . 0 : ⇒ The
Per household of all the households is reduced by the rence change. In the short term the inequalities are “improved” as the share of the rich in the national wealth falls and the ratios of the per household’s wealth levels are shrunk. In the ich in the national wealth rises and the ratios of the per household’s wealth levels are enhanced. This occurs partly because in our approach working experiences, owning wealth and consuming experiences all can affect h consume more, they may grasp more business opportunities, learn more about business and build more productive/useful human relations.
The rich’s human capital is thus enhanced. As they earn more income, their share of national re rapidly than the other two groups. The rich work more hours and the middle and the poor work less hours. The rich get more wage income and the other two national wealth is reduced and the national GDP and labor supply are rate of interest and price of consumer goods rise. The output of the consumer goods sector is enhanced and the output of the capital goods sector is reduced.
0 20 40 60 0.16 0.185 0.21 20 40 60 0.014 0.007 0 20 40 60 0.4 0.2 0 0 20 40 60 0 1.5 3 0 20 40 60 0 0.04 0.08 20 40 60 2.5 1 0.5 t t t N ∆ 1 T ∆ 2 T ∆ ∆T3 p ∆ t t t t t t N ∆ 1 T ∆ 2 T ∆ 3 T ∆ p ∆ t t t