Canadian households in transition:
new perspectives on household experiences,
immigration, regions and class in the early
twentieth century
*G O R D O N D A R R O C H York University
1. Introduction. The history of the family has repeatedly revealed how the
com-bined forces we commonly refer to as the emergence of an urban-industrial order wrought changes that reached deep into the interior of households and families. In turn, transitions at the core of families and household economies were themselves powerful historical forces in the making of new social and economic formations. This intricate dialectic has not always been foremost in our historical accounts. That is so partly as a result of the conventional tendency to think historical effects run from structural contexts toward the more intimate ones, and partly as a conse-quence of the normally severe limitations presented by historical sources on inter-preting the interplay between the families and households and wider social forma-tions and spaces (Hareven 2000; Tilly 1987). For all the advantages afforded by multiple local sources, studies confined to a single locale, community or even to a region, can be generalized to larger populations only with considerable risk. In recent years for North America, and increasingly elsewhere, however, the capacity to map and to navigate a national historical terrain has altered dramatically, due to the availability of historical, public-use census samples. Foremost among these has
been the IPUMS(Integrated Public-Use Microdata Series) series of the University of
Minnesota’s Population Studies Center, but other such series are now available1. I
present here a first analysis of a new Canadian census series.
Arguably, the central debate in the recent history of the family has focused on the question of the timing and character of the reduction in complexity of co-resi-dential households, specifically in the reduction of extension to kin of the primary family. For North America, Scott Smith and Ruggles led the way in recasting the question. Scott Smith launched a reinterpretation of the intellectual history of the
debate. Ruggles demonstrated empirically through the IPUMScensus series that, for
the United States, extended family households represented about a fifth of all households through the late nineteenth and early twentieth centuries and the pro-portion did not much decline until after World War II. Additionally, he showed that the predominance of the nuclear family household (couples residing with their own children only) was most likely in the 1880s, the ‘golden age’ of the nuclear family household, as he called it, and declined thereafter. Finally, this decline was
accom-*Support gratefully acknowledged from the Social Sciences and Humanities Research Council of
Canada, Canadian Foundation for Innovation, Ontario Innovation Trust and York University. Chris Clubine-Ito’s interest in the project has been much appreciated.
panied by rising numbers of primary individuals, that is, unrelated persons residing alone or together, the proportions of which rose quickly after World War II (Scott
Smith 1993; Ruggles 1988; 1994)2.
In this paper I address related issues by taking advantage of the recent devel-opments in systematic, public-use census data for Canada for the twentieth centu-ry. I introduce the new national census series briefly and invite international researchers to consider its use for further Canadian and comparative analysis. Then, using two currently available public samples for 1901 and 1911, I examine for the first time shifts in the national, regional, ‘class’ and rural-urban patterns of the household experiences of individuals in Canada.
Despite the short time frame, the first decade of the twentieth century in Canada is a particularly compelling historical moment in which to consider changing house-hold patterns. The two samples bracket ten years marked by the most massive waves of immigration in the country’s history. This huge influx and the settlement processes that ensued issued in fundamental and long-lasting changes in the char-acter of the Canadian state and economy. The waves of immigration resulted direct-ly from an explicit political project to promote population and labour force growth, with the aim of fostering economic development, territorial expansion and political consolidation.
The immigration and related social structural transformations have been the subject of much historical interpretation, and feature prominently in Canada’s main historical narrative (Brown, Cook 1974; Finkel, Conrad 2002). But much less well known are the implications for everyday life of the newcomers and native-born alike, at least on a national scale (Hoerder 1999). I attempt here to provide a first mapping of the effects on household formation and experiences of the intersections between the new immigrant settlement patterns and the emerging rural-urban and class divisions within Canada’s very diverse regional economies. I take it as a work-ing premise that for most times, places and peoples the co-residential household is a key mediating context between individuals’ personal understandings and experi-ences and the larger social formations in which they are embedded (Hareven 2000, chapter 1).
2. Canada’s early twentieth century: the tide turns. Between the 1860s and the
First World War Canada became an unevenly industrializing nation, first in the mid-nineteenth century as a still thoroughly agrarian society, with small pockets of industrialism, then, in the twentieth century as a resource-based, export-oriented industrial order. The character of household economies and family lives shifted slowly in the context of Canada’s relatively modest population growth and delayed urbanization and industrialization. Four years after Confederation (1867) the first systematic national Canadian census of 1871 reported a population of just less than 3.5 million, counting only the populations of the four original provinces, Nova Scotia, New Brunswick, Québec and Ontario. Including all of British North America only added another 300,000 people. The 1901 census-tabulated popula-tion had increased to some 5.4 million, including three new provinces, British
Columbia, Prince Edward Island, Manitoba, and two ‘Territories’ (the total was about 5.6 million for all of British North America). By 1911, the total rose again by about two million to a reported 7.5 million (7,449,262) (Kalback, McVey 1971, 20-21)3.
Barely three decades after Confederation in 1867, Canada still had limited industrialization and urbanization, its population spread thinly over a vast territo-ry. The first decade of the twentieth century witnessed fundamental changes. On January 18,1904, Prime Minister Sir Wilfrid Laurier, attending the first annual ban-quet of the Ottawa Canadian Club, is reported to have proclaimed: «The nine-teenth century was the century of the United States. I think that we can claim that it is Canada that shall fill the twentieth century».
Laurier’s statement apparently passed almost without notice at the time. Before long, however, the exaggerated claim was transformed into one of the most famous phrases in the Canadian political lexicon. «The twentieth century belongs to Canada»4.
Despite its hubris, Laurier’s claim captured a new turn-of- the-century spirit of optimism, not only among Canada’s political elites and literati, but among large seg-ments of the population as well; and for good reason. The long international trade recession from the 1870s had finally ended. Britain, continental Europe and Canada’s major trading partner, the United States, all experienced industrial expan-sion, and generated rising demand for the Canadian exports of wheat, timber and minerals. The Canadian ‘national policy’ inaugurated in 1879, which centred on high import tariffs, the completion of trans-continental railways and the settlement of vast stretches of the Canadian West, was beginning to have its intended effects: expanded east-west trade in agricultural products and manufactured goods, and stronger industrial growth (Francis, Jones, Smith 1988, 46-63).
Critical to this turning was the slowing of Canada’s historically massive loss of population and labour to the United States. Despite a steady inflow from Western Europe, outmigration far exceeded immigration from the colonial era through the decades after Confederation (1867) to the turn of the twentieth century (McInnis 1994, 139-282). But the tide slowed and then turned, first, by the closing of the American frontier to settlement after about 1890, and, second, in response to the bold national immigration policy aimed at fostering both Western Canadian prairie settlement and new supplies of urban industrial labour (Finkel, Conrad 2002,112, Table 6.1)5.
These developments, and the national mood of rising confidence they engen-dered, were coincidentally boosted by the news of a new gold rush, this time on the Klondike River in the far north-western Yukon Territory. Prospecting had contin-ued in the mountains of British Columbia and the north since the earlier California gold rush and Fraser River strikes of 1858. The new Klondike gold rush of 1897 became one of the most publicized in history. It was no mere headline item, since its carefully-policed entry and exit and systematic royalty extraction significantly boosted the Federal government’s coffers throughout the first decade of the new century (Finkel, Conrad 2002, 63-64).
3. Territorial expansion and labour recruitment. The Liberal Laurier government
rode this crest of economic expansion, political optimism, and newly imagined national community. The demand for Canadian wheat abroad encouraged immi-gration, and immigration in turn increased farm production and the value of nation-al exports. But European immigration was nation-also very actively sponsored by the Laurier government under the supervision of Clifford Sifton, Minister of the Interior. As a political project the immigration policies were spectacularly success-ful. In a scant fifteen years, 1896 to 1911, over two million immigrants joined a pop-ulation in 1891 of just 5 million in British North America. The foreign born in Canada shifted from about one in ten people (12%) at the turn of the century to one in every five (22%). Depending on regional location, whole immigrant com-munities emerged, and elsewhere, native-born Canadians became familiar with immigrant neighbours or, at least, immigrant neighbourhoods. Very largely as the policies intended, nearly a million immigrants became farm settlers on the prairies; others underwrote the growing western resource and rural economies and the expanding urban, industrial labour force of Central Canada (Ontario and Québec). The first decade of the twentieth century was the first decade of positive net migra-tion in Canada, since at least 1861 (Kalback, McVey 1971, 41, Table 2.4). By 1905 the West had expanded in both population and economic strength to such an extent that two new provinces, Alberta and Saskatchewan, were carved out of the Northwest Territories. A new political map was drawn.
4. The changing complexity of households in North America: new historical micro-data sources. The historical study of household change remains quite thin in
Canada. Québec is an exception, where local and regional studies thrive due both to a strong tradition of population studies and to rich parish as well as census and documentary sources. Despite a ballooning literature on the history of the family and some key regional studies, however, a national or regionally comparative per-spective on household formation and experience is still very much in its infancy, with early work by Darroch and Ornstein and very recent work by Sylvester, Burke
and Sager among the exceptions6.
The few studies based on microdata with national scope (for 1871 and 1901), however, extend Ruggles’s argument that the predominance of the ‘nuclear’ family household was in the late nineteenth century in North America, and largely paral-lel his findings regarding the high proportion of extended households and rising numbers of primary individuals and lone-head households through the late nine-teenth and early twentieth centuries. At the same time the Canadian research has emphasized two counterpoints. First, in the context of the predominance of the nuclear household, the plurality of non-nuclear forms is also striking, ranging from extended households, through varieties of collections of unrelated individuals under a single roof to multi-family households and those many dwellings augmented by board-ers, lodgers and occasionally by domestic employees. Second, each national study has reported wide regional variations in household composition (Darroch, Ornstein 1984; Kusar, Burch 1985; Burke 2007; Sager 1997; Sylvester 2007).
For the first time, in 2009, we have a new series of national samples that permit comparative population histories for Canada. These cover the still mostly hidden population histories of the last half of the nineteenth century and first half of the twentieth. The series builds on several prior collaborative projects that created largely comparable national samples of dwellings and individuals drawn from the Fig 1. Canada in 1901 and 1911
censuses from 1871 to 1901. To these, the Canadian Century Research Infrastructure has now added a fully integrated series of national samples from each decennial census from 1911 to 1951 (Fig. 2).
The samples can be briefly described. The key features are that these are nation-al samples of dwellings, and within dwellings full transcriptions of the originnation-al
enu-merations were made for every resident7. Though each sample file includes detailed
coding to facilitate research, the transcription means that one can always revert to Fig. 2. The Canadian national series of microdata census samples
The 1871 national sample is a 2% sample of dwellings for the four original provinces. It is a stratified system-atic random sample. Public access at either http://www:chass.utoronto.ca/datalib/major/canpumf.htm#1871 or as an extract from the North Atlantic Population Project at http://www.nappdata.org/napp/
The 1881 complete count can be accessed at http://www.prdh.umontreal.ca/census/en/ uguide/OLD/1881 projects.html or as an extract from the North Atlantic Population Project at http://www.nappdata.org/ napp/
The 1891 national sample is under construction, as indicated, but inquires can be directed to http://www.census1891.ca/
The 1901, Canadian Families Project (CFP), created a national, random systematic sample of 5% of
dwellings and of all residents in each dwelling, with about 265,000 individuals in seven provinces and two Territories. Public access at http://web.uvic.ca/hrd/cfp
1911-1951: The Canadian Century Research Infrastructure Series (CCRI).
In this integrated series, each sample consists of a main sample of ‘regular-sized’ dwellings and over-samples of ‘large dwellings’ – institutions and work camps. The main samples are national random, systematic selec-tions of dwellings with 30 or fewer members (sample densities: 1911 - 5%, 1921 - 4%, 1931, 1941 & 1951 - 3%). The samples are between 360,000 and 420,000 records in any year. Public access to the 1911 sample, User Guide and full project description is at http://ccri.library.ualberta.ca/. Accessed May 2011.
The 1921 through 1951 samples are available through Statistics Canada’s Research Data Centres (protect-ing individual confidentiality), requir(protect-ing researchers to submit an application, see http://www.statcan. gc.ca/rdc-cdr/.
A new sample of the 1851 census is being created at the Universitè de Montréal, also see http://www.prdh.umontreal.ca/census/en/uguide/OLD/1881projects.html
the original enumeration to recover detail or create alternative ways of configuring data. All the samples are ‘cluster’ samples of individuals, since the sample units were dwellings and the records for all residents were recorded. This ‘design effect’ may matter in some analysis, if the characteristics of individuals in question are highly homogeneous among dwelling residents, as for example religious affiliations within single families. I consider clustering effects in reporting statistical results in the analysis that follows. Finally, all the samples are hierarchical by design, so that individuals are nested in the context of their households, and households within dwellings (multiple household dwellings are a small minority of all dwellings) and, of course, dwellings within larger contexts of social, economic and political forma-tions8.
As indicated, I employ the samples for 1901 and 1911. These are the twentieth-century samples accessible through the web. The data files require integration for
comparability, since they were created in different, though related projects9.
Despite the limitations of a single source, historical censuses have features that make them of rare interest and that bear repeating. They are one of the very few his-torical sources that, in principle, include all individuals in a country and, thus, pro-vide full national geographic coverage. Of course, selective underenumeration requires attention, but seldom severely compromises the coverage. An historical series of census samples, such as the one now constructed for Canada, provides unusual opportunities for analysis across time, though they are cross-sectional data and not true time-series (which are rarer still). Historical censuses can also provide a backbone for analysis that interweaves a variety of other sources, as many fine studies in population history have demonstrated, though with unusual exemplary exceptions, these are confined to single communities or small regions where the full interweaving of sources is manageable (Bengtsson et al. 2004).
5. Household experiences in Canada, 1901-1911: immigrants and native born in regional economies. In this initial analysis of the national samples, I consider the
differences between the immigrant and the native-born populations in terms of the household experiences or situations of individuals. This is followed by an analysis of the regional differences in household experiences in each year and then by clos-er examination of rural-urban and ‘class’ pattclos-erns. I employ a succinct typology of households proposed by Ruggles (1994) for the United States, and subsequently modified by Sylvester (2001) for Canadian analysis. The classification is given in Table 1. At the outset we emphasize that the analysis is conducted for individuals in term of their household situations or experiences, and is not an analysis of house-hold types10.
The three main categories of households are here called lone-head households, married couple households and extended households. Each is based on the com-position of the primary family or of the unrelated head in the dwelling, and in turn is based on two key variables, marital status and an individual’s ‘relationship to the head’ of household. The full classification distinguishes eight main types of house-holds. Ruggles’s initial classification aimed largely at distinguishing unrelated
indi-viduals and kin-extended households from those headed by couples. Following Sylvester, we are also interested in augmented households, that is, those including at least one non-kin member. The revised classification adds a subcategory to each of the original three main categories of households. The augmenting members are mainly boarders and lodgers, but in a minority of cases, servants or other domestic employees11.
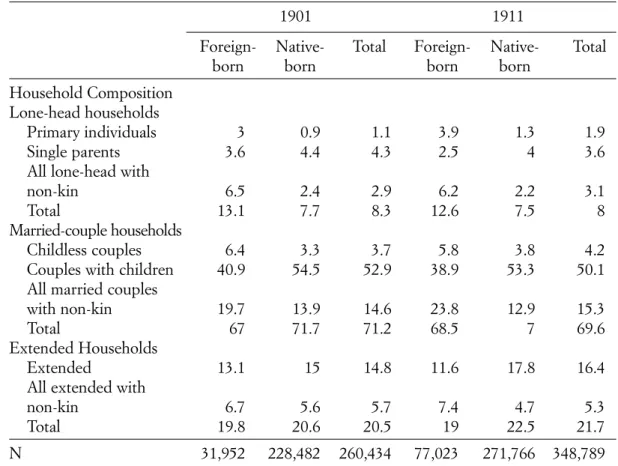
Table 1 presents the distribution of the foreign born and native born by the full classification for each year. We focus on four main features of the distributions.
First, the Canadian patterns closely match those reported by Ruggles for the U.S., although his initial work reported distributions of household types, not of the population by type. We find that about half the Canadian population in each year resided in nuclear households, that is, 52.9% in 1901 and 50.1% in 1911 resided in households of married couples and their own children and no other persons (the middle group of married couple category). About 7 in 10 persons resided in one form or another of couple-headed households, with small proportions of childless couples residing alone and about 15% of couples with some other non-kin mem-Tab. 1. Distribution of the population by household situation and nativity, Canada 1901 and 1911
1901 1911
Foreign- Native- Total Foreign- Native- Total
born born born born
Household Composition Lone-head households
Primary individuals 3 0.9 1.1 3.9 1.3 1.9
Single parents 3.6 4.4 4.3 2.5 4 3.6
All lone-head with
non-kin 6.5 2.4 2.9 6.2 2.2 3.1
Total 13.1 7.7 8.3 12.6 7.5 8
Married-couple households
Childless couples 6.4 3.3 3.7 5.8 3.8 4.2
Couples with children 40.9 54.5 52.9 38.9 53.3 50.1
All married couples
with non-kin 19.7 13.9 14.6 23.8 12.9 15.3
Total 67 71.7 71.2 68.5 7 69.6
Extended Households
Extended 13.1 15 14.8 11.6 17.8 16.4
All extended with
non-kin 6.7 5.6 5.7 7.4 4.7 5.3
Total 19.8 20.6 20.5 19 22.5 21.7
N 31,952 228,482 260,434 77,023 271,766 348,789
Note: The table includes all sample individuals residing in dwellings of size 30 or fewer. This represents 98% of the 1901 sample and 94% of the 1911. Larger dwellings, mainly institutions, group quarters and workcamps, are excluded.
ber. Second, even over one decade, we find a strong hint of decline in the propor-tion residing in nuclear family households, suggesting the longer-term decline that Ruggles (1994, Tab. 1) reported for five, national U.S. samples between 1880 and 1980. We know that by the 1980s and 1990s, the U.S. and Canadian proportions of nuclear family households had both declined to around 35% (for Canadian data, see Burke, 2007, Tab. 1.2).
Third, about one in five individuals resided in one form of extended household or another, almost exactly matching the U.S. patterns around the turn of the twen-tieth century. This proportion appears to increase slightly over the decade. Third, regarding augmentation, large numbers shared their households with non-kin, just less than a quarter of all residents in each year. Three percent resided in lone-head households with other unrelated persons at both census dates; about 15% did so in households headed by couples and 5 or 6% of those who resided with kin also shared dwelling space with non-kin.
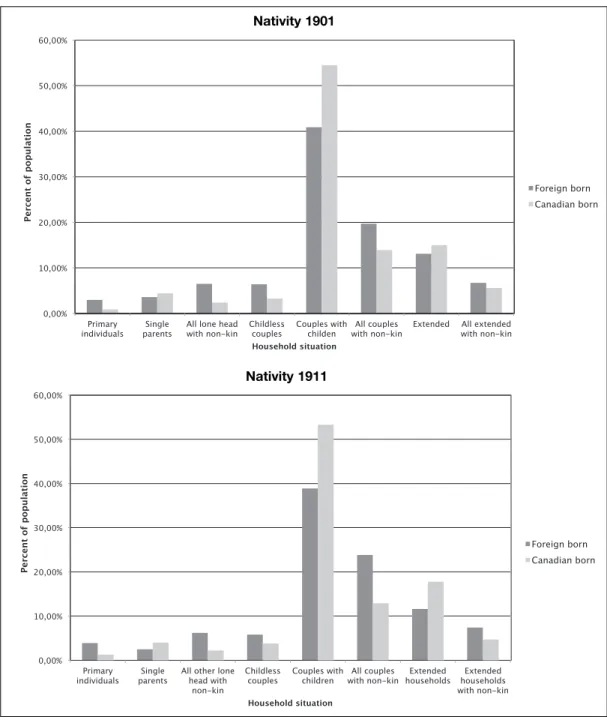
Fourth, national patterns are revealing in their own right, but they mask very substantial differences between the experiences of those born in Canada and immi-grants. These differences, shown in Table 1, are more readily observed in Figure 3. The bars in the figure represent the proportion of the native- and foreign-born pop-ulations classified by the eight categories of households.
The foreign born in Canada were distinctly more likely than the Canadian born to reside in lone-head households, and especially to be primary individuals. They were also more likely to share residential space with boarders and lodgers than the Canadian born, as one can see by comparing each of the three categories of aug-mented households. Thus, they were a good deal less likely to reside in nuclear fam-ily households; just over 40% did so in 1901, compared to 55% of the Canadian born. In 1911, the proportions were 38.9 versus 53.3%.
Immigrants were also about twice as likely to be childless couples, due surely to differences in the age composition of the two populations, a question we address in a moment. Finally, immigrants were surprisingly no less likely to reside in kin-extended households than the native-born, in 1901 (about 20%) and only 3% less likely in 1911 (19 versus 22.5%). But the components of this extension moved in opposite directions for the two groups, a small, but clear increase among the native born in extension only to kin (14.8 to 17.8%) and a slightly reduced proportion sharing space both with relatives and others (5.6 to 4.7%). For immigrants, only the numbers with kin decreased (13.1 to 11.6), while the more fulsome households, both extended and augmented, increased (6.7 to 7.4%). An important implication is that the waves of new immigrants arriving in this tumultuous first decade did not mostly come alone: they came as families and with kin networks sufficiently intact to invent or reinvent complex, mutually-aiding households, even as they spread themselves across an immense continental territory. Table 2 and Figures 4 and 5 examine the regional differences in the household categories, including the two
sparsely populated territories, the Yukon and North-West Territories12.
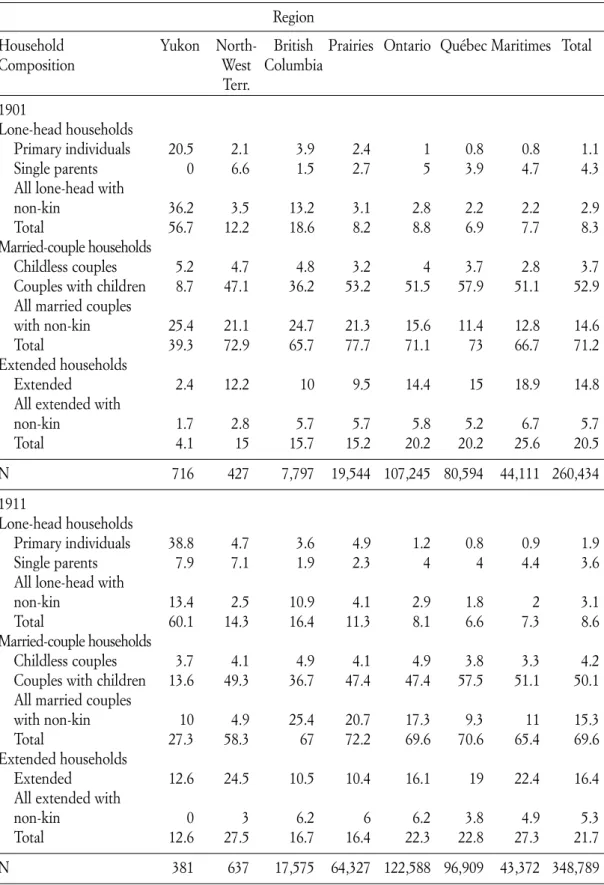
Regionalism has been a central storyline of the narrative of Canadian history, relating the country’s unique linguistic divisions, competing nationalisms,
negotiat-ed political fnegotiat-ederation, and distinctive regional economies (Brody 1990; Friesen 2001). The new evidence of Table 2 reveals the implications of this regionalism for the household experiences of individuals. In the Yukon Territory and on the Pacific Coast in British Columbia (B.C.), the proportions of households headed by unre-lated individuals are remarkable. Well over half of the Yukon residents either resided alone (primary individuals) or, more commonly in 1901, in dwellings shared with other unrelated persons (‘All lone-head households with non-kin’). By 1911 the numbers of primary individuals rose to nearly 2 in 5 (38.8%), with over 13%
0,00% 10,00% 20,00% 30,00% 40,00% 50,00% 60,00% Primary
individuals parentsSingle All lone head with non-kin Childless couples Couples with childen with non-kinAll couples Extended All extended with non-kin
Percent of population Household situation Foreign born Canadian born 0,00% 10,00% 20,00% 30,00% 40,00% 50,00% 60,00% Primary
individuals parentsSingle All other lone head with non-kin
Childless
couples Couples with children with non-kinAll couples householdsExtended households Extended with non-kin
Percent of population
Household situation
Foreign born Canadian born
Fig. 3. Distribution of the population by household situation and nativity, Canada, 1901 and
1911
Nativity 1901
Tab. 2. Distribution of the population by household composition and region, Canada, 1901 and 1911 Region
Household Yukon North- British Prairies Ontario Québec Maritimes Total
Composition West Columbia
Terr. 1901
Lone-head households
Primary individuals 20.5 2.1 3.9 2.4 1 0.8 0.8 1.1
Single parents 0 6.6 1.5 2.7 5 3.9 4.7 4.3
All lone-head with
non-kin 36.2 3.5 13.2 3.1 2.8 2.2 2.2 2.9
Total 56.7 12.2 18.6 8.2 8.8 6.9 7.7 8.3
Married-couple households
Childless couples 5.2 4.7 4.8 3.2 4 3.7 2.8 3.7
Couples with children 8.7 47.1 36.2 53.2 51.5 57.9 51.1 52.9
All married couples
with non-kin 25.4 21.1 24.7 21.3 15.6 11.4 12.8 14.6
Total 39.3 72.9 65.7 77.7 71.1 73 66.7 71.2
Extended households
Extended 2.4 12.2 10 9.5 14.4 15 18.9 14.8
All extended with
non-kin 1.7 2.8 5.7 5.7 5.8 5.2 6.7 5.7 Total 4.1 15 15.7 15.2 20.2 20.2 25.6 20.5 N 716 427 7,797 19,544 107,245 80,594 44,111 260,434 1911 Lone-head households Primary individuals 38.8 4.7 3.6 4.9 1.2 0.8 0.9 1.9 Single parents 7.9 7.1 1.9 2.3 4 4 4.4 3.6
All lone-head with
non-kin 13.4 2.5 10.9 4.1 2.9 1.8 2 3.1
Total 60.1 14.3 16.4 11.3 8.1 6.6 7.3 8.6
Married-couple households
Childless couples 3.7 4.1 4.9 4.1 4.9 3.8 3.3 4.2
Couples with children 13.6 49.3 36.7 47.4 47.4 57.5 51.1 50.1
All married couples
with non-kin 10 4.9 25.4 20.7 17.3 9.3 11 15.3
Total 27.3 58.3 67 72.2 69.6 70.6 65.4 69.6
Extended households
Extended 12.6 24.5 10.5 10.4 16.1 19 22.4 16.4
All extended with
non-kin 0 3 6.2 6 6.2 3.8 4.9 5.3
Total 12.6 27.5 16.7 16.4 22.3 22.8 27.3 21.7
living as lone-heads augmented by non-kin. In B.C. the proportions were lower, but still unusual: in 1901 about 4% were primary individuals and another 13% were lone individuals sharing residences. These proportions declined slightly by 1911. Nuclear family residence was correspondingly less likely, not exceeding 37% in B.C. even by 1911. In clear contrast, we find the highest proportions residing in nuclear family households in Québec in both 1901 and 1911, reaching almost 58%. No other region matches these proportions. The contrast raises intriguing questions about the complex of social and cultural preferences and constraints that fostered
such continued nuclearity in Québec13. Only the Maritimes and Ontario in 1901
and the Maritimes alone in 1911 exceeded 50% who resided in this
often-consid-ered ‘normative’ household circumstance14.
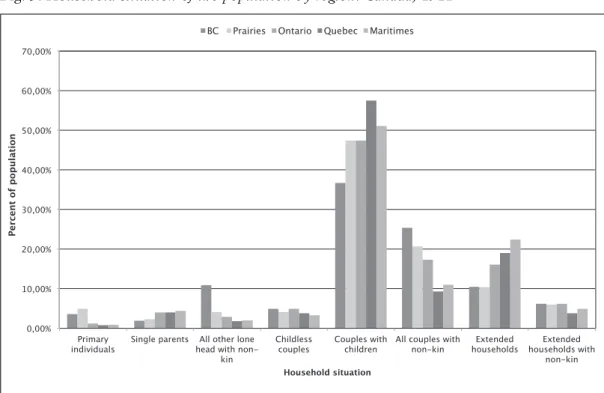
Overall, the table reveals a strong, consistent West to East geographic gradient in the distribution of the Canadian population among household types. The gradi-ent is more appargradi-ent in Figures 4 and 5, in which the bars represgradi-ent the proportions of the regional populations by household situation. In these graphs we concentrate on the five main regions, leaving aside the very small populations of the two Territories.
First, one can see the reduced proportions of primary individuals from the Pacific to the Atlantic Coasts, from about 4% to less than 1% and a more or less consistent West to East reduction in the proportions of residents in households with augmenting boarders and lodgers. The regional gradient is strongest among lone-headed and couple-headed households and weakest among those living in extended households. Second, the Figures underscore the clear tendency for the population of Québec, the second largest regional population, to be distinguished by the likelihood of residence in nuclear-family households. Our classification is not directly comparable to others employed in a number of community studies in Québec. Still, those studies have routinely reported a very strong tendency for the dominance of ‘ménages simples’ within the province, even among newlyweds, for example. These national microdata make clear, however, how relatively unusual the province’s household experiences have been historically in comparison with other Canadian regions (Bouchard 1996, 264-265, Table XII-3; Gossage 1999, chapter 4; Burke 2007; Sylvester 2007).
With the exception of the wide difference in proportions resident in nuclear-family households between British Columbia and Québec, there is no other simple geographic pattern of nuclearity, although by 1911 one sees some evidence of a West to East gradient from smaller to larger proportions in such households. Finally, a decisive East-West pattern can be seen in the propensity to reside in extended households, led by the Maritimes where about 1 in 5 persons resided with kin and 1 in 4 with either kin or with kin and others in each year. The tendency toward extended household residence is not matched elsewhere in Canada, although in Québec over 20% of the population resided with kin. The regional dif-ferences raise a number of research questions about the interweaving of kinship networks, work life, networks of mutual aid and housing stock. For the Maritimes in particular we need to pursue the implications for residential experiences of the
0,00% 10,00% 20,00% 30,00% 40,00% 50,00% 60,00% 70,00% Primary
individuals Single parents All lone head with non-kin Childless couples Couples with childen All couples with non-kin Extended with non-kinAll extended
Percent of population
Household situation
BC Prairies Ontario Quebec Maritimes
Fig. 4. Household situation of the population by region: Canada, 1901
0,00% 10,00% 20,00% 30,00% 40,00% 50,00% 60,00% 70,00% Primary
individuals Single parents All other lone head with non-kin
Childless
couples Couples with children All couples with non-kin householdsExtended households with Extended non-kin
Percent of population
Household situation
Fig. 5. Household situation of the population by region: Canada, 1911
relationships between household economies and the plural ways livelihoods were made in local fishing, forestry and mining economies (McCann 2000).
We can observe two notable differences between 1901 and 1911. First, the large numbers of immigrant settlers arriving on the prairies elevated the chances of residing
as a primary individual in that region to or slightly above the level experienced on the Pacific Coast. Second, the chance of being resident in an extended household in the Maritimes or in Québec also increased over the decade, though this change was sure-ly unrelated to immigration, which hardsure-ly affected these areas, as we shall see.
6. Age, gender and nativity in household formation. The wide differences in
household situations observed between the native and foreign born immediately raise the question of the extent to which they reflect differentials in age composi-tion and sex ratios, which are fundamental demographic condicomposi-tions of household formation. Undoubtedly the massive, new immigrant streams of the 1901-1911 decade shifted sex ratios even more dramatically toward male predominance and toward younger age groups than existed in an already relatively large immigrant community in Canada.
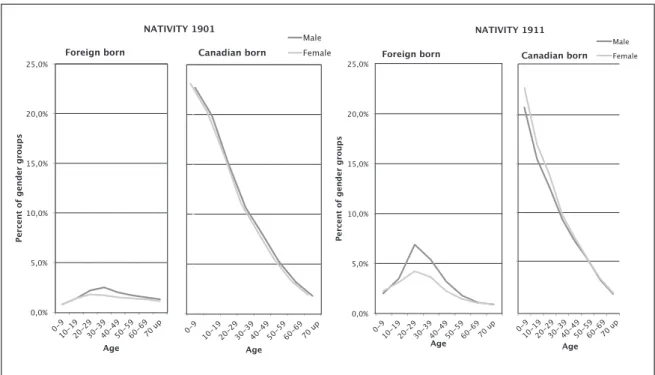
The age-sex differentials between nativity groups are readily demonstrated. In the place of four separate population pyramids, Figure 6 simply compares the pro-portions of each gender group by ten-year age categories for the nativity groups in each sample year.
The foreign- and native-born are represented by separate panels for each year. On the left we see the relatively older immigrant population of the turn of the cen-tury, with the majority between the ages of 20 and 49 and a modestly positive sex ratio of 129. Males exceeded females in almost every age group, but especially between ages 10 and 60 years, with the differential greatest for those aged 30 to 34 (sex ratio of 162). In clear contrast, the right hand panel for the Canadian born dis-plays the predictable pattern of a very young population, with nearly a majority under age 19, and the quite rapid decline of numbers with age and very little sex differential by age. The 1911 distributions reveal the unmistakable effect of the new immigrant populations. The sex ratio for immigrants had shifted dramatically, so that males exceeded females by a ratio of 185 among those aged 25-29, with the his-torically remarkable average sex ratio of 149. In 1911, the Canadian-born pattern is
not much different to that found in 190115.
What effects did the demographic changes have on the household experiences of native and foreign born, especially the latter? The question might be addressed in terms of a conventional age and sex standardization of the rates of household sit-uations using the classification employed here, but since we are interested in con-structing an exploratory multivariate model of the social conditions fostering dif-ferences in household experiences, we undertake a first multinomial logistic analy-sis. The results are given in Table 3, with a simplified dependent variable, distin-guishing only the three main types of residential circumstances, lone-head house-holds, couple-headed households or extended households.
The coefficients given in the table are relative odds ratios, in which the most common situation, residing in a couple-headed household, is the base category and the odds are estimated for the likelihood of residing in either lone-headed or extended households relative to the odds of residence in a couple-headed house-hold. Despite the complication, the odds ratios are quite readily interpreted for our
purposes. So, for example, for 1901 the (Exp B) coefficient of 1.086 is given for gender differences in the odds of residing in lone-head households. This can be interpreted to mean that males were about 8 or 9% more likely than females in 1901 to reside in such households, relative to the chances of residing in couple-headed households. The table identifies the reference categories for variables in the model, females in the case of gender, those age 70 and over in the case of age dif-ferences and the Canadian born in the case of nativity.
The independent influence of gender and age on chances of residing in more sim-ple (lone-head) or more comsim-plex (extended) households have their own interest, which we discuss only in passing, since the main point of the model is to assess whether they are largely responsible for the differences in household experiences between the native and foreign born. The answer to this question is straightforward; the last row of coefficients show that taking account of age-gender variations leaves considerable, sta-tistically significant, independent influence to nativity. The coefficients in 1901 indicate that the immigrant population was something like a third (1.329) more likely to reside in the simpler, lone-head households than the native born (relative to the odds of resid-ing in couple-headed households). And they were about 22 or 23% (1.00-0.775) less
likely to reside in the more complex extended households16.
In 1911, the coefficients are surprisingly similar with the implication that large waves of new immigrants in a decade did not much alter the probabilities of resi-dential circumstances for the foreign born, that is to say, other social and cultural factors beyond timing and large numbers were the more salient conditions of dif-ferences in household formation and experience, which alone is a noteworthy result of national samples of microdata.
Fig. 6. Age and sex differentials by nativity, Canada, 1901 and 1911
0,0% 5,0% 10,0% 15,0% 20,0% 25,0%
Percent of gender groups
Age NATIVITY 1901 Foreign born Age Canadian born Male Female 0,0% 5,0% 10,0% 15,0% 20,0% 25,0%
Percent of gender groups
Age NATIVITY 1911 Foreign born Age Canadian born Male Female
Regarding gender, the model confirms what one expects from many accounts of industrializing and resource based economies, that in both years males were more likely than females to be located in lone-head households, but we find they were substantially more likely to be so situated in 1911. This was surely a consequence of the new immigration of young, single men or married men without accompanying families in this early stage of their settlement. By comparison males were less likely to reside in extended households, independent of age and nativity differentials.
The age effects are given in Table 3 in terms of 10-year categories for ease of interpretation. They are orderly and interesting. Every age group is less likely than the elderly, who serve as the reference category, to be either in lone-head or in extended households. It appears, thus, that the household experiences of the eldest groups in both 1901 and 1911 were split between those who found accommodation with their families in more complex households, and those who were without fam-ily or estranged from them, resided in dwellings by themselves or more commonly with unrelated others. Moreover, in each year, the likelihood of residence in lone-headed or in extended household is lower at each age from 69 to 40, and lower still for adolescents and children under age 19. This is as expected because both those in middle to older years and youngsters and children are more likely to live in cou-Tab. 3. Multinomial regression for the odds of residing in lone-head and extended households,
relative to couple-headed households, from gender, age composition and nativity: Canada, 1901 and 1911
1901 1911
Lone head Extended Lone head Extended
(Exp B) (Exp B) (Exp B) (Exp B)
Variable Gender Female (Ref) Male 1.086*** 0.878*** 1.375*** 0.925*** Age 0-9 0.105*** 0.162*** 0.091*** 0.144*** 10-19 0.328*** 0.187*** 0.270*** 0.160*** 20-29 0.541*** 0.270*** 0.495*** 0.229*** 30-39 0.392*** 0.257*** 0.343*** 0.206*** 40-49 0.348*** 0.224*** 0.328*** 0.195*** 50-59 0.436*** 0.268*** 0.382*** 0.233*** 60-69 0.644*** 0.471*** 0.578*** 0.386*** 70 up (Ref) Nativity
Canadian born (Ref)
Foreign born 1.329*** 0.775*** 1.295*** 0.761***
N 259,446 345,346
ple-headed households (and most in nuclear family households). In contrast, for those aged 20 to 39 the relative chances of residence in either the simpler or more complex households was greater than any other age group, except those over age 60. Next to the most elderly, those aged 20-29 were most likely to live in lone-head-ed households, pointing to the very different social dynamics that populatlone-head-ed such households, one the one hand, housing the apparently isolated elderly adrift from family, and on the other, housing the young men and women who had struck out on their own to seek new livelihoods and adventures.
7. Immigration and regional economies. We next wish to consider the implications
for household formation and experiences of the regional variations in immigrant settlement, in conjunction with two other key conditions, the ‘class’ or employment status of those in the labour force and the rural-urban variations in location and work. The Canadian historical census microdata series provides rare opportunities to consider such conditions. We first introduce the regional variations.
New immigrants to Canada have never flowed evenly into the country’s region-al and rurregion-al-urban economies, and the first decade of twentieth century was cer-tainly no exception. Between 1901 and 1911, the foreign-born population of the West Coast increased from about 45 to 56%; that on the Prairies, from about 30% to over half, and in Ontario from some 15% to nearly 1 in 5. Despite the flood of immigrants in the decade, Québec and the Maritimes were largely unaffected, bare-ly changing in their composition from just 5 to 6 or 7% foreign born. This is not to say that the arrival of new immigrants had no significance for the latter provinces, since the great majority settled in their relatively few urban centres, as they did in Ontario. But these bare figures underscore the magnitude of the social and demo-graphic changes especially in the West and Prairies and in urbanizing Ontario, just as the national immigration project intended.
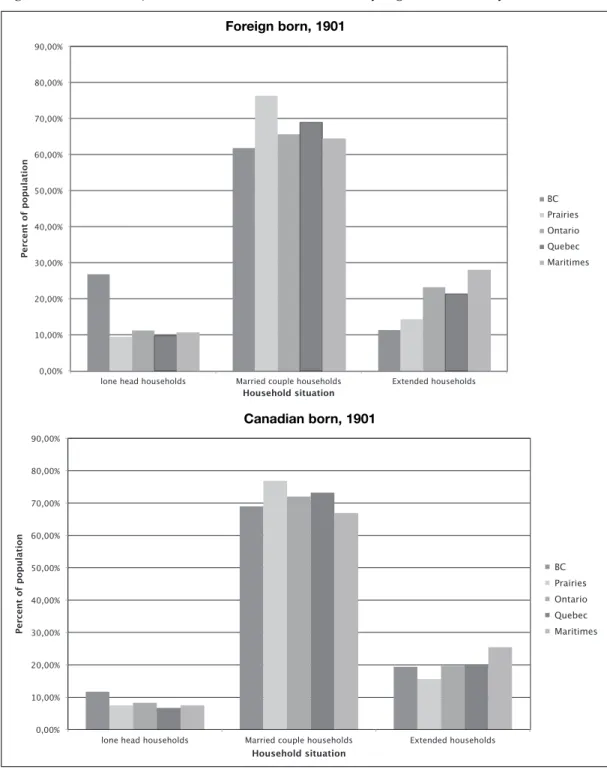
Figures 7 for 1901 and Figure 8 for 1911 show the distributions of household situations of the Canadian population in terms of the three main household cate-gories and by region and nativity.
The bars in the figures represent the proportional distributions of household sit-uations for the five main regions, and the panels in each figure again compare the distributions for the foreign born and native born. Three main features of the array of data are of interest here.
First, as one might expect, we find greater diversity in the household situations among the foreign than among the native born in both years. Second, the waves of new immigrants appear to have reduced this diversity, especially on the prairies and on the West Coast. Third, with the exception of the prairies, every region experi-enced a modest but unexpected increase in the proportions of the Canadian born residing in the more complex, kin-extended households.
Considering the diversity in household experiences among immigrants in 1901, Figure 7 indicates that over a quarter of the immigrant population in British Columbia resided in lone-head households and just over 60% in couple-headed
and 1 in 10 in extended households, on the Prairies these proportions were 9, 76 and 14%, which represented the highest regional proportions of couple-headed households. For the country as a whole, about 12% of immigrants lived in simpler, lone-head households, some 68% in couple-headed and a fifth in extended house-holds. Surprisingly, given a conventional expectation of more limited kin networks among immigrants, in three regions, Québec, Ontario and the Maritimes, over 1 in 5 of the foreign-born lived in households including at least one kin member. Fig. 7. Distributions of three main household situations by region and nativity, Canada, 1901
0,00% 10,00% 20,00% 30,00% 40,00% 50,00% 60,00% 70,00% 80,00% 90,00%
lone head households Married couple households Extended households
Percent of population Household situation BC Prairies Ontario Quebec Maritimes 0,00% 10,00% 20,00% 30,00% 40,00% 50,00% 60,00% 70,00% 80,00% 90,00%
lone head households Married couple households Extended households
Percent of population Household situation BC Prairies Ontario Quebec Maritimes Foreign born, 1901 Canadian born, 1901
As for the Canadian born in 1901, about 12% lived in lone-headed households in B.C. and 19% in extended households. Again the Prairies witnessed the highest proportions of couple-headed households, including over three quarters of the regional population, and, thus, the lowest proportions living in more complex or
more simple circumstances17. Across the country, higher proportions of Canadian
born than of immigrants resided in couple-headed households, about two thirds, and lower proportions in either simpler or more complex forms of residence.
Regarding the second main feature, we also did not expect that waves of immi-gration between 1901 and 1911 would reduce the regional diversity of residential experiences among the foreign born. On the contrary, we expected greater region-al diversity given the uneven location of immigrant settlement. In terms of the propensities to reside in lone-head households, for example, only the prairies increased in its proportion from 9 to 13% of immigrants; in each other region the proportions were reduced and more alike by 1911 (they ranged from 27% in B.C. to just 9% on the prairies in 1901 and ten years later, from 21 in B.C. to a low of 8% in Québec). The regional proportions living in extended households increased slightly to 1911 on the West Coast (from 11 to 16%) and on the prairies (14 to 16%). They declined a little in the Maritimes (28 to 25%) and remained the same in Central Canada (about 23% in Ontario and 21 in Québec). These shifts, of course, also meant greater uniformity in regional proportions of those living in a couple-headed household, as the figures make evident.
Clearly, immigrant families arriving in this short ten-year span often arrived and resided as family units, and frequently shared residences with their relatives. Thousands of newly arrived women and men took up the land on the prairies. Fewer than 1 in 5 prairie residents were foreign-born in 1901, while by 1911 this number was over 2 in 5. Although this huge influx increased somewhat the likeli-hood the newcomers would live in lone-head residences, more often they resided in intact families embedded in a network of kin, with at least one member in the shared dwelling. This household analysis corresponds to our well-known notions about the importance of chain migration, connecting generations, relations and
locales across space and time (Elliott 1988; Ramirez 1991)18.
Finally, we observe a modest, but intriguing, increase in extended households in four of the five regions among the Canadian born in this decade. Extension rose two percent or more in each of Ontario, Québec and the Maritimes, to well over a fifth of the population and fully a quarter on the Atlantic Coast, as shown in Figure 8. A more detailed analysis reveals that the increases were shared in both urban and rural areas of those regions, although slightly greater in the latter. We next consid-er these urban-rural pattconsid-erns more closely in the context of an analysis of relations to the means of production and status of employment.
The regional analysis of household experiences extends one of the few earlier analyses for 1901 by Sylvester. He observed that household complexity (extension) varied more in rural farm areas than in urban areas at the turn of the century, sug-gesting that high rates of farm owner-occupancy and the relative availability of land intersected with life-cycle strategies of rural family labour and inheritance to foster
both nuclear and extended households. Unmarried, adolescent and adult children tended to reside with and work the land with their parents, supplemented by exten-sion to kin, where possible. Our evidence for the decade of high immigrant settle-ment indicates that new rural immigrants joined the native-born in this continued pursuit of relative independence of the household economy and owner-occupancy, especially on the prairies. In urban areas, by contrast, it appears that the likelihood of sharing housing with kin was engendered by quite different conditions, in-migra-Fig. 8. Distributions of three main household situations by region and nativity, Canada, 1911
0,0% 10,0% 20,0% 30,0% 40,0% 50,0% 60,0% 70,0% 80,0%
Lone head households Married couple households Extended households
Percent of popu lat ion Household situation British Columbia Prairies Ontario Quebec Maritimes 0,0% 10,0% 20,0% 30,0% 40,0% 50,0% 60,0% 70,0% 80,0%
Lone head households Married couple households Extended households
Percent of population Household situation British Columbia Prairies Ontario Quebec Maritimes Foreign born, 1911 Canadian born, 1911
tion from the countryside, often among kin-networks, accompanied by the season-al uncertainty in urban wage employment and housing shortages (Sylvester 2007).
8. Household experiences: rural-urban and ‘class’ patterns, 1901-1911. In the
first decade of the twentieth century, Canada was still largely rural and agrarian, though verging on a new urban industrial order based on policies of high protec-tive tariffs, the new transcontinental railways and unprecedented sponsorship of immigration (Finkel, Conrad 2002, chapter 5). In the following analysis, we intro-duce two additional, fundamental considerations to the analysis of household for-mations and experiences, the urban-rural divide and what we cautiously call, ‘class’ variations. An explanation of the term follows.
To illustrate the emerging urban order we follow census practice defining urban places as those that were legally incorporated with a population of just 1000 or more persons. In the sample data for 1901 this included only 35 (34.8)% of the national population, but increased by 1911 to 45% (44.9). Regional variation was high in both years, with just a fifth or so of the population in urban places on the prairies in 1901 and about a third in 1911, to a high of 48% in B.C. in 1901 and
53% in Ontario in 191119.
In 1891 the Canadian census introduced an unusually informative set of ques-tions about employment, in addition to the question about occupation or profes-sion that had been asked throughout the colonial and early federal censuses. Among the new questions was one about ‘employment status,’ defined as either being an employer or wage earner. By 1901 six different ways of assessing one’s employment circumstances were elaborated, including occupational title and ‘retired’ («a person has retired from his gainful calling or occupation»). The other four categories distinguished what may reasonably be called an individual’s rela-tionship to the means of production, or ‘class’ circumstance. The categories were, employer («persons who are employers, as mill-owners, large farmers etc. whose work is done by others for which salaries or wages are paid»), employee («employ-ees who work for salaries or wages»), working on one’s own account («persons employed in gainful work, doing their own work»), and living on one’s own means («person who do not carry on any remunerative calling and live on their own means, as from incomes, superannuations, annuities, pensions, etc.»). These tinctions reflected their time and, specifically, the residue of nineteenth-century dis-courses about labouring and employment, which were characteristically more attuned to the earlier, categorical distinctions of class, than to those of ranking and prestige. The latter emerged more strongly as the twentieth century wore on with the growing dominance of conceptions of a less-divided, middle-class society, defined by ladder-like social mobility and multiple layers of social stratification. For reasons of this linguistic heritage and for convenience in the following analysis, we will refer to the census distinctions either as ‘status of employment’ or ‘class’.
Eric Sager and Peter Baskerville have provided careful assessments of the ori-gins and implications of the new census language of employment status (Sager, Baskerville 1995; Baskerville, Sager 1998; Baskerville 2000). The increased
atten-tion to the dimensions of employment followed new British and American census practice, with the employment status questions specifically reflecting those of the
British census20. Sager and Baskerville argue, however, that it would be a mistake to
see the Canadian census questions as simple replications of the British ones, since they were influenced by a good deal of Canadian concern with the apparent rising tide of families dependent solely on wages in the late nineteenth-century in a coun-try historically dominated by independent small producers, both family farmers and small craft operators21.
Table 4 gives the distributions of these the four main class or status of employ-ment categories for each year. We note that multiple answers were allowed to the census questions, so that one could be any combination of the main categories, for example, an employer and working on one’s own account. However, these includ-ed only about 3% of the labour force in either year and we collapse them, catego-rizing the respondents by the first category listed. It is important also to note that only about 80% of those recorded with occupations in 1901 provided status of employment information. As Baskerville has shown the largest proportion of these unrecorded workers in 1901 were outside the main interest of the state census tak-ers, being either rural workers in primary industries or not wage earners (Baskerville 2000, 231). By 1911, however, fully 96% reported their class circum-stances. The differences require caution in comparing household situations by employment and urban-rural settings in the two years, but the extent of the cover-age still warrants initial exploration.
Table 4 reveals an interesting pattern, given the concerns of the state with regard to rising wage dependence. Employees as a category did not, in fact, increase over these ten years of intensified industrial enterprise and urban residence. On the con-trary, about 60% of the recorded labour force remained wage earners, while those working independently – on their own account – increased from just over a quar-ter of the labour force to nearly a third. Urban employees did increase slightly to 80% of the urban population, while in rural areas those ‘on the own account’, that is independent farm proprietors and producers, rose to over half of the recorded labour force. Employers declined from about 8% to 6% and those on their own means, from 6 to just 2%. The major transition can be directly attributed to the set-Tab. 4. Class and rural-urban distributions of the Canadian labour force, 1901 and 1911
1901 1911
Rural Urban Total Rural Urban Total
Working on own account 38.2 11.5 26 52.5 11.3 32.6
Employee 45.9 77.2 60.2 38.8 80.7 59.1
Employer 9.9 5.1 7.7 6.7 5.4 6.1
On own means 5.9 6.2 6 2 2.6 2.3
N 76,976 132,786
tlement of immigrants on prairie lands. Consider the province of Manitoba. In 1901 it had some 255,000 residents; in 1906, over 365,000, and by 1911 its population stood at 450,000. Across the Prairies as a whole it is said that some 30,000 new farms were created each year between 1896 and 1922, while wheat production tripled every five years during that period22.
Figures 9 and 10 provide the first comparative historical view for the twentieth century of the household circumstances of the labour force by rural-urban location Fig. 9. Distributions of main household situations by class and rural-urban, Canada, 1901
0,0% 20,0% 40,0% 60,0%
lone head households Married couple households Extended households
Percent of population Household situation Own Account Employee Employer Own Means 0,0% 20,0% 40,0% 60,0%
lone head households Married couple households Extended households
Percent of population Household situation Own Account Employee Employer Own Means Rural, 1901 Urban, 1901
and employment status. The bars in these figures represent the proportions of the labour force in the three main household categories by class/status of employment for rural and urban areas separately.
Three main features warrant comment in this context. First, paralleling the national patterns, about a fifth of the three main employment groups, employees, independent proprietors/producers, and employers resided in extended house-holds in both years, and between 12 and 15% in lone-head househouse-holds. We also observe somewhat greater diversity in urban than in rural areas in the household sit-Fig. 10. Distributions of main household situations by class and rural-urban, Canada, 1911
0,00% 20,00% 40,00% 60,00% 80,00%
Lone head households Married couple households Extended households
Percent of population Household situation Own Account Employee Employer/OwnAcct Own Means 0,0% 20,0% 40,0% 60,0% 80,0%
Lone head households Married couple households Extended households
Percent of population Household situation Own Account Employee Employer/OwnAcct Own Means Rural, 1911 Urban, 1911
uations among the four classes, most apparent in the differences in urban propor-tions residing in married couple households. The modest urban diversity reflects the more varied character of urban economies in these years, the relative insecurity of urban employment, high rural to urban labour migration, and accompanying tra-ditions of boarding and lodging. But it is striking that urban residents were still more likely live in extended and augmented households than among unrelated per-sons in lone-head circumstances. Second, there was a discernible if weak tendency toward increased extension in urban areas and small increases in rural areas in both extension and lone-head residence. Third, those reporting independent sources of income, living on their ‘own means,’ were especially likely to be in both extended and lone-headed households: 34% lived in extended households in 1901 in both rural and urban areas, and 22 and 30%, in lone-head situations. By 1911, these pro-portions had increased considerably, as Figure 10 clearly shows. Half of the small group reporting independent incomes in rural areas lived in extended households and 37% in urban areas.
9. Demographic and social conditions of household experiences, 1901 and 1911. Finally, we can consider drawing these several investigations together in a
multivariate analysis. In Table 5, I present two models of the relative odds of resid-ing in either lone-head or extended households. The presentation of the data fol-lows the models introduced in Table 3. For each year, a first model considers the effects of four independent variables, nativity, region, rural-urban and ‘class’/status of employment differences. The second model reintroduces the two key demo-graphic variables, gender and age, as in the earlier model. The comparison of the models for each year is aimed at making clear the relative salience of the several
fac-tors and the changes introduced in considering additional variables23.
First, we note again that these models only relate to those recorded as being in the labour force and responding to the class/status of employment enumeration. We will note the implications in our interpretation. The first model for 1901 pre-dicting the relative odds of residing in a lone-head household changes our assess-ment of the importance of nativity in household locations. Contrary to our earlier three-variable model, the differences between foreign and native born are rendered statistically irrelevant when we exclude age and gender effects, but include region, rural-urban differences and the class variable. Including the latter means, of course, we restrict the model to considering the household experiences of only those recorded as having a status of employment, effectively to those in the labour force. For these, the regional differences are strong, but very specific. With the Maritimes as the reference region, we find that for those living in Ontario and the prairies, the likelihood of being in a lone-head household was not significantly different, but the odds for Québec were discernibly lower (about 12%; 1.00-0.881 in Table 5) and those in British Columbia over 3 times higher (3.343).
The model also indicates that once class and region are considered, the rural-urban differences are actually quite slight, and only just statistically significant even
in such a large sample. Urban residents were a bit more likely to be residing with other unrelated persons. We also see salient class/status of employment differences. With the independent producers (working on their own account) as the reference Tab. 5. Multinomial regression for the odds of residing in lone-head and extended households,
relative to couple-headed households, Canada, 1901 and 1911
1901 1911
Lone head Extended Lone head Extended
Model 1 Model 2 Model 1 Model 2 Model 1 Model 2 Model 1 Model 2
(Exp B) (Exp B) (Exp B) (Exp B) (Exp B) (Exp B) (Exp B) (Exp B)
Variable Gender Female (Ref.) Male 0.272*** 0.528*** 0.440*** 0.668*** Age 0-9 0.112*** 0.290*** 0.081** 0.368*** 10-19 0.457*** 0.548*** 0.451*** 0.483*** 20-29 0.704*** 0.768*** 0.808*** 0.682*** 30-39 0.579*** 0.707*** 0.614*** 0.623*** 40-49 0.504*** 0.575*** 0.514*** 0.545*** 50-59 0.654*** 0.577*** 0.568*** 0.535*** 60-69 0.811** 0.752*** 0.735*** 0.671*** 70 up (Ref.) Nativity Canadian born (Ref.) Foreign born 1.016 1.032 0.823*** 0.828*** 1.053** 1.081*** 0.857*** 0.858*** Region Maritimes (Ref.) Quebec 0.840*** 0.822*** 0.750*** 0.742*** 0.858*** 0.887*** 0.798*** 0.817*** Ontario 0.984 0.964 0.782*** 0.776*** 1.000 1.003 0.810*** 0.817*** Prairies 1.077 1.138* 0.642*** 0.642*** 1.942*** 2.003*** 0.689*** 0.701*** British Columbia 3.066*** 3.758*** 0.520*** 0.555*** 2.606*** 2.780*** 0.702*** 0.723*** Urban/Rural Rural (Ref.) Urban 1.056* 1.055* 0.947*** 1.098*** 0.851*** 0.799*** 0.968* 0.937*** Class Own account (Ref.) Employee 1.071** 0.983 0.915*** 0.866*** 0.997 0.936** 0.950** 0.932*** Employer/ Own account 0.881** 0.952 0.967*** 1.000 0.772*** 0.814*** 1.063* 1.088** Own means 3.343*** 1.948*** 2.549*** 1.912*** 5.000*** 3.195*** 3.935*** 2.865*** N 76,289 76,110 76,289 76,110 132,746 131,389 132,746 131,389
Note: *p < .05; **p < .01; ***<. 001. The statistical tests of significance consider cluster effects of dwel-ling samples.
group, employees were slightly more likely to be in lone-head households; employ-ers were less likely to be so; and those on their own means were by far the most like-ly to be in living with other unrelated persons.
Model 2 of the table includes the gender and age effects. For lone-head house-holds their inclusion attenuates the coefficients of the other variables, altering the effects only in minor ways. But the model reveals an important historical gender dif-ference. In the larger model males are less, not more, likely than females to reside in lone-head households (relative to the odds of living in a couple-headed house-hold). The coefficient is 0.272, indicating that men in the labour force were some 70% less likely to live in such households. The reversal of gender effects from our earlier model is due simply, but tellingly, to the fact that the former included the entire recorded population of all ages, but these model includes only women and men in the reported labour force. Working women were very likely in turn of the century Canada to be living among unrelated others, taking into account the effects on household situations of the other variables in the model.
The relationship between age and the odds of lone-head residence largely dupli-cates the previously discussed pattern, although the effects are moderated by the inclusion of the added variables24. The regional effects are also similar, though strengthened once the demographic variables are included, while the class differ-ences are considerably reduced. In the larger model, only those living on their own means significantly differed from the other employment statuses. That is, once age, gender and regional differences are accounted for in 1901, with this one exception, one’s way of making a living, whether by wage earning, as an employer or as an independent proprietor/producer, did not affect the odds of living among unrelat-ed persons in a lone-head household.
Regarding the relative odds of living in an extended household in 1901, the sim-pler model shows that in this specification of the relationships nativity affected the chances of extended household residence: the foreign born were significantly less likely to live with kin. As well, each other variable has an independent and salient influence on the odds of extended household experience. As in the tabular data, liv-ing with relatives was most common in the Maritimes, followed by Ontario, then Québec, the Prairies and least on the West Coast.
Also with respect to extension in 1901, gender differences among those with recorded employment statuses conformed more closely to the experiences of the larger population: women were more likely to reside in extended households than working men. The age patterns parallel the ones reported above, with the elderly the most likely to be in extended households and those aged 20-39 year olds more likely than either those younger or aged 40 to 69 years. In this case, we find that nativity is a salient condition of the odds of extended residence in both models, with the foreign born less likely to have shared living space with one or more rela-tives. We find regional differences in extension largely unaffected by the inclusion of the age-gender variations and the differences all substantively salient and statis-tically significant. Sharing residence with kin was again most common in the Maritimes, followed by Ontario, Québec, the Prairies and B.C. The differences are
striking: about 45% more likely in the Maritimes than in B.C. and 34 or 35% less likely on the Prairies.
Once again, given the influences of the other variables, rural-urban differences appear to have been minor, though discernible. And knowing the age-gender dif-ferences alters the models from one in which urban residents were less likely to reside in extended households to one in which they are slightly more likely. Finally, we observe some modification in class/status of employment differentials, once the demographic variables are included. In both cases, the minority of those reporting to be living on their own means were two or two and a half times more likely to have lived with kin (as well as to have lived as lone-head residents). However, given age-gender effects, employers cannot be distinguished from those working on the own account in terms of propensities to live in extended households, but employees are clearly less prone to do so.
For 1911 the contrasts and patterns are largely similar to 1901 with notable exceptions. Again women who reported an employment status, like those in the general population, were more likely than working men to reside in lone-headed as well as in extended households, though the odds were significantly greater in the case of lone-head residence. Age effects were also similar, with the elderly who still reported employment more likely than any other age group to have resided both in extended and in lone-head households.
In contrast to 1901, after the decade of heavy immigration, one’s nativity had become a significant condition of both the chances of lone-head and of extended household residence, and this was so whether considering age and gender differen-tials or not. Given this clear, short-term change one might assume that the process-es of settlement and accommodation over time would again reduce the difference between the native and foreign born in household patterns after 1911, but that question can only be addressed by enlisting the more complete historical census series through 1951.
Interestingly, independent of the direct influence of nativity on household cir-cumstances, we also find that between 1901 and 1911 regional differences were considerably strengthened. In both models 1 and 2 for 1911, prairie residents were about twice as likely to reside in lone-headed households as Maritime residents, although those in B.C. were still two and a half or more times as likely, and those in Québec still least likely to live with unrelated others. This regional difference may have arisen in response to the massive re-populating of the prairies and the ensuing housing shortages. The effects may also be seen in the increased importance of rural-urban differences in the odds of residing in lone-head households, whether we consider age-gender effects or not. In 1911, the urban working or income-earn-ing population considered in these models was 15 or 20% less likely to live with unrelated others in lone-head households, which is a reversal from both our find-ings for 1901 and from our expectations. Finally, the class differences are again clear and largely turned on the small minority of those living on ‘unearned’ sources of income, which was over three times more likely to reside in lone-head house-holds than those working on their own account. Given age and gender differentials,