DOTTORATO DI RICERCA IN
Ingegneria Energetica, Nucleare e del Controllo
Ambientale
Ciclo XXV
Settore Concorsuale di afferenza: 09/C2Settore Scientifico disciplinare: ING-IND/10
TITOLO TESI
Experimental and Numerical Analysis of Gas Forced
Convection through Microtubes and Micro Heat
Exchangers
Presentata da: Yahui Yang
Coordinatore Dottorato
Relatore
Prof. -Ing. Antonio Barletta
Prof. -Ing. Gian Luca Morini
Correlatore
Dr. -Ing. habil. Jürgen J. Brandner
Esame finale anno 2013And a heaven in a wild flower,
Hold infinity in the palm of your hand And eternity in an hour.
The last decade has witnessed very fast development in microfabrication technologies, which tend to bring about smart and flexible miniaturized systems. Among them are the microfluidic systems in which fluid flow and heat transfer are activated on regions with characteristic dimensions of the order of tens of micrometers. The increasing industrial applications of microfluidic systems call for more intensive and systematic knowledge on this newly emerging field. Especially for gaseous flow and heat transfer at microscale, the applicability of conventional theories developed at macro scale is not yet completely validated; this is mainly due to scarce experimental data available in literature for gas flows. Moreover, some deviations from conventional theory has been reported in the past but not fully explained or justified. The objective of this thesis is to investigate these unclear elements by analyzing forced convection for gaseous flows through microtubes and micro heat exchangers.
Experimental tests have been performed with microtubes having various inner diameters, namely 750 m, 510 m and 170 m, over a wide range of Reynolds number covering the laminar region, the transitional zone and also the onset region of the turbulent regime. The results show that conventional theory is able to predict the flow friction factor when flow compressibility does not appear and the effect of fluid temperature-dependent properties is insignificant. It has been experimentally evidenced that the axial conduction in the solid wall is important at microscale and greatly alters the linear distribution of bulk temperature. The experimental data have been compared with results obtained from numerical simulation.
Numerical simulation has been extensively applied to the design and optimization of a gas micro heat exchanger based on parallel rectangular microchannels. A double-layered microchannel heat exchanger has been designed in order to study experimentally the efficiency of a gas-to-gas micro heat exchanger. This microdevice contains 133 parallel microchannels machined into polished PEEK plates for both the hot side and the cold side. The microchannels are 200 µm high, 200 µm wide and 39.8 mm long. The design of the micro device has been made in order to be able to test different materials as partition foil with flexible thickness. The test rig has been developed by integrating customized pressure and temperature sensors for local measurements within the device. In addition, the packaging of the microchannel layers has been designed in order to reproduce easily various flow arrangements (countercurrent, concurrent and cross flow configurations).
performance of the countercurrent and cross flow micro heat exchanger can be strongly influenced by axial conduction in the partition foil separating the hot gas flow and cold gas flow. However, this is not the case for a cocurrent flow micro device, where the partition wall is almost isothermal. It can be concluded from the experimental data that conventional theory is able to predict the performance of the micro heat exchanger as long as the influence of axial conduction is correctly taken into account. The experimental conclusions are further validated by 3D numerical simulation, in which the optimal value of partition foil thermal conductivity has been determined considering different foil thicknesses, flow arrangements and mass flow rates.
I would like to express deep gratitude to my supervisor Prof. Gian Luca Morini and co-supervisor Dr. Jürgen J. Brandner for guiding me into the fascinating world of microfluidics. Their support, encouragement and inspiration accompanied me throughout my Ph.D. study.
I also want to thank all the colleagues and friends during my work and stay in both Bologna and Karlsruhe. They have made my life full of colours.
My appreciation also goes to Ms. Iris Gerken for her assistance in the construction of the test rig, which helped to keep work progress on schedule. In addition, I would like to thank the microfabrication group at IMVT, Karlsruhe Institute of Technology, for manufacturing and assembling the micro heat exchangers.
The present research has received funding from the European Community's Seventh Framework Programme (ITN-FP7/2007-2013) under grant agreement n° 215504. The financial support is acknowledged.
Last but not least, I am deeply grateful to my family for their eternal support, especially my wife. This work may have never been finished without her endless love beyond long distance.
ACKNOWLEDGEMENTS ... iii
TABLE OF CONTENTS ... iv
LIST OF FIGURES ... viii
LIST OF TABLES ... xvi
NOMENCLATURE ... xviii
1 Introduction ... 1
1.1 Background ... 1
1.2 Introduction to flow and heat transfer at microscale ... 2
1.2.1 Gas flow and heat transfer through microchannels... 2
1.2.2 Gas flow and heat transfer through micro heat exchangers (microHEXs) ... 5
1.3 Effects of gas flow and heat transfer at microscale ... 8
1.3.1 Rarefaction effects ... 9
1.3.2 Thermal transpiration ... 10
1.3.3 Roughness effects ... 11
1.3.4 Compressibility effects ... 12
1.3.5 Longitudinal heat conduction ... 13
1.3.6 Effects of fluid temperature-dependent properties ... 14
1.3.7 Viscous dissipation ... 15
1.3.8 Thermal boundary conditions ... 16
1.3.9 Experimental accuracy ... 16
2 Measurement Techniques at Microscale ... 18
2.1 Measurement of microchannel geometry and surface roughness ... 18
2.2 Pressure measurement at microscale ... 20
2.3 Temperature measurement at microscale ... 24
2.4 Flow rate measurement at microscale ... 28
3 Experimental Uncertainties at Microscale ... 35
3.1 Analysis of experimental uncertainties ... 35
3.2 Experimental uncertainties on friction factor of micro gas flows ... 36
4 Experimental Study on Gas Flow through Microtubes... 53
4.1 Experimental apparatus ... 53
4.2 Adiabatic gas flow through microtubes ... 57
4.2.1 Theory on conventional adiabatic flow ... 58
4.2.2 Data reduction for compressible flows ... 58
4.2.3 Friction factor of adiabatic gas microflow ... 59
4.3 Heated gas flow through microtubes ... 62
4.3.1 Friction factor of gas microflow under heated conditions ... 63
4.3.2 Correction of flow friction factor under heated conditions ... 66
4.3.3 Laminar-to-turbulent transition ... 70
4.4 Mach number and flow compressibility ... 72
4.5 Conclusions ... 78
5 Gas Forced Convection through Microtubes ... 81
5.1 Theory and data reduction ... 81
5.1.1 Thermal entrance region ... 81
5.1.2 Thermal boundary conditions ... 83
5.1.3 The Nusselt number ... 86
5.1.4 Reduction of experimental data ... 88
5.1.5 Temperature different between fluid and wall: from macroscale to microscale ... 89
5.1.6 Measurement of fluid outlet temperature ... 92
5.2 Gas micro convection in laminar and transitional regimes ... 94
5.2.1 Axial distribution of gas bulk temperature ... 94
5.2.2 Effect of nonlinear temperature distribution on Nusselt number ... 101
5.3 Compressible gas micro convection in transitional and turbulent regimes ... 105
5.3.1 Compressibility effects in micro convection ... 105
5.3.2 Estimation of recovery coefficient under adiabatic conditions... 107
5.3.3 Nusselt number of compressible flows through microtubes ... 113
5.4 Main conclusions of Chapter 5 ... 117
5.5 From microtubes to micro heat exchangers: from fundamentals to application ... 119
6.3 Influence of manifold configuration on flow distribution ... 126
6.4 2D simulation of flow distribution and pressure drop ... 136
6.4.1 Numerical model and Validation of the grid dependence of the results ... 137
6.4.2 Flow distribution and pressure drop of a full layer ... 138
6.5 3D simulation of flow distribution and pressure drop ... 146
6.6 Conclusions ... 150
7 Experimental Investigation on Gas Flow Micro Heat Exchangers ... 153
7.1 Description of the experimental apparatus ... 153
7.2 Data reduction ... 162
7.3 Pressure losses ... 163
7.4 Axial heat conduction in solid walls ... 165
7.4.1 A novel method to account for wall axial conduction ... 165
7.4.2 Influence of wall axial conduction on the performance of microHEX ... 168
7.5 Thermal performance of microHEX with balanced flows ... 174
7.5.1 MicroHEX with countercurrent arrangement ... 175
7.5.1.1 Overall heat transfer coefficient and volumetric heat exchange rate ... 175
7.5.1.2 Heat exchanger effectiveness ... 177
7.5.2 MicroHEX with cross flow arrangement ... 183
7.5.2.1 Calculation of theoretical heat exchanger effectiveness for cross flow ... 183
7.5.2.2 Overall heat transfer coefficient and volumetric heat exchange rate ... 185
7.5.2.3 Heat exchanger effectiveness ... 187
7.5.3 MicroHEX with cocurrent arrangement ... 192
7.5.3.1 Overall heat transfer coefficient and volumetric heat exchange rate ... 192
7.5.3.2 Heat exchanger effectiveness ... 194
7.5.4 Comparison among different flow arrangements ... 199
7.6 Thermal performance of microHEX with unbalanced flows ... 204
7.6.1 Conventional theory on unbalanced flow heat exchanger ... 205
7.6.2 Countercurrent microHEX with unbalanced gas flow ... 206
8.1 Numerical model ... 211
8.1.1 Geometrical construction of numerical model ... 211
8.1.2 Conditions applied to numerical model and computational method ... 213
8.1.3 Validation of result dependence on grid density of numerical model ... 214
8.2 Simulation of the double-layered microHEX ... 215
8.2.1 Numerical model ... 215
8.2.2 Temperature distribution ... 217
8.2.3 Effectiveness of the double-layered microHEX ... 224
8.2.4 Comparison between simulation and experimental data ... 228
8.3 Simulation of the multi-layered microHEX ... 232
8.3.1 Temperature distribution ... 232
8.3.2 Effectiveness of the multi-layered microHEX ... 236
8.4 Conclusions ... 240
9 Conclusions and Outlook ... 243
9.1 Conclusions ... 243 9.2 Future work ... 246 Bibliography ... 247 Appendix A ... 258 Appendix B ... 267 Appendix C ... 269 Curriculum Vitae ... 273 Publications ... 274
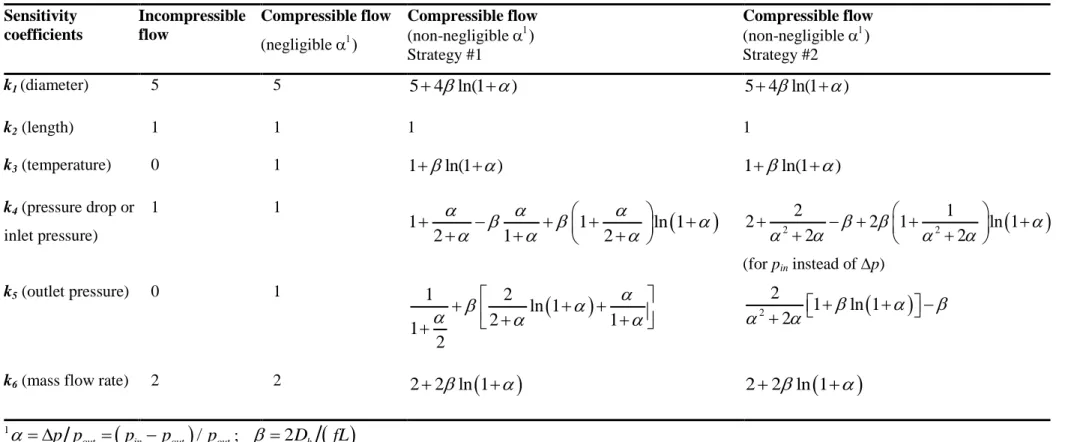
microchannels (except for Gnielinski correlation). ... 5 Figure 3-1: Two different strategies for pressure measurement in determination of friction factor.
... 37 Figure 3-2: Influence of each measured parameter with typical uncertainty for a microtube
having an inner diameter of 100 m and a length of 30 mm. ... 44 Figure 3-3: Contribution of the pressure and mass flow rate measurements (with uncertainties
equal to 0.5% of FS) on the uncertainty of total friction factor. ... 45 Figure 3-4: Effect of the use of two sets of pressure sensors and mass flow meters (with full
scales at Re=500 and Re=2300, respectively) on the total uncertainty of friction factor. .... 46 Figure 3-5: Comparison of the influence of different strategies for the pressure measurement on
the sensitivity coefficients of the inlet, outlet and differential pressure (sensors with a fixed uncertainty (±0.5% of FS)). ... 47 Figure 3-6: Sensitivity coefficients of operating parameters linked to the uncertainty of Nusselt
number as a function of Reynolds number. ... 50 Figure 4-1: Geometry of microtube cross sections. ... 54 Figure 4-2: Schematic layout of the test rig (1- gas source, 2- valve, 3- filter, 4- mass flow
controllers, 5- thermocouples, 6- differential pressure sensors, 7- infrared thermal camera, 8- DC heating, 9- absolute pressure sensor). ... 55 Figure 4-3: Photograph of the test system. ... 56 Figure 4-4: Friction factor as a function of Reynolds number for adiabatic flow through
microtube #1. ... 60 Figure 4-5: Friction factor as a function of Reynolds number for adiabatic flow through
microtube #2. ... 61 Figure 4-6: Friction factor as a function of Reynolds number for adiabatic flow through
microtube #3. ... 62 Figure 4-7: Friction factor versus Reynolds number under adiabatic and heated conditions for
microtube #1. ... 64 Figure 4-8: Friction factor versus Reynolds number under adiabatic and heated conditions for
microtube #3. ... 66 Figure 4-10: Correction of the friction factors of heated flow through microtube #1: (a) m=0, no
correction; (b) m=1, correction for macro flow; (c) m=2, suitable correction with minor deviation. ... 69 Figure 4-11: Correction of friction factor for heated flow. ... 70 Figure 4-12: Effect of wall heating on critical Reynolds number of microflows. ... 71 Figure 4-13: Average Mach number as a function of Reynolds number for the three microtubes.
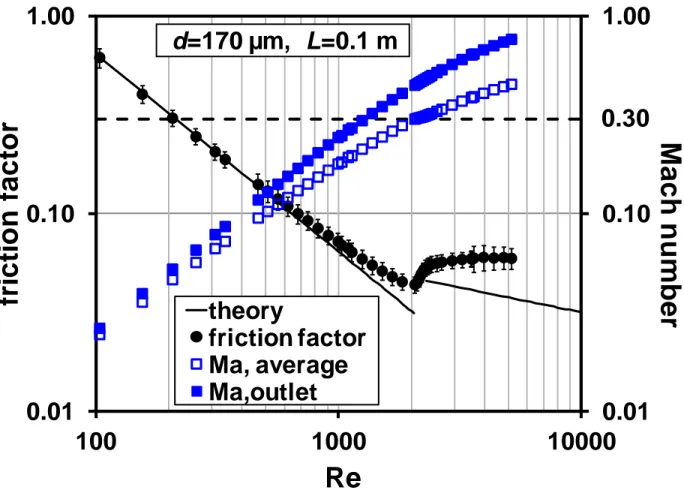
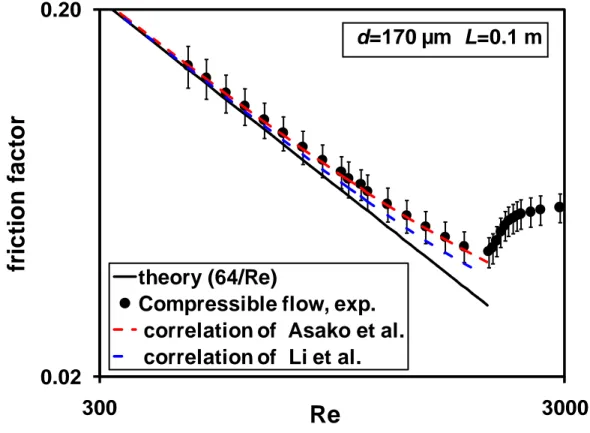
... 73 Figure 4-14: Outlet Mach number as a function of Reynolds number for the three microtubes. . 74 Figure 4-15: Pressure drop of the three microtubes versus Reynolds number. ... 75 Figure 4-16: Friction factor of compressible flow-comparison between experimental data and
theoretical/numerical predictions (by using average Ma as suggested). ... 76 Figure 4-17: Friction factor and Mach number versus Reynolds number through microtube #3. 77 Figure 4-18: Friction factor of compressible flow-comparison between experimental data and
theoretical/numerical predictions (by using outlet Mach number). ... 78 Figure 5-1: Schematic diagram of thermal entrance region... 81 Figure 5-2: Dimensionless thermal entry length of the three microtubes as a function of Reynolds
number. ... 83 Figure 5-3: Wall and fluid temperature difference as a function of Reynolds number ... 91 Figure 5-4: Sketch of microtube outlet section designed for the measurement of exit gas
temperature. ... 92 Figure 5-5: Gas temperature contours in the plenum for: (a) microtube #1 at Re=1400 at the
entrance of the plenum; (b) microtube #3 at Re=600 at the entrance of the plenum. ... 93 Figure 5-6: Wall and gas temperatures measured at different Re for microtube #1. ... 95 Figure 5-7: Axial gas and wall temperature distribution through microtube #1 at Re=1400, under an imposed heating power of 2.8 W. ... 98 Figure 5-8: Axial gas and wall temperature distribution through microtube #3 at Re=600, under
microtube #1 (a) and microtube #3 (b). ... 104
Figure 5-10: Gas and wall temperature at the outlet of microtube #1 under adiabatic condition. ... 108
Figure 5-11: Gas and wall temperature at the outlet of microtube #2 under adiabatic condition. ... 109
Figure 5-12: Gas and wall temperature at the outlet of microtube #3 under adiabatic condition. ... 110
Figure 5-13: Mach number at outlet versus Re for three microtubes. ... 111
Figure 5-14: Recovery coefficient for gas outlet temperature measurement versus Reynolds number. ... 112
Figure 5-15: Gas and wall temperature at the outlet of microtube #2. ... 113
Figure 5-16: Nusselt number as a function of Reynolds number for microtube #1. ... 114
Figure 5-17: Nusselt number as a function of Reynolds number for microtube #2. ... 115
Figure 5-18: Nusselt number as a function of Reynolds number for microtube #3. ... 116
Figure 6-1: Schematic of the micro heat exchanger core. (a) double-layered; (b) multi-layered. ... 121
Figure 6-2: Three flow arrangements achievable in one device. ... 122
Figure 6-3: Heat exchanger effectiveness in dependence on the wall thermal conductivity (adapted from Stief et al. [147]). ... 125
Figure 6-4: Configurations of a typical layer to generate an S-type flow (Type A) and a U-type flow (Type B). ... 127
Figure 6-5: Configurations of a typical layer in the design of Type C and Type D. ... 128
Figure 6-6: Configurations of a typical layer in the design of Type E. ... 130
Figure 6-7: Mass flow distribution in the Type A configuration of the manifolds. ... 132
Figure 6-8: Mass flow distribution in the Type B configuration of the manifolds. ... 133
Figure 6-9: Mass flow distribution in the Type C configuration of the manifolds. ... 134
Figure 6-10: Mass flow distribution in the Type D configuration of the manifolds... 135
pressure of 160 kPa (length of microchannel partly displayed, velocity>100 m/s in white region). ... 138 Figure 6-13: Flow velocity field in the collecting manifold and microchannels at feeding pressure
of 160 kPa (length of microchannel partly displayed, velocity>100 m/s in white region). 139 Figure 6-14: Static pressure in the distributing manifold and microchannels at feeding pressure of
160 kPa (length of microchannel partly displayed). ... 140 Figure 6-15: Static pressure in the collecting manifold and partial length of microchannels at
feeding pressure of 160 kPa (length of microchannel partly displayed). ... 140 Figure 6-16: Mass flow rate of each microchannel under different feeding pressure. ... 141 Figure 6-17: Pressure distribution at inlet of each microchannel. ... 142 Figure 6-18: Pressure drop in the distribution manifold (from feeding port to inlet of
microchannel). ... 143 Figure 6-19: Pressure distribution at outlet of each microchannel. ... 144 Figure 6-20: Percentage of pressure drop in the collecting manifold (from outlet to exhaust port).
... 145 Figure 6-21: Partial views of 3D geometry of one layer. Microchannels with sidewalls (a); small
pillars and feeding port (b). ... 147 Figure 6-22: Comparison of flow distribution obtained from 2D and 3D models. ... 148 Figure 6-23: Mass flow distribution obtained from 3D simulation at two different feeding
pressures. ... 149 Figure 7-1: Typical layer (with 133 microchannels) of the micro heat-exchanger (a); in-situ
measurement in distribution/collecting manifolds (b) (1- pressure sensor; 2- temperature sensor; 3- pillars. unit: mm). ... 155 Figure 7-2: A typical layer manufactured in PEEK material with integrated pressure (1) and
temperature (2) sensors. ... 156 Figure 7-3: Exploded schematic of the double-layered microHEX (a: 1- connection of
thermocouple; 2- connection of pressure transducer; 3- feeding/venting port of the first fluid; 4- metallic cover; 5- PEEK cover with 133 microchannels; 6- partition foil between two fluids; 7- feeding/venting port of the second fluid) and photograph of the manufactured device (b). ... 157
Figure 7-5: Photograph of the test system (1- pressure regulator of gas source; 5- mass flow controllers; 6- temperature regulators; 7- micro heat exchanger). ... 159 Figure 7-6: Photograph of the micro heat exchanger in test (1- pressure sensors; 2-
thermocouples). ... 160 Figure 7-7: The double-layered micro heat exchanger (a) and the partition foil (b) ... 161 Figure 7-8: Pressure drops in different sections of the micro heat exchanger. ... 165 Figure 7-9: Effectiveness of a countercurrent double-layered micro heat exchanger with a thick
aluminum partition foil (AL100) in comparison with theoretical predictions of Eq. (7.10) (continuous line) and Eq. (7.11) (dashed line). ... 168 Figure 7-10: Geometrical parameters of the double-layered microHEX (red color –
microchannels for hot flow; blue color – microchannels for cold flow). ... 169 Figure 7-11: Longitudinal conduction parameter in the previous and present work for gas-to-gas
micro heat exchanger (S.S. refers to stainless steel). ... 171 Figure 7-12: Heat exchanger effectiveness as a function of Reynolds number for different
magnitudes of axial conduction parameter. ... 173 Figure 7-13: Wall conduction parameter by changing the working gases in previous work into
water. ... 174 Figure 7-14: Heat transfer coefficient of the microHEX as a function of mass flow rate. ... 175 Figure 7-15: Volumetric heat exchange rate as a function of mass flow rate. ... 177 Figure 7-16: Effectiveness of microHEX with thin stainless steel foil (SS100) in comparison
with theoretical prediction. ... 178 Figure 7-17: Effectiveness of microHEX with thin copper foil (C100) in comparison with
theoretical prediction. ... 179 Figure 7-18: Effectiveness of microHEX with thick copper foil (C500) in comparison with
theoretical prediction. ... 180 Figure 7-19: Effectiveness of countercurrent microHEX with thick PEEK foil (P500). ... 181 Figure 7-20: Effectiveness of microHEX as a function of mass flow rate for various partition
... 186
Figure 7-22: Volumetric heat exchange rate of cross flow as a function of mass flow rate. ... 187
Figure 7-23: Effectiveness of microHEX with thick PEEK foil (P500) in comparison with theoretical prediction. ... 188
Figure 7-24: Effectiveness of microHEX with thin aluminum foil (AL100) in comparison with theoretical prediction. ... 189
Figure 7-25: Effectiveness of cross flow microHEX with thin copper foil (C100)... 190
Figure 7-26: Effectiveness of cross flow microHEX with thin stainless steel foil (SS100). ... 190
Figure 7-27: Effectiveness of cross flow microHEX with various partition foils. ... 192
Figure 7-28: Overall heat transfer coefficient of the cocurrent microHEX as a function of mass flow rate. ... 193
Figure 7-29: Volumetric heat exchange rate versus mass flow rate for cocurrent flow. ... 194
Figure 7-30: Effectiveness of microHEX with thick PEEK foil (P500) in comparison with theoretical prediction. ... 195
Figure 7-31: Schematic diagram of local fluid and wall temperature development in cocurrent flow heat exchanger. ... 196
Figure 7-32: Effectiveness of microHEX with thin aluminum foil (AL100) in comparison with theoretical prediction. ... 197
Figure 7-33: Effectiveness of cocurrent microHEX with thin stainless steel foil (SS100). ... 198
Figure 7-34: Effectiveness of cocurrent microHEX with thin copper foil (C100). ... 198
Figure 7-35: Effectiveness of cocurrent flow microHEX with various partition foils. ... 199
Figure 7-36: Comparison of effectiveness among three flow arrangements with thick PEEK partition foil (P500)... 201
Figure 7-37: Comparison of effectiveness among three flow arrangements with thin aluminum partition foil (AL100). ... 202
Figure 7-38: Comparison of effectiveness among three flow arrangements with SS100 foil. ... 203
Figure 7-39: Comparison of effectiveness among three flow arrangements with C100 foil. ... 203
Figure 7-40: Countercurrent flow heat exchanger effectiveness as a function of NTU for various ratios of heat capacity rate. ... 205
Figure 7-42: Experimental values of effectiveness as a function of NTU. ... 207 Figure 8-1: A multi-layered micro heat exchanger with hot and cold flows (a) and a typical
element from it (b). (C1D1=D1G1=G1H1=0.1 mm, A1B1=0.05 mm, microchannel length
A1A2=39.8 mm) ... 212 Figure 8-2: 3D model of two microchannels with partition and side walls (a) and schematic
display of heat flux (b). ... 212 Figure 8-3: A double-layered micro heat exchanger with hot and cold flows (a) and a typical
element from it (b). (D1G1 =0.1 mm, C1D1=G1H1=0.2 mm, A1B1=0.05 mm, channel length
A1A2=39.8 mm) ... 216 Figure 8-4: 3D model of two microchannels with partition and side walls in the double-layered
microHEX. ... 216 Figure 8-5: Temperature contour on the right vertical symmetric plane (C1H1C2H2) for three
different thermal conductivities of partition foil (Black lines indicate the surfaces of solid walls). ... 218 Figure 8-6: Temperature contour on the left vertical symmetric wall (A1J1A2J2) for three different
thermal conductivities of partition wall. ... 220 Figure 8-7: Axial temperature distribution for the countercurrent double-layered microHEX with partition foil made of different solid materials (different thermal conductivity). ... 222 Figure 8-8: Axial distribution of overall heat transfer coefficient for a countercurrent
double-layered microHEX with partition foil made of different materials. ... 223 Figure 8-9: Heat exchanger effectiveness for a double-layered microHEX as a function of
partition wall thermal conductivity at Re=550 (countercurrent flow arrangement). ... 225 Figure 8-10: Heat exchanger effectiveness as a function of partition wall thermal conductivity at
different Reynolds numbers (countercurrent flow arrangement). ... 226 Figure 8-11: Heat exchanger effectiveness as a function of partition foil thermal conductivity
with different foil thicknesses (countercurrent flow arrangement). ... 227 Figure 8-12: Heat exchanger effectiveness versus partition wall thermal conductivity for
a countercurrent double-layered microHEX with a balanced mass flow rate of 1.0 kg/h. . 229 Figure 8-14: Velocity vectors at connecting manifolds and central microchannels (channel index:
66-68 out of 133) of the double-layered microHEX (feeding pressure at 500 kPa). ... 231 Figure 8-15: Temperature contour on the right vertical symmetric plane (C1H1C2H2) for three
different thermal conductivities of solid walls (Black lines indicate the surfaces of solid walls). ... 233 Figure 8-16: Temperature contour on the left vertical symmetric wall (A1J1A2J2) for three
different thermal conductivities solid walls. ... 235 Figure 8-17: Heat exchanger effectiveness as a function of wall thermal conductivity for the
multi-layered microHEX with countercurrent flow. ... 236 Figure 8-18: Heat exchanger effectiveness of a countercurrent multi-layered microHEX with
balanced mass flow rates as a function of wall thermal conductivity for air and water flows. ... 238 Figure 8-19: Comparison on thermal performance between double-layered and multi-layered
microHEXs for countercurrent flow arrangement. ... 239 Figure 8-20: Comparison on thermal performance between double-layered and multi-layered
microHEXs for cocurrent flow arrangement. ... 240 Figure A-1: Correction of the friction factors of heated flow through microtube #2: (a) m=0, no
correction; (b) m=1, correction for macro flow; (c) m=2, suitable correction with minor deviation. ... 270 Figure A-2: Correction of the friction factors of heated flow through microtube #3: (a) m=0, no
correction; (b) m=1, correction for macro flow; (c) m=2, suitable correction with minor deviation. ... 272
Table 1-1: Experimental study on gas-to-gas microchannel heat exchangers. ... 6
Table 2-1: Experimental techniques on measurement of microchannel geometry. ... 20
Table 2-2: Experimental techniques on measurement of pressure at microscale. ... 24
Table 2-3: Experimental techniques on temperature measurement in microflows. ... 28
Table 2-4: Experimental techniques on measurement of gas mass flow rate at microscale. ... 34
Table 3-1: Sensitivity coefficients of operating parameters in the calculation of friction factor. 39 Table 3-2: Relative uncertainties of measured quantities in liquid microflows (from Ferguson et al. [121]) ... 40
Table 3-3: Relative uncertainties of measured quantities in gaseous microflows. ... 41
Table 3-4: Typical values of experimental parameters for gaseous microflows. ... 43
Table 3-5: Sensitivity coefficients of operative parameters for determination of experimental uncertainty in Nusselt number. ... 49
Table 4-1: Geometrical characteristics of the tested microtubes ... 53
Table 4-2: Characteristics and accuracy of instrumentation. ... 57
Table 5-1: Calculation of Nusselt number in various flow regimes. ... 87
Table 5-2: Dimension of the tubes in comparison and assumed boundary conditions. ... 90
Table 5-3: Thermal properties of water and air [133]. ... 90
Table 5-4: Temperature-dependent thermal properties of nitrogen adopted in numerical simulation. ... 96
Table 5-5: Typical ranges of the non-dimensional parameters linked to the main effects for the tested microtubes. ... 101
Table 5-6: Value of the fitting parameters obtained for microtube #1(P=1.2 W) and microtube #3 (P=0.6 W). ... 102
Table 6-1: Prediction of operating conditions and selection of sensors. ... 124
Table 6-2: The main characteristics of the 5 types of configurations. ... 131
Table 6-3: Validation of grid dependence. ... 137
Table 6-4: Uniformity of mass flow rate and pressure distribution in terms of microchannel number from 2D simulation. ... 146
number from 3D simulation. ... 150
Table 7-1: Parameters of the micro heat exchangers for fabrication. ... 153
Table 7-2: Uncertainties in the measurements ... 161
Table 7-3: List of partition foils in the present tests. ... 162
Table 7-4: Calculation of heat exchanger effectiveness for cross flow (P500 foil). ... 185
Roman symbols
Br Brinkman number (-)
cp Specific heat at constant pressure (J/kgK)
d Inner diameter (m)
D External diameter (m)
dh Hydraulic diameter (m)
h Convective heat transfer coefficient (W/m2K)
H Height of microchannel (µm)
k Thermal conductivity (W/mK)
L Microtube total length (m)
Lh Microtube heated length (m)
m Mass flow rate (kg/s)
Ma Mach number (-)
Nu Nusselt number (-)
P Heating power (W)
Pr Prandtl number (-)
q Heat flux (W/m2)
R Specific gas constant (J/kgK)
Re Reynolds number (-)
s1 Thickness of microchannel sidewall (m)
s2 Thickness of partition wall (m)
T Temperature (K)
U Overall heat transfer coefficient (W/m2K)
v Average bulk flow velocity (m/s)
W Width of microchannel (m)
Greek symbols
Absolute roughness (m)
Heat exchanger effectiveness (-)
Dynamic viscosity (kg/ms)
Superscript and subscript
adb adiabatic e external surface f fluid h heated i internal surface in inlet value m mean value
out outlet value
stg stagnation
w wall
Abbreviations
CAD Computer-aided design
CFD Computational Fluid Dynamics
2D Two-dimensional
3D Three-dimensional
FS Full Scale
H b.c. Constant heat flux boundary condition LIF Laser-induced Fluorescence
LMTD Logarithmic mean temperature difference MEMS Micro-electro-mechanical System
MFC Mass flow controller microHEX micro Heat Exchanger
microPIV microscale Particle Image Velocimetry MTV Molecular Tagging Velocimetry
NTU Number of transfer unit PEEK Polyether ether ketone
PSMF Pressure-sensitive Molecular Film PSP Pressure-sensitive Paints
RTD Resistance Temperature Detector SEM Scanning Electron Microscope
T b.c. Constant temperature boundary condition
1 Introduction
1.1 Background
In recent years there has been rapid progress in the technology of miniaturization, with devices and systems being scaled down from macrometric sizes to micrometric dimensions [1]. This was not only ignited by extensive engineering and industrial applications with promising market potential, but also stimulated by multidisciplinary research intersecting chemistry, physics, biology, life science, pharmaceutics and engineering, etc.
To meet various industrial demands, the miniaturization technology has been developed in different specialized branches including microfabrication, microassembly, microcontrol, micromeasurement and microprocessing [2]. The achievements in these fields brought about very flexible and smart systems, such as micro-electro-mechanical systems (MEMS), microfluidic devices, lab on a chip (LOC) and micro-total-analysis systems (µTAS). The typical dimension of these systems ranges from 1000 µm down to 1 µm. In the field of mechanical engineering, the state-of-art technologies enable the operation inside micro mixers, micro heat exchangers, micro reactors, micro pumps, micro turbines, to name just a few.These miniaturized devices often accommodate fluid flow, heat transfer and chemical reaction in order to meet very diverse purposes in different fields of application.
The miniaturization of these devices can give some advantage compared to their conventional-sized counterparts. Such devices are very small and can be flexibly adapted to meet various requirements. Due to small sizes and weights, they offer great mobility and can be integrated to many larger systems. Another benefit is the enhanced heat transfer coefficient brought by small hydraulic diameter and large surface-to-volume ratio. In addition, the momentum and thermal inertia of such devices are greatly reduced. This is quite beneficial for precise control and management of temperature field and fluid concentration, and thus has great potential in industrial applications.
The numerical research on fluid flow and heat transfer at microscale can be considered plentiful. Besides conventional computational fluid dynamics (CFD) solvers, such as ANSYS Fluent, OpenFoam, COMSOL and PHOENICS, many home-developed codes using specific methods are reported in literature to further increase the simulation accuracy (which sometimes
can be too much accurate if compared with the typical measurement accuracy which can be reached in the experimental analysis of microflows) and reduce computational time. However, the experimental data on micro flow and heat transfer are scarce compared with the existing numerical research, mainly due to challenges not only in microfabrication, but also in flow control and measurement at micro scale.
By considering the available experimental data from different research groups, diverging conclusions can be drawn, as the error in measurement can be in some case very large (up to 100% uncertainty in measurement). As pointed out by Morini [3], sometimes the physical behavior can be completely masked by large uncertainties in measurement, and the experimental data do not make any sense and thus lead to wrong conclusions. Furthermore, by observing the published experimental works on single phase flow and heat transfer at microscale, it can be noted that the amount of works in which liquids are used as working fluids surpasses the number of works dealing with gases. The crucial lack of experimental data on gaseous flow and heat transfer at microscale makes some problem to validate the large number of analytical and numerical predictions made in this field. This aspect has been also emphasized in a recent review by Colin [4]. On the other hand, increasingly extensive applications of gaseous microfluidic devices nowadays call for more systematic investigation in this field. More and more extensive applications of these devices are pushed to operate under some extreme conditions, i.e., rarefied flows or highly subsonic flows. Therefore, it will be useful to provide designers and engineers with a reliable reference of gaseous flow and heat transfer features through microfluidic devices. This is also motivating to the present research.
This thesis is dedicated to the investigation of the main features of forced convection for gaseous flows through a single microtube and within microstructured devices like the gas-gasmicro heat exchangers, maily from an experimental point of view but always with the supportof numerical simulation.
1.2 Introduction to flow and heat transfer at microscale
1.2.1 Gas flow and heat transfer through microchannels
In the last years a large amount of experimental analyses has been addressed to the study of the fluid-dynamical and heat transfer characteristics of single-phase flows in microchannels, as
summarized by Rostami et al. [5], Morini [3], Hetsroni et al. [6] and more recently, by Dey et al. [7] and Kandlikar [8].
The pioneering experimental investigation on gas micro flow can be traced back to the work by Wu and Little [9], who explored the flow characteristics of N2, H2 and Ar through
miniaturized rectangular channels with hydraulic diameter from 40 to 80 m. They found significant departure of friction factor from classical theory and a very early laminar-to-turbulent transition at Re=900. These abnormal phenomena were attributed by the authors to the large relative roughness in the microchannel wall surface and its asymmetric distribution along the wetted perimeter. Pong et al. [10] developed microchannels which had hydraulic diameters of 2 m with integrated pressure sensors along the flow path. By means of a careful and systematic measurement they found that the pressure distribution of nitrogen and helium flow along the axial direction is not linear. This non-linear pressure distribution was also evidenced in the experimental work by Jang and Wereley [11] even for Reynolds number down to around 100. Harley et al. [12] compared experimental results with numerical simulation for subsonic and compressible flow of N2, H2 and Ar through microchannels having hydraulic diameters from 1 to
36 m. Their work verified that the experimental friction factor could be reasonably predicted by conventional theory considering the uncertainties in measurement. In addition, the authors concluded that cross sectional pressure distribution may be considered uniform and the transverse velocity is negligible. On the contrary, the work by Arkilic et al. [13] evidenced momentum transfer in the cross section from the central axis to the wall surface for helium flow through microchannels of 2.6 m in hydraulic diameter. Combining experimental data and numerical simulations, the authors developed expressions for transverse velocity and cross sectional pressure distribution.
Wu and Little [14] also investigated gas convective heat transfer at microscale. They compared the trend of experimental Nusselt number as a function of Reynolds number in laminar, transitional and turbulent regimes with the classical correlations proposed by Sieder and Tate [15], Hausen [16] and Dittus and Boelter [17] evidencing a strong disagreement with these correlations.
Choi et al. [18] experimentally analyzed the forced convection of nitrogen flows in silica microtubes having inner diameters between 3 µm and 81 m. Their experimental results indicated significant departures from classical correlations. The Nusselt number in turbulent flow
was found larger than the prediction of the Dittus-Boelter correlation [17] but not in agreement with the correlation proposed by Wu and Little. In laminar regime Choi et al. [18] obtained very low values of Nusselt number in strong disagreement with classical correlations. The authors gave no justification for this and proposed a new correlation by fitting their own experimental data.
Yu et al. [19] investigated the convective heat transfer of nitrogen flow in turbulent regime (6000<Re<20000) through microtubes with inner diameters between 19 µm and 102 m. They obtained larger values of Nusselt numbers than those predicted by means of conventional correlations.
Hara et al. [20] experimentally investigated the convective heat transfer of air flows through square minichannels with hydraulic diameters between 0.3 mm and 2 mm. They reported that Nusselt number in turbulent regime can be larger or smaller than the values predicted from Dittus and Boelter correlation. The deviation depends on the hydraulic diameter and length of the minichannels. In laminar regime, the Nusselt numbers were found to be lower than those obtained by Wu and Little [14].
More recently, Chen et al. [21] and Yang et al. [22] conducted experimental research on air and carbon dioxide flow heat transfer through microtubes with an inner diameter of 920 µm. The trend of Nusselt number in both laminar and turbulent regimes was found in agreement with the classical correlation by Gnielinski [23], which was proposed for incompressible flow at macro scale. Their experimental results seem to indicate that the heat transfer coefficient is not influenced by the flow compressibility effect even at very large Reynolds numbers.
By analyzing the works of Wu and Little [14], Choi et al. [18], Yu et al. [19] and Hara et al. [20] it turns out that these authors did not try to explain the peculiar trends of their experimental data, or the possible effects that should be considered. In addition, if the results of these research groups are compared among one another, the mismatch among the data appears well evident both in laminar and turbulent regimes, as plotted in Figure 1-1. However, the authors of these experimental works did not make any efforts to provide a physical explanation of these results; they limited their work to collecting the data for new correlations. This “uncritical” behavior is typical in the field of microfluidics as underlined by Morini [3].
0.1 1.0 10.0 100.0 1000.0 100 1000 10000 100000
Nu
Re
Choi et al. Wu & Little Yu et al.Dittus & Boelter Gnielinski
Nitrogen, Pr=0.72
Figure 1-1: Experimental correlations of Nusselt number for gas convection through
microchannels (except for Gnielinski correlation).
1.2.2 Gas flow and heat transfer through micro heat exchangers (microHEXs)
Among micro-structured devices, micro heat exchangers are of increasing interest, for their improved heat exchange capacities thanks to very large surface-to-volume ratio [24].
The applied research on micro channel heat exchangers using liquids (mostly deionized water) as working media can be considered extensive, even though some of the results are not univocal. Based on experiments with cross-flow micro heat exchangers, Harris et al. [25] found that the volumetric heat transfer in these micro-sized devices is improved at least five times compared to the conventional-sized ones. Improved heat exchanger devices of different microstructure designs and manufactured in metals have been described by Brandner et al. [26, 27]. Alm et al. [28] reported larger heat transfer coefficients and larger pressure losses in ceramic microchannel heat exchangers available for both countercurrent and cross flow arrangements. Cao et al. [29] proposed an experimental correlation for the prediction of the average value of Nusselt number and pressure drop of microchannel heat exchangers. On the contrary, the investigation of Garcia-Hernando et al. [30] showed no heat transfer enhancement or higher pressure drop through micro heat exchangers due to the reduced scale of the channels.
More recently, Mathew and Hegab [31] provided a universal correlation to estimate the heat transfer performance of microchannel heat exchangers subjected to external heat flux, regardless of the cross-sectional geometry of the microchannels.
Compared with the research on liquid micro heat exchangers, experimental investigations on these devices subjected to gas flows are quite few. The experimental works available in literature on gas-gas micro heat exchangers are summarized in Table 1-1 in which for each work the range of the main parameters adopted during the tests is shown.
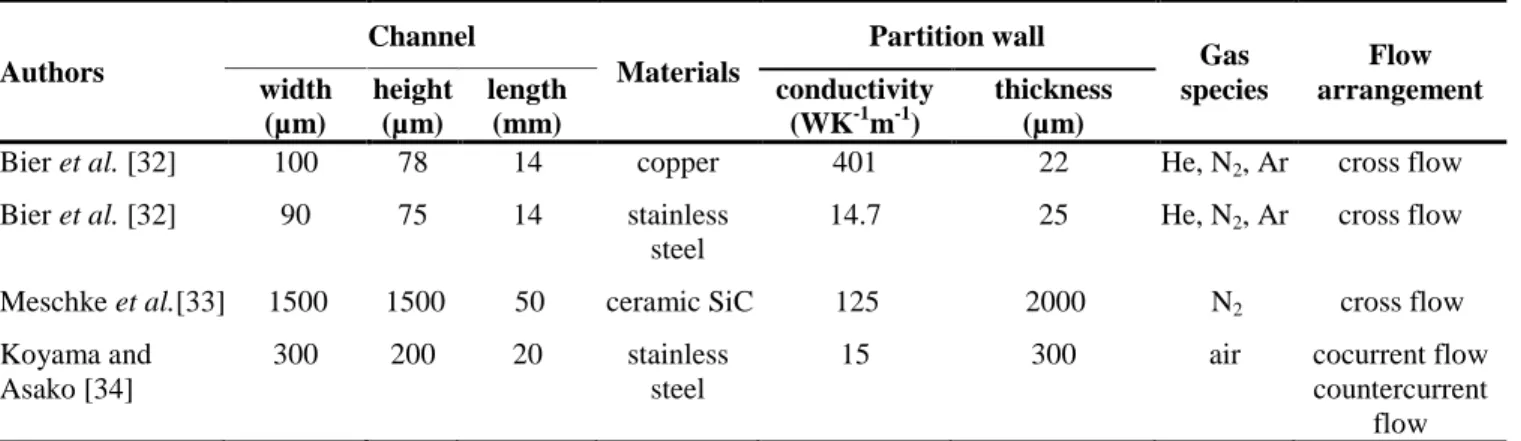
Table 1-1: Experimental study on gas-to-gas microchannel heat exchangers.
Authors Channel Materials Partition wall Gas species Flow arrangement width (µm) height (µm) length (mm) conductivity (WK-1m-1) thickness (µm)
Bier et al. [32] 100 78 14 copper 401 22 He, N2, Ar cross flow
Bier et al. [32] 90 75 14 stainless
steel
14.7 25 He, N2, Ar cross flow
Meschke et al.[33] 1500 1500 50 ceramic SiC 125 2000 N2 cross flow
Koyama and Asako [34]
300 200 20 stainless
steel
15 300 air cocurrent flow
countercurrent flow
The first work on gas micro heat exchangers made of metal was reported by Bier et al. [32] for cross flows of helium, nitrogen and argon. The researchers found that in laminar regime the overall heat transfer coefficients are greatly reduced for low mass flow rates. In addition they proposed a homogeneous model to account for the dominant influence of longitudinal heat conduction in the solid wall. As the thermal conduction in metal (copper and stainless steel) overwhelms that in the fluid, actually in such a case the micro heat exchanger works as a temperature mixer between cold and hot flows. This is probably the reason why this model indicated that the thermal performance of the gas micro heat exchangers does not differ between cross flow, cocurrent flow and countercurrent flow; this result is in complete disagreement with the typical behavior of conventional-sized heat exchangers. Accordingly, it was suggested by the authors that, in order to obtain larger heat transfer rates, material of lower thermal conductivity should be used both for microchannel plates and for the shell of micro heat exchanger.
The experimental data by Meschke et al. [33] on a ceramic micro heat exchanger also evidenced lower values of heat transfer coefficients with respect to the theoretical predictions
were subjected to strong axial heat conduction in solid wall. In addition, the heat losses due to the heat conduction from the ceramic core to the steel housing were found significant on the thermal performance of the micro heat exchanger. The influence of thermal conduction within the solid wall on the overall thermal performance was so large that the impact of flow arrangement (cross, co-current, counter-current) becomes comparably insignificant, as evidenced by the authors.
Similar conclusion was drawn by Koyama and Asako [34] from experiments with a stainless steel micro heat exchanger. In this work no significant difference in the total thermal performance was found between cocurrent and countercurrent flows. The investigators finally used an isothermal model with T boundary condition (constant wall temperature) to explain their experimental data.
More recently, Kee et al. [35] fabricated and tested an alumina micro heat exchanger for gas heat transfer. The device was operated at high temperature range up to 700 °C. They underlined how, due to the limitation of the ceramics fabrication technique, the wall thickness of channels cannot be reduced to the typical sizes of microHEXs made of metal or other material such as polymer. Therefore the thermal performance of the ceramic micro heat exchanger is limited. This work was not listed in Table 1-1 because the researchers used short microchannels with gaps in the flow direction in order to enhance the flow mixing. Thus the physics behind hydrodynamic and thermal behaviors is quite different from the other microdevices.
Another issue raised on micro heat exchangers is the flow distribution among the parallel channels which compose the heat exchanger core. In general, micro heat exchangers are built by using a large number of parallel microchannels for each layer in order to obtain large heat transfer between the hot and cold flows with a limited pressure drop even in the case of large mass flow rates. For this reason, most of the micro heat exchangers described in literature are based on parallel microchannels built on a plate or foil. All the microchannels are connected to the same inlet and outlet manifolds and for this reason they can be modeled as a series of channel in hydraulic parallel. It becomes important to design accurately the inlet and outlet manifolds in order to assure a flow distribution among the parallel channels as uniform as possible. In the work of Bier et al. [32] and Meschke et al. [33] the issue of flow distribution was not addressed. Koyama and Asako [34] found the experimentally measured pressure drop to be several times higher than prediction, and they considered non-uniform distribution of mass flow as one reason
to this disagreement. However, the exact impact of flow maldistribution on additional pressure drop was not estimated in the work of Koyama and Asako [34].
The flow distribution is very important to micro heat exchangers, because it does not only influence the hydrodynamic behavior, but also changes the thermal behavior of these devices. The optimization of flow distribution was systematically studied by Commenge et al. [36] who proposed an approximate pressure drop model. Chein and Chen [37] compared the velocity and temperature distribution along 11 parallel microchannels by changing the positions of distribution/collecting ports. Tonomura et al. [38] developed an automatic optimization algorithm which is able to tailor iteratively the shape of distributing/collecting manifold until satisfying flow distribution is obtained. Balaji and Lakshminarayanan [39] proposed a new design of the distribution chamber in order to obtain a uniform flow distribution. In their design the flow enters the distribution chamber from one port while the exhausted flow is collected by two ports. An original analytical model for optimization of flow distribution in a manifold has been reported by Renault et al. [40]. The authors demonstrated that their model can be able to calculate the flow distribution faster than the classical CFD simulation without losing too much in accuracy.
The methods described in the works available in the open literature provide convenient guidelines for the design of micro heat exchangers. However, up to now it is difficult to find a systematic way to optimize flow distribution inside multi-layered microchannel heat exchangers, mainly due to the difficulties in compromising among all the parameters in design phase. These parameters include: (i) the dimensions of microchannels (width, height and length), (ii) the shape of distributing/collecting manifolds, (iii) the curvature of manifolds corners, (iv) the length of the connections between the heat exchanger core and manifolds, (v) the position of feeding/exhaust ports, (vi) the direction of inflow/outflow, etc. Furthermore, in practical tests and applications of micro heat exchangers, the parameters mentioned above may be subjected to different types of practical constraints coupled with higher priorities as assembling, working condition, vulnerability to possible damages, pricing and so on.
1.3 Effects of gas flow and heat transfer at microscale
This section addresses the main effects that may be encountered in gaseous flow and heat transfer through microdevices. These effects include:
1) Micro effects which require physical reformulation of governing equations and/or boundary conditions when the system is miniaturized from the normal macro dimension, such as rarefaction effects and thermal transpiration;
2) Scaling effects which become significant only when the geometrical scale of the system changes from the reference scale, such as roughness effects, flow compressibility, longitudinal wall heat conduction, temperature-dependence of fluid properties and viscous dissipation;
3) Practical effects which are not related to the system dimension but are very important to obtain correct and accurate results in practical operations of microdevices, such as thermal boundary conditions and accuracy of experimentation.
These effects will be individually introduced in a very brief way in this section, with emphasis on experimental investigation. However, it should be noted that for gas flow and heat transfer at microscale, several of these effects may co-occur under certain conditions. For example, the roughness effects can be conjugated with flow compressibility. Also the influences of these effects on flow dynamics and heat transfer characteristics will be demonstrated in this section by analyzing their impacts on friction factor and Nusselt number.
1.3.1 Rarefaction effects
The gas rarefaction is characterized by the ratio of the mean free path to the typical dimension of the flow volume. This ratio is called Knudsen number, which is defined by:
l Kn
L
(1.1)
where l is the gas mean free path and L is the characteristic length of the volume.
The gas flow is classified into different flow regimes in which different governing equations and/or boundary conditions should be applied according to the magnitude of Knudsen number [41]:
1. Kn<0.001. The flow is in continuum regime, and the flow behavior can be exactly described by the Navier-Stokes equations with non-slip boundary conditions.
2. 0.001<Kn<0.1. The flow is in slip regime in which the Navier-Stokes equations are still valid, but the velocity slip and temperature jump on the wall surface should be applied to these equations. In this flow regime the gas is slightly rarefied.
3. 0.1<Kn<10. The flow is in transition regime in which the Navier-Stokes equations are no longer applicable. The gas flow in this regime is moderately rarefied.
4. Kn>10. The flow is in free molecular regime and the occurrence of molecule-wall collision overwhelms that of intermolecular collision. In this regime the flow is highly rarefied.
At microscale, the flow is confined within very small volume and tends to deviate from continuum regime given that the mean free path does not change notably. The effect of gas rarefaction on friction factors (or mass flow rates) and convective heat transfer coefficients has been investigated in a series of papers in the past [4]. The early experimental work of Harley et
al. [12] showed good agreement with theoretical predictions on slip flow for Knudsen number up
to 0.4. Ewart et al. [42] experimentally investigated the mass flow rate of gaseous flows in slip regime. Later the authors extended their study to near free molecular regime [43]. Pitakarnnop et
al. [44] measured the velocity slip of gas flow in both slip and transition regimes. Demsis et al.
[45] explored the heat transfer coefficient of gas flow in slip regime by applying highly vacuum (very low absolute pressure) flow through tube of constant wall temperature. In general, these works have put in evidence that gas rarefaction is responsible for a decrease of the friction factors along a microchannel (which determines an increase of the gas flow rate for a fixed pressure difference between the inlet and the outlet) and of a decrease of the convective heat transfer coefficients.
1.3.2 Thermal transpiration
While most gas flows at macro scale are driven by an imposed external pressure difference (pressure driven flow), it is possible to generate a flow in rarefied gas by applying an initial temperature gradient along a thin channel while the initial pressure difference between the ends of the channel is set to zero [46]. This phenomenon is known as thermal transpiration or thermal creep, and it has been investigated by many researchers [47, 48] and [49].
The principle of thermal transpiration brought about the idea of Knudsen pump, which is a gas pump with no moving parts and operates under rarefied conditions. In order to have the Knudsen pump operating under low vacuum condition (i.e., near atmospheric condition), the dimension of the thin channel must be small enough, usually at micro or even nano scales. One of the examples is the work by McNamara et al. [50], who manufactured a micro-structured
Knudsen pump which is able to operate at atmospheric pressure. The effect of thermal transpiration can modify the value of the mass flow rate along a microchannel especially for low gas pressure and low flow rates. On the contrary, for a gas pressure larger than the atmospheric value (Kn<0.01) the effects due to thermal creep can be considered always as negligible.
1.3.3 Roughness effects
The surface roughness tends to play an important role on the determination of the friction factors in conventional-sized tubes only in turbulent regime; on the contrary, the role of tube roughness on convective heat transfer coefficients is smaller. An indicator of the roughness level of a tube is its relative roughness defined as the ratio between the absolute height of the wall roughness elements and the hydraulic diameter of the channel. For conventional tubes the relative roughness is always lower than 5%. When the relative roughness is lower than 10-4%, as indicated by the Moody’s diagram, the tube can be considered perfectly smooth. Due to the reduction of the inner diameter, in microchannels the relative roughness can assume very large values, in some cases larger than 5%. In this case the effects of the roughness on the friction factor become evident also in laminar regime.
In order to investigate the influence of roughness effects on pressure drop, Kandlikar and Schmitt [51] manufactured microchannels with different shapes of artificial roughness elements. They found that the surface roughness does not influence the pressure drop in laminar flow as long as the flow area is accurately taken into account by introducing the concept of the “reduced diameter” of the microchannel. Later Tang et al. [52] evidenced that conventional laws for the estimation of the friction factors are still applicable for gaseous flow in microchannels if the relative roughness is smaller than 1%.
Surface roughness may also influence the flow transition from laminar regime to turbulent regime. Kandlikar et al. [53] tested flows through micro and mini tubes with various surface textures. They found that the pressure drop and the transition to turbulent regime are strongly influenced by the surface roughness. These results are in disagreement with the experimental results obtained by Lorenzini et al. [54] for nitrogen flows through microtubes with relative roughness from 0% to 1.0% in which a very weak dependence of the critical Reynolds number on surface roughness was evidenced. In particular, the scattered data points of critical Reynolds
number as a function of either roughness or the ratio of length to diameter (L/d) in the work by Lorenzini et al. [55] and Kolh et al. [56] suggested no explicit relation among them.
Roughness also plays a role in the heat transfer coefficient of gas micro convection. The pioneering experimental research of Wu and Little [14] showed a strong enhancment of convective heat transfer of nitrogen flow through microtubes due to the presence of a large relative roughness around the inner perimeter of the microchannel.and its asymmetric distribution. These results are in disagreement with the 3D numerical investigation of Croce et al. [57] which evidenced slight improvement in convective heat transfer with the relative roughness, in agreement with their earlier results obtained by means of a 2D numerical simulation [58]. More recently, the experimental test by Lin and Kandlikar [59] using artificially structured roughness element for microchannels exhibits very strong enhancement (up to 377%) in convective heat transfer.
1.3.4 Compressibility effects
Unlike liquid flow, micro gas flows may become compressible under certain operating conditions. From the point of view of gas dynamics, the flow compressibility can be characterized by the value assumed by the Mach number, which is defined by:
v Ma
c
(1.2)
where c is the speed of sound and v is the flow mean velocity associated to the channel cross-section.
For gas flows through circular tubes, Eq. (1.2) can be further expressed by
Re RT Ma dp (1.3)
using the state equation of ideal gas, where is the gas dynamic viscosity, Re is the Reynolds number, d is the tube inner diameter, R the gas specific constant, the specific heat ratio of the gas considered, and T and p are the gas bulk temperature and pressure. Eq. (1.3) indicates that a larger value of Mach number will be evidenced if the tube inner diameter is reduced, given that the Reynolds number, and gas species and the operating conditions (pressure and temperature) are kept unchanged. This means that the flow compressibility effects are more likely to be encountered at microscale.
The work of Turner et al. [60] on nitrogen and air flow through microchannels confirms this aspect. They evidenced a very abrupt increase of the Mach number (from 0.4 to nearly unity) in the last 10% of microchannel length, while the increase of Mach number in the first part of the microchannel was rather mild.
The flow compressibility may result in extra pressure losses in flow direction compared with incompressible flows. In other words, flow compressibility tends to increase the friction factor along a channel. Therefore, there was some research devoted to the modification of traditional correlations for the estimation of the friction factor in order to take into account the flow compressibility. Asako et al. [61] developed a correlation between the Poiseuille number and Mach number by solving two-dimensional compressible momentum and energy equation numerically; the numerical correlation was validated by means of specific experimental tests conducted with nitrogen through a series of microtubes having an inner diameter of 150 m. Another similar relation between the Poiseuille number and Mach number was proposed by Li et
al. [62] using an analytical method. Tang et al. [52] developed an additional experimental
correlation in order to consider the compressibility effect by fitting their experimental data. Another effect due to compressibility is the flow choking, which occurs when the Mach number of the flow reaches unity. A direct consequence of the flow choking, as known from its name, is that the mass flow rate does not increase any more with a further decrease of downstream pressure while the upstream pressure remains fixed [63]. Shi et al. [64] studied the behavior of choked flow through a flat minichannel by comparison between experiment and numerical calculation. More recently, Lijo et al. [65] concluded that for choked flows the heat transfer coefficient is higher at the exit, which can be due to the scaling effects. Consequently, the authors suggested to use a scaling factor in order to explain the effect caused by flow choking in microtubes.
1.3.5 Longitudinal heat conduction
Longitudinal conduction, also called axial conduction, refers to heat conduction in flow direction. It occurs in both the fluid and the solid wall. The longitudinal conduction in the fluid can play a significant role for fluid with high thermal conductivity, especially for liquid metals. However, for gases which have low thermal conductivities, the fluid axial conduction is
generally negligible compared to the convective heat transfer between fluid and wall. This also applies to gas convective heat transfer at microscale.
The longitudinal conduction in the solid wall becomes important to the heat transfer characteristics of gas flows at microscale, because the walls of the microchannels are generally “thick” if compared with the characteristic dimensions of the channels and they can host a strong conductive heat transfer, either wanted or unwanted. Such problem is generally referred to as conjugated problem in convective heat transfer [66], or simply, wall-fluid conjugated heat transfer. In some cases the heat transfer between the gas and the wall can be seriously modified by the presence of a longitudinal conduction within the solid channel walls. The wall longitudinal conduction can be characterized by a non-dimensional factor, the longitudinal conduction parameter, which is defined as the ratio of the axial conductive heat flux within the solid wall (q ) and the convective heat flux of the fluid (w qf) [67]:
w f
q q
(1.4)
This parameter is generally very small for conventional tubes. On the contrary, for microtubes Maranzana et al. [68] numerically demonstrated that the conjugate heat transfer can be responsible for an evident change in the axial gas temperature distribution and a remarkable reduction in the convective heat transfer coefficient when the value of longitudinal conduction parameter is larger than1 %. In presence of strong longitudinal wall conduction, the axial distribution of gas bulk temperature may not be linear any more under H (uniform heat flux) boundary condition. This aspect will be investigated later in more detail in the present study. Furthermore, longitudinal wall conduction tends to have a negative impact on the thermal performance of micro-structured devices accommodating gaseous flows, such as micro heat exchangers and micro reactors, as put in evidence by the analyses of Bier at al. [32], Koyama [69] and Meschke et al. [33].
1.3.6 Effects of fluid temperature-dependent properties
The influence of fluid temperature-dependent properties (viscosity, density, thermal conductivity and thermal capacity) has been extensively explored for conventional-sized tubes, as reported by Shah and London [70]. Various methods have been proposed in order to take into account the effect of the variation of the fluid properties on friction factors and convective heat transfer
coefficients such as the property ratio method and the reference temperature method, [71]. According to Shah and London [70], for gas flows through conventional tubes the temperature-dependent properties influence the friction factor but have no effect on the Nusselt number.
However, with dimensions of flow geometry downscaled to a few hundred micrometers or smaller, the temperature gradient in the flows can be quite different from that in the conventional flows. As demonstrated by Mahulikar and Herwig [72], for microflows the low Reynolds numbers and permissible high heat fluxes increase the radial and axial gradients of fluid properties. Therefore, the variation of the fluid thermal properties should be considered in the evaluation of the convective heat transfer coefficients, especially for low Reynolds numbers and relatively large wall heat fluxes.
1.3.7 Viscous dissipation
Viscous dissipation, also known as viscous heating, is the energy dissipation caused by the work of shear forces between the flow layers of different velocity. Early in 1951, Brinkman [73] analytically derived the fluid temperature increase due to viscous heating in capillary. As the transverse velocity gradient in flow through microtubes is very high, viscous dissipation may play a critical role. The importance of viscous dissipation in a channel is characterized by the Brinkman number, which is the ratio of heat generated by viscous dissipation and the heat transferred by thermal conduction. The calculation of Brinkman number takes different forms depending on the thermal boundary conditions applied.
The influence of viscous dissipation in microtubes has been widely investigated experimentally by Tso and Mahulikar [74], Judy et al. [75], and Celata et al. [76], and numerically by Tunc and Bayazitoglu [77], Hadjiconstantinou [78], Koo and Kleinstreuer [79] and van Rij et al. [80]. A detailed analysis of the influence of viscous dissipation on temperature distribution can be found in the work by Morini [81] for microchannels with various cross sections. Most of the above research was focused on liquid flows. For high speed gas microflows, the strong viscous dissipation is accompanied by the compressibility effects and the effect of the flow work. The flow work term and the viscous dissipation term have an opposite sign (negative and positive respectively) in the contribution of fluid temperature change. This fact underlines that the viscous dissipation plays the role of a distributed heat source inside the fluid; on the contrary the fluid thermal expansion cools the flow like a distributed heat sink. Since the viscous