UNIVERSITÀ DEGLI STUDI DI SASSARI
CORSO DI DOTTORATO DI RICERCA Scienze Agrarie
Curriculum Scienze e Tecnologie Zootecniche Ciclo XXIX
Eco-Sustainable Energy
Consumption and Production
in Animal Farming
dr. Elena Brundu
Coordinatore del Corso prof. Antonello Cannas
Referente di Curriculum prof. Gianni Battacone
TABLE OF CONTENTS
ABSTRACT………... 1
RIASSUNTO……….…... 2
STATE OF THE ART AND OBJECTIVES 1 Introduction 4
2 Energy consumption in animal farming 7
2.1 Agriculture, farm classification and organization ... 7
2.2 Animal farming ... 8
2.3 Use of energy in animal farming ... 11
2.4 Energy consumption optimization ... 12
3 Energy production from renewable resources 14
3.1 Energy resources ... 14
3.2 Photovoltaic power system ... 17
3.3 Wind power system ... 22
3.4 Green energy potential in animal farming ... 24
MATERIALS AND METHODS 4 Study farm 27
4.1 Environmental context and general technical features ... 27
4.2 Internal organization and production cycles ... 28
5 Energy consumption survey 31
5.1 Detection and analysis of equipment involved in the production cycles ... 31
5.2 Survey of energy consumption levels during the experimental period ... 32
6 Consumption optimization model 36
6.1 Algorithm development ... 36
6.2 Equipment involved in the model development ... 38
6.3 Mathematical model development by software ... 40
6.3.1 Model development with Lingo 15.0 ... 40
6.3.2 Model development with Vensim ... 42
7 Environmental data survey 43
7.1 Solar irradiance measure in the study period ... 43
7.2 Wind speed measurement during the experimental period ... 45
7.3 Data elaboration and analysis ... 46
8 Energy production by the photovoltaic system 48
8.1 Photovoltaic system ... 48
8.2 Energy production during the study period ... 51
8.3 Data elaboration and analysis ... 52
9 Energy production by the wind power system 53
9.1 Wind power system (mini-turbine) ... 53
9.2 Energy production survey in the study period ... 56
RESULTS 10 Energy consumption in the farm 61
10.1. Overall consumption and equipment analysis ... 61
10.2 Swine production cycle ... 63
10.3 Sheep production cycle ... 67
10.4 Daily consumption distribution ... 70
11 Consumption optimization model 72
11.1 Objective function ... 72
11.2 Algorithm development through software ... 74
11.2.1 Use of Lingo software ... 75
12 Environmental data analysis 85
12.1 Solar irradiation intensity ... 85
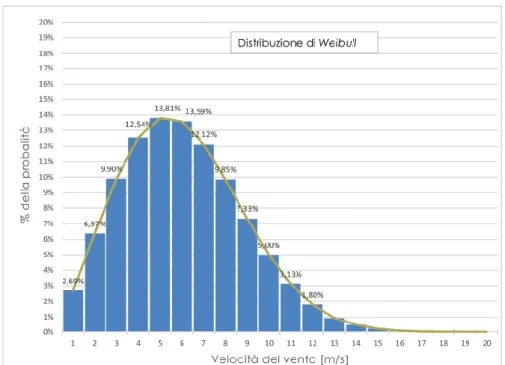
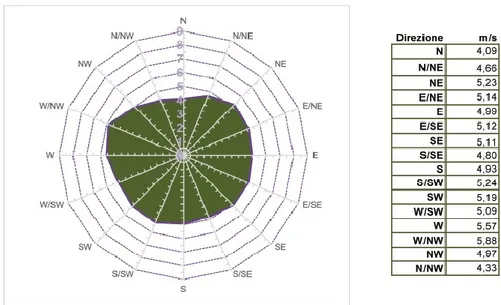
12.2 Wind speed ... 87
13 Photovoltaic power system: energy production and simulations 89
13.1 Photovoltaic energy production monitoring ... 89
13.2 Simulation of the energy produced by the photovoltaic system... 90
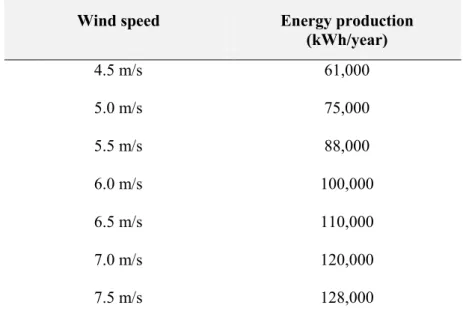
14 Wind power system: energy production and simulation 94
14.1 Energy production by the wind power system ... 94
14.2 Wind turbine energy production simulation ... 95
15 Analysis of energy self-sufficiency in the farm 98
15.1 Overall energy production by wind and solar power systems... 98
15.2 Green energy production vs energy consumption in the farm... 99
DISCUSSION AND CONCLUSIONS 16 Discussion 101 16.1 Energy consumption in the farm and development of an optimization model ... 101
16.2 Environmental potential and green energy production... 105
16.3 Conclusions ... 108
ACKNOWLEDGEMENTS... 110
ABSTRACT
Intensive animal farming is highly energy demanding and often associated with concerns for food quality and for the environment. Pursuing the general objectives of implementing reliable tools for energy use optimization and for green energy sources exploitation in animal farming, we investigated the energy consumption and production during a three year period in a study farm hosting a rooftop photovoltaic system and a mini-turbine.
Consumption data, collected by detection and in depth analysis of equipment involved in different production cycles, were used to develop and validate a mathematical optimization model, leading to significant energy and money savings through the replacement of actual with alternative and more energy efficient equipment.
Environmental parameters in the same animal farming context, with special regard to solar irradiation and wind speed, were surveyed and employed as input data to run specific simulation software applications that estimated the expected energy production levels of the photovoltaic and wind power systems. The output of these simulations, based on actual and estimated environmental data, was compared to the green energy produced in the farm, which allowed to quantify the deviation between actual and estimated values.
Everything considered, the application of this study approach on a larger scale will generate useful tools for farm management toward general economical benefits and a higher environmental responsibility.
RIASSUNTO
L’allevamento zootecnico intensivo comporta un elevato consumo energetico, spesso associato a preoccupazioni riguardanti qualità della carne e sostenibilità ambientale. Il presente studio si è posto gli obiettivi di sviluppare uno strumento per l’ottimizzazione dei consumi energetici e di verificare l’efficienza produttiva degli impianti fotovoltaico e mini-eolico in un sistema mediterraneo.
I dati sui consumi energetici associati a ciascun dispositivo e ciclo produttivo aziendale, rilevati durante un triennio, sono stati elaborati per lo sviluppo e la validazione di un modello matematico che ha permesso di identificare i dispositivi maggiormente energivori e di suggerire la loro sostituzione con altri più efficienti dal punto di vista energetico, determinando così un risparmio per l’azienda.
Lo studio delle produzioni mediante fotovoltaico ed eolico si è basato sul confronto tra i livelli rilevati e quelli ottenuti tramite simulazione impiegando sia dati ambientali (radiazione solare e velocità del vento) misurati durante il periodo sperimentale che dati probabilistici disponibili su diversi database. Gli scostamenti tra valori reali e stimati sono stati trascurabili per il fotovoltaico e più variabili per l’eolico.
In conclusione, l’applicazione di questo approccio allo studio su più larga scala consentirà di mettere a punto strumenti utili alla gestione aziendale finalizzata sia al beneficio economico che ad una maggiore responsabilità per l’ambiente.
STATE OF THE ART
AND OBJECTIVES
1
INTRODUCTION
Intensive animal farming is a highly energy demanding activity that is often associated with concerns for the deriving food quality and for the environment (Petit and Hayo, 2003). As stated by the Food and Agriculture Organization of the United States (FAO) in the recent report “World Livestock 2011: Livestock in food security”, an increase in the use of large scale intensive animal breeding is predicted, as a consequence of the per capita protein consumption in developing countries.
To satisfy the food needs of a growing human population (Connelly, 2009) and to stay aligned with environment protection principles (De Schutter and Vanloqueren, 2011), it is vital to pursue sustainable animal husbandry purposes.
Hence, a more environmentally responsible intensive livestock production, is a primary objective to be achieved. A coherent approach is the implementation of innovative systems that allow animal production efficiency (Reilly and Willenbockel, 2010; Pulina et al. 2011).
If we refer to energy-related issues, it is possible to identify two main lines of action focused on pursuing the animal farming ecological and economical sustainability: 1) energy saving through the optimization of energy consumption, and 2) the implementation of green energy production systems, which results in a lower environmental impact.
In order to implement systems aimed at the optimization of energy consumption it is first necessary to conduct an in-depth analysis of farm equipment and operations that determine the use of energy. Once the energy demanding items have been identified they should be monitored so as to determine the consumption level on a day by day basis and over the year. To perform this task, specific tools need to be developed and made available to the farm managers and their consultants.
On the other side, the production of the energy necessary to satisfy the farm needs, may derive from renewable energy resources (Biondi et al., 1989; Riva, 1990). Given their availability, persistence and eco-compatibility (lack of emission of polluting substances) features, the interest on these “green energy” sources is significantly growing, according to the noble purpose of reducing Earth global pollution (Tilman, 1998; Tilman et al., 2001). Research activities conducted during the last decades, led to the development of new technologies aimed at improving the exploitation of renewable energy resources, taking into account their strengths and weaknesses, as well as several aspects related to system optimization design principles (Castelli and Mazzetto, 1986 and 1988; Riva et al., 1987). Among these, photovoltaic and wind power systems that exploit solar irradiation and wind speed, respectively.
In line with the need to implement reliable tools to optimize the use of energy and to favour the use of green energy resources in animal farming, the present study pursued the following main objectives:
1 To study the energy consumption system in a Mediterranean context and to develop a mathematical model for its optimization;
2 To evaluate the performance of photovoltaic and wind power systems in relation to the environmental conditions in a livestock farm, representative of the study site.
The thesis is divided into four sections. Section one, “Energy use and production in
animal farming”, provides introductive information on the animal farm classification, work
organization and energy consumption and production through the exploitation of renewable energy resources. This section furnishes also general information on the state of the art models and tools developed for energy consumption optimization in other industrial sectors
and on the technology supporting the production of green energy. Section two, “Materials
and methods”, concerns the techniques adopted and methodologies followed to conduct this
study, including the selection of a study farm, the detection of energy consumption items, the collection of consumption data and their elaboration to develop and validate a consumption optimization mathematical model, survey of environmental parameters (solar irradiation and wind speed), monitoring of actual energy production by rooftop photovoltaic and wind power systems installed in the study farm. Section three, “Results”, shows results and outcomes of the different data collected and their elaboration, including modelling and simulation, which are discussed in the section four, “Discussion and conclusions”.
2
ENERGY CONSUMPTION IN ANIMAL FARMING
2.1 Agriculture, farm classification and organization
Agriculture involves crop cultivation and livestock production systems aimed at generating products used to support and improve human life. Both plant cultivation and animal breeding are frequently included within the same farm. Business farm classification is formally based on their prevalent productive orientation and size, with special regard to their turnover. For this purpose gross income standards, calculated on a three year basis, are normally employed for such categorization.
The use of a classification system based on the technical-economical orientation (TEO) is recommended by the European Union. This includes the following three hierarchical levels:
- general, each TEO corresponds to a wide productive sector; - main, each TEO is a detail of the general ones;
- specific, possible specializations are identified within a main TEO.
On the basis of the proportion of each general and main orientation, a farm is classified according to four different specialization levels that take into account the turnover:
-specialized orientation, the turnover associated with a productive activity achieve 2/3 of the
whole farm turnover;
-dual orientation, the turnover associated with two productive activity is between 1/3 and 2/3 of the whole farm turnover;
-partially dominant orientation, the turnover associated with a productive activity is above 1/3 of the whole farm turnover, but not above 2/3;
-mixed orientation: no activity exceeds 1/3 of the whole farm turnover (De Gaetano, 2013; Belletti and Marescotti, 2015).
The productive process is represented by all activities involved in the production cycles that need to be managed harmoniously and coherently with the objectives of the entrepreneurs and with efficiency and competitiveness principles.
2.2 Animal farming
Although animal farming can be conducted according to different management techniques, several are the in common aspects that can be identified in any livestock system.
A livestock system can be defined as a pool of state variables (eg. physical environment, animals, production, technical equipment, people, capitals), and functions (flow of energy, material and information), including the relationships existing among all components.
Although it might be difficult to classify livestock systems, it is possible to make a distinction on the basis of the following four criteria:
1) productivity and relationship with the local agricultural system providing animal feed;
2) farm specialization and animal productivity level; 3) internal organization degree;
4) social and economical aspects.
1) Productivity and relationship with the local agricultural system providing animal feed Animal breeding may totally or partially depend on, or be completely unrelated to animal feed production. In the latter case animal husbandry is defined as no-soil farming.
The farm may include forage crops with different productivity levels, depending on soil fertility, technical and environmental conditions. A useful productivity indicator is represented by the number of animals that can be supported by a farm surface unit, normally expressed as animal weight (kg) / surface (ha), and referred to the average year under ordinary conditions. The farm self-supply index, expressed as energy or dry matter, is calculated as the ratio between the feed annually produced in the animal farm and the whole feed consumption.
2) Farm specialization and animal productivity level
A main distinction can be made between specialized and mixed farms. The first type includes only one animal species (individual orientation), while the second involves more species (mixed orientation).
The productivity level, expressed as a percentage, refers to the position of a specific farm in respect to a reference population of farms.
3) Internal organization degree
Based on the technological level associated with the productive process management, animal farms can be distinguished in farms with a high, average or low technological level. In the first case, an extensive mechanization and computerization of farm operations is observed, which lead to precision livestock farming (Fournel et al., 2017). By contrast, in other cases the use of technology is limited, even if occasionally advanced techniques and equipment are employed.
A critical aspect in livestock farming is the real-time data recording and elaboration procedures, which should provide in time information to the farmer, thus properly supporting the management and decision making process.
4) Social and economical aspects
Animal farms can also be classified in relation to the local social and economical context and the relationships and connections with the National and International market, which define the type of company and its position within the productive context.
Considering the intensity of productive factors use (i.e., soil, work, capital, production process organization), animal husbandry can be classified in four different types. The intensity degree of a farm is represented by the ratio between cost of labour and revenues, that is defined as Labour Cost Index (LCI). On this basis, a livestock system can be intensive, semi-intensive, semi-extensive, and extensive.
1) Intensive.
The farm normally involves a single productive orientation, is highly specialized, with a high productivity and technology level, an LCI between 20 and 30 %, and is based within a mature entrepreneurial environment. This category includes no-soil swine, poultry and rabbit farms, where animals are subjected to permanent housing.
2) Semi-intensive.
The productive factors are employed at a lower level compared to intensive farming, the LCI is between 30 and 40%, and animals breeding is based on semi-permanent housing. This category includes dairy cattle farming involving some grazing, poultry ground breeding, swine plain air systems, sheep and got breeding under both housing and grazing conditions.
3) Semi-extensive.
Animal breeding is mixed, the productive level is average-low, the LCI is between 40 and 50%, and grazing is usual. This system includes several sheep farms with a good production of milk and meat, and cattle kept on pasture.
4) Extensive.
The productive orientation is normally mixed, all productive factors are used at minimal level, the number of animals per surface unit is low, animal housing is rare or absent, and pasture is the sole or the prevalent animal feed source. This category includes sheep for wool and meat production, rustic cattle, goats and swine in the wild.
2.3 Use of energy in animal farming
Modern livestock farming has evolved toward a continuous increase in the investment needed to keep abreast of the technology advancements and to face the industrial dependence on feed and energy providers.
The technological progress caused an intense farm renovation, and the livestock sector has been featured by two main trends: ergonomic reorganization toward an increased farm size and mechanization increase.
Consequently, the increased use of more technological equipment translated into an augmented energy consumption, which determines the need to contain the production costs, so as to be competitive in the market.
Most studies on the reduction of the environmental impact in animal farming, are mainly focused on animal feeding techniques and methods, which represents a fundamental energy input in such productive systems (Eriksson et al., 2005).
More in general, it can be stated that the energy need - in sensu lato - represents a key factor for profitable animal breeding. In this context it is important to distinguish between the so called “inclusive energy”, represented by all farm components (Hammond and Jones, 2008), and the “operating energy”, that is the energy input that makes the system work every day. The latter, representing a high cost for the farm, includes the electrical energy needed to maintain an appropriate animal breeding environment.
2.4 Energy consumption optimization
Despite significant differences among livestock production systems in diverse world areas, related to different animal races, climatic conditions, farm operations, and market objectives, the sustainable use of energy represents a common purpose (Lammers et al., 2010; Murgia et al., 2008; Rossi, 2011).
Energy consumption optimization requires the implementation of energy management tools ad hoc designed on specific animal husbandry models, like those typical of the Mediterranean environment (De Corato and Cancellara, 2014). These animal breeding systems, especially if intensive, normally involve the use of highly energy demanding equipment (i.e., lighting, air-conditioning, ventilation, heating), which usually translates into an important electrical energy need.
Reducing this energy consumption would be strategic and beneficial not only to the environment, but also to increase the overall farm productivity with significant money savings.
Several methods and mathematical models to optimize the use of energy have been developed in a variety of industrial sectors (Clarke, 1988; Colon-Vazquez, 2011; Frangopoulos, 2009; Méndez-Piñero and Colón-Vázquez, 2013).
The application of mathematical models for analysis and optimization of energy consumption in animal farming is well documented, however most of the related studies are mainly focused on the animal feed rations and diets (Kelemen et al., 2015).
The development and application of mathematical models aimed at managing and reducing the use of electrical energy (a major factor of production), is less studied. Indeed, electrical energy significantly contributes to the economical farm balance and it should become a main target for the farm managers pursuing cost minimization and profit maximization objectives.
One of the approach to pursue significant middle/long term energy savings is the replacement of the most energy-demanding equipment with less energivorous alternatives. Such purpose is normally achieved through the acquisition of new instruments when old ones are obsolete, or occasionally to exploit specific incentives. Hence, a lack of a proper plan for equipment replacement based on energy consumption optimization in the farm is still very common.
3
ENERGY PRODUCTION FROM RENEWABLE RESOURCES
3.1 Energy resources
Energy sources can be classified as primary or secondary, depending on their availability in nature and if they can be directly used.
Oil, coal, natural gas, biomass, nuclear fuel (mainly uranium) and renewable sources are classified as primary sources, while gasoline, LPG (liquefied petroleum gas), hydrogen and electricity are secondary energy sources, deriving from properly treated primary sources.
Based on another classification criterion, conventional and non-conventional or alternative energy sources can be identified. The first category includes fossil fuels, while all the other sources of energy are defined as alternatives.
Fossil fuels are among the non-renewable energy sources, whose cycle of production and reproduction timing is not comparable with the human consumption timing. Their exploitation undermines their availability on Earth and consequently, their exhaustion timing is strictly dependent on the intensity of their use.
Renewable energy sources are by definition inexhaustible (i.e, wind, sun, water, earth's endogenous heat) or able to reproduce very quickly (i.e., firewood and biomass).
More in general, renewable energy sources are those that the planet provides without changing its energy balance and without affecting existing resources" (Pallabazzer R.,2011) In the case of solar energy, thermal solar energy is converted directly and instantly into electricity using photovoltaic technology whereby panels from doped-silicon cells, exposed to solar radiation, generate electricity.
In wind power systems, the wind's kinetic energy is converted into electrical energy by converting the mechanical energy generated by the rotation of wind turbine blades.
Hydropower is the power generated by falling water or fast running water. The kinetic energy of the water masses in motion rotates the turbines that transmit their mechanical energy to the alternator for the production of electrical energy.
Geothermal energy is generated by geological heat sources. It is based on the exploitation of the natural heat of the earth due to the thermal energy released by a nuclear decay process of radioactive elements naturally contained within the mantle and crust.
The term biomass refers to organic matter that can be used in special plants to produce energy. Such matter can have varying origins, and includes waste of agriculture, livestock and food industry, animal wastes, municipal waste or even plant species specifically grown for this purpose.
The national legislation defines biomass as “the biodegradable fraction of products, waste and residues from agriculture (including vegetal and animal substances), forestry and related industries including fisheries and aquaculture, the cuttings and pruning residues from urban green areas as well as the biodegradable fraction of industrial and municipal waste" (CE n. 18/2001)
If biomass is burned produces fossil-free thermal energy, and when fermented inside special digesters, anaerobic processes produces biogas. It can be also used to produce biofuel (eg. biodiesel from rapeseed oil, ethanol or ethyl alcohol from grain and sugar-rich vegetables). The interest in renewable energy has grown significantly over the last years, especially in response to a predicted fossil fuel depletion and to the concerns associated with global pollution (Chel and Kaushik, 2011).
A further classification of renewable energy sources, based on the level of technological exploitation, discern among classical renewable sources, new renewable energy sources (NRES) and innovative renewable energy sources.
The classical inexhaustible sources are those whose exploitation is based on widely validated and over time consolidated technologies, such as hydropower and geothermal energy.
The new renewable or second-generation renewable sources, which include wind, photovoltaic (solar and thermal) and biomass, are those for which a higher scientific and technological development effort have been made, so as to scale up their use.
Innovative renewable sources, also known as brand-new sources of renewable energy, future renewable or third generation renewable sources, are based on ultra-modern technologies, many of which are still at an early experimental stage. These include the exploitation of solar energy through thermodynamic solar concentration technology and many forms of marine source systems.
Considering the production of electrical energy, all energy sources and especially the renewable ones, can be further classified as programmable and non-programmable sources, depending on whether the energy production can be organized and regulated in relation to use.
The first group, in addition to the non-renewable sources such as fossil and nuclear energy, also includes some renewable sources such as hydroelectric power produced in tank and reservoir plants, and biomass, including the biodegradable fraction of municipal solid waste.
The non-programmable sources include most of the renewable sources like wind, solar, and geothermal power systems.
In summary, the renewable energy sources are those whose use does not affect their availability for future generations. Besides "Renewable Energy", the term "Sustainable Energy" is often used to highlight the concept of sustainable development based on an environmental and social perspective.
3.2 Photovoltaic power system
A photovoltaic power system allows the direct and instantaneous conversion of solar into electric energy through photovoltaic technology.
The main functional components of a photovoltaic system include:
- photovoltaic panels made of semiconductor material;
- photovoltaic inverter to convert continuous into alternating current; - devices for energy storage (battery);
- electric panels and counters; - assembly structure.
The elementary component of the photovoltaic system is the photovoltaic cell. More assembled cells are connected to each other to make a photovoltaic module; more modules make a panel; more panel series make a string; more parallel strings are connected to make a photovoltaic generator.
The photovoltaic cells, are generally made of silicon and when exposed to solar radiation are able to generate electricity through the so called photovoltaic effect (Sproul A., 2017). This process occurs when an electron present in a conveniently treated (doped) semiconductor material is hit by a photon.
Silicon is a tetravalent atom, which means that has four outer electrons available for chemical bonding, so that in a crystal of silicon, each silicon atom bonds to four other silicon atoms.
Because of the property of silicon to form a crystal involving all of the bonding electrons, it is called a semiconductor. As a result of heat or light, if a sufficient amount of energy (1.1 electron-volts, corresponding to 1 photon) is supplied to the crystal, covalent bonds can be broken and the electron is free to move throughout the crystal.
In a process called "doping", phosphorus (dopant atom) can replace some of the silicon atoms. Phosphorous is pentavalent and bind covalently to silicon in the crystal involving 4 of his electrons. Consequently, the fifth electron is only weakly (0.045 electron volts bonding energy) attached to the phosphorous atom, and as a result of a slight temperature increase (or just at normal temperature) this electron is free to move throughout the crystal. It can be inferred that the silicon crystal electrical conductivity can be changed by adjusting the number of dopant atoms in the crystal. Because of this free to move electrons from dopant atoms, the resulting crystal material is called n-type silicon.
Another type of substitution in the silicon crystal can be made by boron that has only three electrons available for covalent binding with silicon atoms, which means that the resulting crystal has an electron vacancy or “hole”. Room temperature is sufficient to generate the thermal energy causing the movement of a nearby electron to fill the hole. Consequently a hole movement from atom to atom is generated. This hole moving corresponds to a movement of positive charges. When boron or an atom with similar properties is used as a dopant atom generating mobile holes, the resulting crystal is called p-type silicon.
If one side of silicon is doped with a p-type dopant (i.e., boron) and the other side with an n-type dopant (i.e., phosphorous), a p-n junction is formed. This determines a p-region with an excess of electron holes and an n-region with an electron surplus. In the p-n junction
electrons move from the region with higher electron density (n) to the region with lower electrons density (p), thus generating a built-in electric field.
When light shines on a silicon solar cell, which is essentially a large p-n junction, current and voltage are generated. Current will flow from the p-type side to the n-type side (conventional current). If the p-n junction is connected to an external conductor, a close circuit in which the current flows from a greater potential towards a minor potential layer, is created. This flow will continue until the achievement of the electrostatic equilibrium, which determines a positive charge density in the n-region, an excess of negative density in the p-region and an intermediate (halfway) p-region called depletion p-region. As a result the built-in current field is created in between the depletion region.
To this end, if sun photons enter for instance the n-region, electron-hole couples are generated in both n- and p-regions. The built-in field allows to separate the exceeding electrons from holes, pushing them toward opposite directions. Once pushed over the depletion region, electrons are not able to come back because obstructed by the field.
When the junction is connected to an external conductor, in the obtained close circuit the electron flow from n to p layers as long as the cell is exposed to light. In that way solar energy is exploited to produce electricity in a direct manner.
The electric current generated by the photovoltaic cell, depends both on the size of the surface exposed to solar radiation and on it slope. The main factors affecting electric energy produced by a photovoltaic system are radiation, modules temperature and shadows.
Energy transfer from the photovoltaic system to the user occurs through special devices called inverters, that are DC/AC converters able to transform direct current produced by photovoltaic modules into alternating current for users. In relation to the presence or the lack
of a connection to the National electric network (electricity grid), the photovoltaic system can be classified as grid-connected, stand-alone and storage.
Grid-connected
Grid-connected systems are permanently connected to the utility grid through a bi-directional interaction, so that the grid-connected photovoltaic system supplies the excess power, beyond consumption, to the utility grid. These systems do not include an integrated battery solution for energy storage. Several studies on their profitability have been conducted (Colmenar-Santos et al., 2012).
Stand Alone
The power systems are independent and not connected to the utility grid, therefore they are particularly useful to electrically isolated users. This system, in addition to photovoltaic panels and the inverter, includes an integrated battery solution for energy storage, a control unit to optimize energy production, and a charge regulator for stabilization and management of collected energy in relation to the energy consumption needs.
Storage.
It is a hybrid photovoltaic system which combines the two previous system types. It represents an innovative system in which energy production is used in different ways and timing.
In a first phase energy is consumed by users to satisfy their needs and later is stored in batteries that can be filled to capacity. Finally, the excess energy is supplied to the utility grid.
The amount of electrical energy that can be generated by a photovoltaic power system depends on several factors including the environmental conditions of the site in which is installed, the season considered, the size, orientation and slope of the surface exposed to the sun light.
The nominal peak power (kWp) represents the electric power generated by a photovoltaic system under standard conditions (STC):
- solar irradiation perpendicular to the panels = 1 kW/m2; - cell temperature = 25°C;
- air mass (AM) = 1.5.
Main advantages of the photovoltaic power system include: - free and unlimited energy source;
- no polluting substance emission; - no thermal and noise pollution;
- contribution to reduce the use of fossil fuels; - easy and fast installation;
- modularity allows to easily increase surfaces based on different needs; - high reliability and 25 years warranty;
- installation is possible either in urban and in isolated areas; - easy integration with buildings (eg. rooftops);
- limited maintenance costs;
- reduced loss due to voltage load fluctuations normally associated with energy transfer.
The main limitations of the photovoltaic system includes the still limited production efficiency, the daily and seasonal solar radiation variability, and the sometimes high visual
impact of these systems. Their good performance in the Mediterranean environment, including Sardinia (Italy), is well documented (Ghiani et al., 2013; Spertino et al., 2013; Zappavigna, 2011).
3.3 Wind power system
The wind's kinetic energy is converted into electrical power by a wind turbine that can have a vertical or horizontal axis. While small turbines are used for a variety of applications (boats, caravans, traffic signs, battery charging), larger turbines can provide the energy needed at domestic level or in a farm (Manwell et al., 2012).
The power may also supply the electrical grid and be sold to the utility supplier.
Conventional horizontal axis turbines (HAWT) usually include the following main components (Gasch and Twele, 2012):
- The rotor, typically with three white coloured blades (20-40 m in length) pointed into the wind by computer-controlled motors for converting wind energy to low speed rotational energy (10-22 revolutions per minute);
- The generator, consisting of an electrical generator, the electronic control panel, and possibly a gearbox, adjustable-speed drive or continuously variable transmission;
- The tower (60-90 m tall) and the rotor yaw mechanism that give structural support.
Based on their power (Caffarelli et al., 2009), aerogenerators are classified as: - micro-turbines: power is below 20 kW; mainly for domestic use;
- mini-turbine: power is between 20 and 200 kW; used to produce and sell electrical energy;
- turbine: power is higher than 200 kW; typical of wind farms.
To start producing electrical energy, an aerogenerator needs a minimal wind speed (cut-in) of 3-5 m/s, while project power is normally achieved at 12-14 m/s that represent the “nominal speed”. A maximum wind speed (cut-off) around 25 m/s represents the level that determines the activation of a breaking system for safety reasons.
Main advantage of wind power systems include: - free and clean energy source;
- electricity can be directly supplied to the utility grid; - fast installation timing.
Main limits of wind power systems include: - wind variability and unpredictability;
- an aerogenerator needs a minimal wind velocity of 3-5 m/s, and a good working condition is not achieved until speed reaches 12-14 m/s. If it is too windy, the safety system activate brakes (above 20-25 m/s);
- a wind power system require the availability of a significant soil surface that cannot be diversely employed in a farm;
- turbines have a significant environmental impact; - they imply a significant noise pollution;
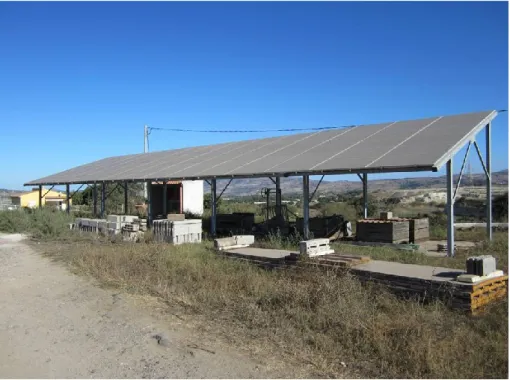
3.4 Green energy potential in animal farming
Animal farming in the Mediterranean area is often conducted in farms with a mixed orientation, often associated with the availability of uncultivated soils, which can be translated into the availability of space to host renewable energy power systems. Furthermore, photovoltaic solar systems can be placed on rooftops.
The implementation of these systems is favoured by current incentive measures providing financial support to the farmer. For this reason an increase of renewable energy use in animal farming is being experienced in the Mediterranean area.
Although the dependence from climatic factors represents the main limitation associated with these energy sources, the over time variability and seasonality of their availability can be overcome through the combined use of more renewable energy resources. In this way, the individual fluctuation during the day and throughout the year of one resource can be compensated by another (Zhou et al. 2010).
Consequently, copious efforts are being devoted to studying the combination of diverse green energy types, which may lead to the development of hybrid systems. This approach would be significantly beneficial also to the livestock farming context, where extended farm areas can easily host photovoltaic and wind power systems, in harmony with the available natural resources (Bazen and Brown, 2009; Bardi et al., 2013; Dihrab and Sopian, 2010; Qin et al., 2013).
On the other side, a combined or hybrid energy power system may require more complex management work, considering the increased number of variables affecting the optimization of technical and economical objectives. Especially, in these case the availability of optimization tools supporting decision making and farm management is recommended.
Several scientific studies involving the combination of diverse green energy sources, like photovoltaic and wind power systems, have been conducted by different research groups (Dalwadi et al. 2012; Yang et al. 2008; Borges et al., 2010). In the case of hybrid systems, most studies focused on their technical reliability, size and configuration optimization (Zhou et al. 2010), interaction performance, technical and economical analyses. For instance, a research group (Tina et al. 2006) developed a mathematical model to estimate and predict the performance of wind-solar hybrid systems in the long term, involving two application types known as stand-alone and grid-connected.
More in general, such studies regard researches conducted on combined systems applied to cities (Dalwadi e Mehta, 2012), shopping centres (Elhadidy e Shaahid, 2004), small residences (Bakos e Tsagas, 2003), telecommunications stations on remote islands (Yang et al.2008), greenhouses (Mahmoudi et al 2008) or water desalination plants (Kershman et al. 2005).
Though the growing interest on these subjects, there is a general lack o specific studies on the performance of combined solar and wind power systems in animal farming.
MATERIALS
AND
4 STUDY FARM
4.1 Environmental context and general technical features
To collect and analyse the experimental data, a representative animal farm within the study area was selected. The farm is located in Northern Sardinia (Sassari province) and can be identified on the map using the I.G.M. (Military Geographic Institute) sheet No. 460 section IV (Fig. 4.1).
Fig. 4.1 – Map of Sardinia showing the farm location
This livestock farm has a total surface of 44 ha and consists of three main bodies including the following operating centres:
- a pigpen, with a covered area of 785 m2 - a swine weaning space of 201 m2
- an ovine milking room of 130 m2 - a farming house of 127 m2
- an electrical generator place of 9 m2
- a prefabricated water tank with a capacity of 10 m3 and a surface of 6.25 m2
- a sewage sludge tank made of concrete with a volume of 500 m3.
This farm was selected because of its higher qualitative standard, in terms of technological efficiency and productivity, within the local context.
The area in which the farm is located is part of a geographical and historical region known as Logudoro.
The land is partly flat and partly sloping, with a slope rarely exceeding 10%. The altitude ranges between 350 and 370 m a.s.l.
The geological under-layer consists of acid effusive Cenozoic rock. The soil includes a top a 80 cm deep vegetal layer, and is clay, sub-acid with an average potassium and nitrogen content, and a lack of phosphorous.
Stoniness, expressed as the percentage of particles with a diameter exceeding 5 cm, is around 10%, whereas superficial rockiness is limited and do not hinder mechanical tillage.
4.2 Internal organization and production cycles
The study farm is characterized by a dual productive aptitude: ovine and swine.
Animal breeding system is semi-extensive for sheep that are maintained to pasture and occasionally in shelters, and intensive for pigs that are involved in a closed-cycle fully conducted in the farm.
Livestock includes 90 productive sows and 250 sheep. The animal races are the Hybrid English for swine and the Sardinian for ovine.
Intensive swine breeding is conducted in different settings, each characterized by a specific phase of the reproductive cycle:
- Reproduction area: fecundation, gestation, delivery room, weaning; - Fattening area: including different pig growth levels.
The production cycle is based on a regular 21-day cycle, with synchronized pregnancies. Young sows (gilts) of 5-6 month age are in heat every 21 days, and after being fecundated, become sows which have a 114 day gestation period, corresponding to 3 months, 3 weeks, and 3 days (Fig. 4.2).
The farm normally sells living pigs, with most of the production being represented by traditional 7 kg piglets. Suckling (25-35 kg), young (100 kg) and fat (150 kg) pigs are also sold.
The ovine breeding produces milk, wool and meat (lambs, sheep and rams). The milk is produced over a 227 day milking period, and is totally sold to a cheese producing cooperative. Milking is carried out daily in a milking parlour (Fig. 4.3).
5 ENERGY CONSUMPTION SURVEY
5.1 Detection and analysis of equipment involved in the production cycles
An in-depth survey was conducted to identify all the energy consuming instruments and devices involved in farm operations. For this purpose, a detailed investigation was initially focused on the detection of all activities involved in different farm production cycles, thus surveying all equipment, devices, and plants. An appropriate distinction between ovine and swine production cycles was made from the very first visits to the farm. All direct observations and measures were always corroborated by interviews to the farm manager, so as to gather further information on the actual use of each device within a specific production cycle. For each identified consumption item, power (kW) and time of use (h) for relevant devices were recorded. These data were then used to define the typical daily, monthly and annual consumption.
Farm operations were initially gathered into a macro-group representing the whole farm consumption, and later grouped within a specific production cycle. The macro-group included:
1. Pig-shed ventilation; 2. Pig-shed lighting;
3. Pig-shed air conditioning;
4. Lighting (building, milking room, pig-shed, generator); 5. Milking and milk refrigeration;
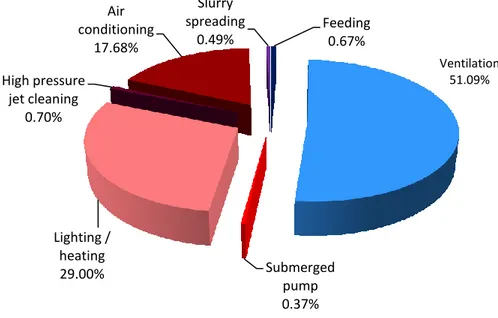
More in detail, for the swine sector, the following energy consumption items were identified: 1. Feeding; 2. Lighting/Heating; 3. Air conditioning; 4. Ventilation; 5. Sludge spreading;
6. High pressure jet cleaning; 7. Submerged pump operation.
For the ovine sector, the operations implied in energy consumption and considered in this study were:
1. Milking;
2. Milk refrigeration;
3. Water heating; 4. Lighting;
5. High pressure jet cleaning; 6. Submerged pump operation.
5.2 Survey of energy consumption levels during the experimental period.
Experimental farm data were collected during the three-year period 2012/2014.
The aim of this survey was to compare different years and different phases of the production cycle within the same year.
Consumption detection was based on a dual approach:
1) measuring the total monthly consumption in the farm using an energy counter installed in the farm;
2) recording the daily consumption associated with each instrument and device involved in the ovine or swine production cycle.
For this purpose, data were recorded on ad-hoc-prepared field sheets that were regularly filled when visiting the farm during the experimental period. A data file was then produced for each device.
The main information included in the device file were: - device type;
- production cycle; - power (kW);
- time of use (h) during the day; - periods of use during the year.
5.3 Data elaboration and analysis
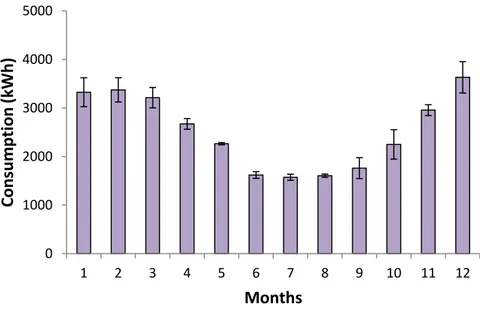
All collected data were submitted to elaboration in order to calculate the average monthly consumption and the level of consumption associated with each production cycle.
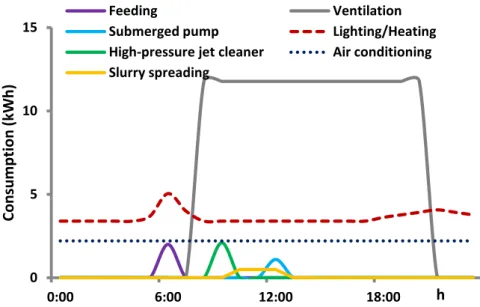
The set of data was then used to elaborate and describe a “typical consumption day”, thus defining a load curve. According to this methodology, the energy need was determined for each energy type and consumption period.
All energy consumption items involved in each production cycle were surveyed, recording the daily time of use and its rate of employment all over the year. As a result a table reporting the annual consumption was produced.
The detected consumption items and their power for each production cycle are reported in Tables 5.1 and 5.2.
After determining consumption levels, elaborations have been focused on the definition of a typical day that took into account the average hourly use and the period of use.
A daily energy load curve could in this way be generated including all devices involved in a specific production cycle (ovine or swine). Daily data were used to generate a diagram with the whole average consumption referred to the month or to the year.
Data were generally processed using Microsoft Excel software version 2007, to calculate means and variability measures (i.e., standard deviation and standard error). In addition, data were subjected to one-way analysis of variance (ANOVA), followed by LSD test for means comparison.
Table 5.1 – Consumption items considered for the ovine production cycle.
OVINE CYCLE
Equipment Power (kW)
Vacuum pump 6.00
Milk refrigerator 3.00
Water heating (Boiler) 1.00
Lighting 0.44
High pressure jet cleaning 1.47
Table 5.2 - Consumption items considered for the swine production cycle. SWINE CYCLE Equipment Power (kW) Feeding 1.00 Lighting/Heating 0.04 / 0.18 Air conditioning 2.20 Ventilation 0.73 Slurry spreading 14.71
High pressure jet cleaning 2.94 / 1.47
6 CONSUMPTION OPTIMIZATION MODEL
6.1 Algorithm development
The mathematical model was developed pursuing the general objective of identifying the opportunities coming from the replacement of actual with alternative electrical devices involved in the farm production cycle, with special regard to the most energy consuming equipment, so as to achieve a significant energy saving. According to similar models used in different industrial contexts, a payback time of 5 years was considered. This period represents the time within which the return on investment is realized.
Although different instruments and devices employed in animal farming have an average life span around 8-10 years, we followed a more prudential approach considering just 5 year, which takes into account the rapid technology advancements and the system of incentives for purchasing more advances instruments that favour more frequent replacements in the farm.
The main objective of the algorithm was to allow an appropriate selection of “cost-effective” alternative equipment that ensures an equivalent functional efficiency in the production cycle, allowing a reduction in energy consumption and, consequently, in costs for the farm. In addition to maximizing the economical benefits, such replacements would also increase the “green impact” of the farm, following the general principles of environmental sustainability.
The study approach to develop the algorithm included a preliminary review of the cutting edge farm consumption models, previously developed and possibly validated in industrial production contexts that could be assimilated to the production cycles of a livestock farm.
Following this review work, we decided to refer to an adaptation of the model developed for manufacturing industry and recently validated on the semiconductor sector (Méndez-Piñero e Colón-Vázquez, 2013). Following model adaptations, the objective function we employed was based on specific variables and constraints, which defined the range of applicability.
In order to generate a reliable model, this study focused on a survey of energy consumption associated with a single farm production cycle. More specifically, the model was developed and validated taking into account the swine production cycle, that in our case represented the preeminent activity in terms of consumption and revenues for the farm.
In order to verify the compliance of the consumption optimization model with the actual farm situation, this study included a market search aimed at surveying the available devices and technological solutions that could replace the actual farm equipment.
For each potential alternative device, the purchasing cost and the technical features (eg. power, consumption, etc.) were recorded.
In summary, the model developed and presented in this study considered the following
variables and general constraints:
Variables:
- Working days/year;
- Daily working hours for each device;
- Cost of energy received from the provider (ENEL);
- Production cycle considered; - Working area in the farm;
- Actual energy (consumption associated with actual equipment) ;
- Recommended energy (consumption associated with alternative equipment) ;
- Investment cost to purchase alternative devices; - Payback time (return on investment time) ;
- Money savings/working day;
- Margin achievable through the replacement of actual with alternative devices.
General constraints:
- The electrical devices involved in the production cycle can be identified with certainty; - Hour consumption (kWh) for each device involved in the production cycle is known; - The daily use (h) for each device is known;
- The time of use of each device during the year is known;
- The cost of energy (€/kWh) received from the provider (i.e., ENEL) is known (including possible variations depending on the level of consumption);
- The payback time is a precondition.
6.2 Equipment involved in the model development
The mathematical model development and application, as previously mentioned, was exclusively based on the swine production cycle that impacts substantially on the farm’s balance sheet. This approach led to narrow the field of study to a production setting that could be appropriately detailed within the algorithm constraints.
As a result of the energy consumption study, because the overall consumption deriving from lighting/heating, ventilation and air-conditioning represented more than 98% of total
consumption associated with the swine production cycle, a further model simplification was applied, including only these major consumption items.
Lighting/Heating
Farm lighting is based on the use of neon light that could be effectively replaced by led light. More specifically, there are 40 neon tubes with a power of 0.04 kW, of which 20 are employed for 5 h/day and the remaining 20 just for 1 h/day.
The selected alternative consists of 40 led tubes with a power of 0.01 kW each, that have the same time (h) of use.
Radiant heating in the delivery room and in the weaning area is obtained through 30 infrared lamps that have a power of 0.175 kW each, and are used 24 h/day. This traditional heating system could be replaced by variable heat lamps whose heat output and consequent consumption are adjusted by a variable voltage controller depending on environmental parameters (i.e., temperature). More in detail, this alternative solution involves the use of 20 lamps with a variable power of 0.100-0.175 kW, associated with a temperature sensor.
Ventilation
The actual ventilation system is based on 16 fan rotors with a 60 cm diameter and a power of 0.74 kW each, that operate 10 h/day all over the year. This on-off system could be improved integrating a variable-frequency drive which allows to achieve 30 % energy savings. The solution proposed includes the introduction of 6 motor drivers.
Air-conditioning
This system, operating in the gestation area, is based on an air conditioner including pad cooling with a power of 2.20 kW that is used 24 h/day. An improvement of this system can be achieved associating an inverter which allows to save around 30% energy.
6.3 Mathematical model development by software
After defining the objective function, the variables associated with the algorithm and all data needed for its application and validation, further development activities were based on the use of two software applications: Lingo 15.0 (Lindo Systems) and Vensim® (Ventana Systems).
6.3.1 Model development with Lingo 15.0
Lingo software is a tool used to build and solve linear, nonlinear, and integer optimization models. A special feature of this software is its ability to solve optimization problems in the presence of constraints represented by equalities and inequalities.
In our case, this tool was employed to solve the problem of energy consumption optimization in the farm, referring to the swine production cycle. Initially, we wrote the program using an appropriate symbolic syntax designed on the mathematical model. At this stage Lingo was interfaced with Microsoft Excel to upload energy consumption data.
The main components of Lingo syntax used were as follows: - Variables, indicated as names ≤ 32 letters
- The objective function, claimed using the words MIN MAX (blue highlighted) followed by the symbol =
- Comments (green highlighted), started with the symbol ! - LINGO generated files with an extension .LG4
After defining the variables, software operators and functions, the model was gradually implemented. These model components included arithmetic and logic operators following specific priority levels, and the mathematical functions needed to formulate the problem to be solved. The model structure involved decisional variables and constraints, so as to obtain a window including the problem solutions, that was the optimum of the objective function. Within the model, the “Sets section” and “Data section” were defined.
6.3.2 Model development with Vensim®
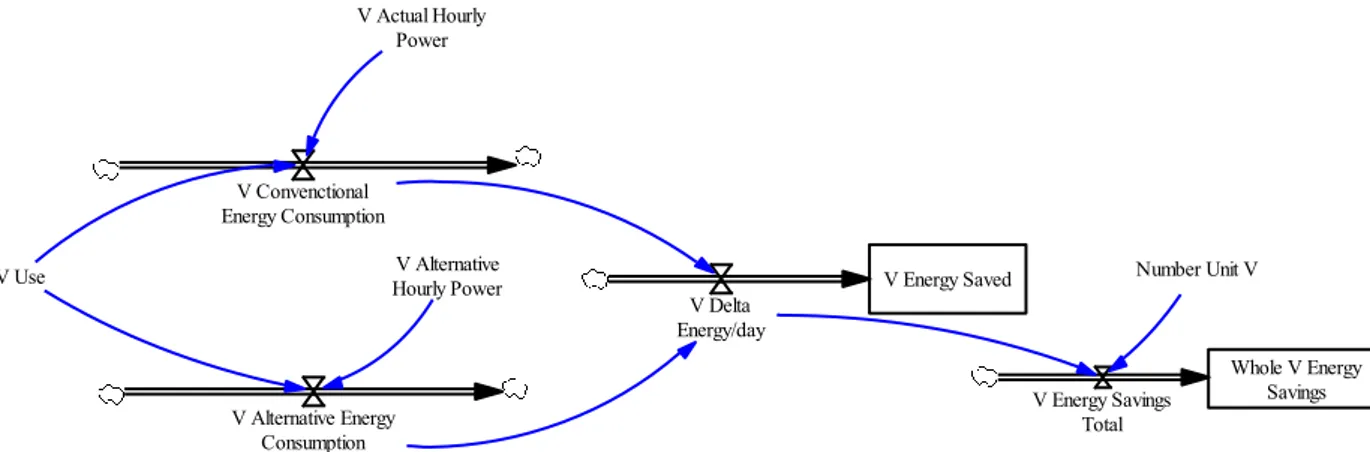
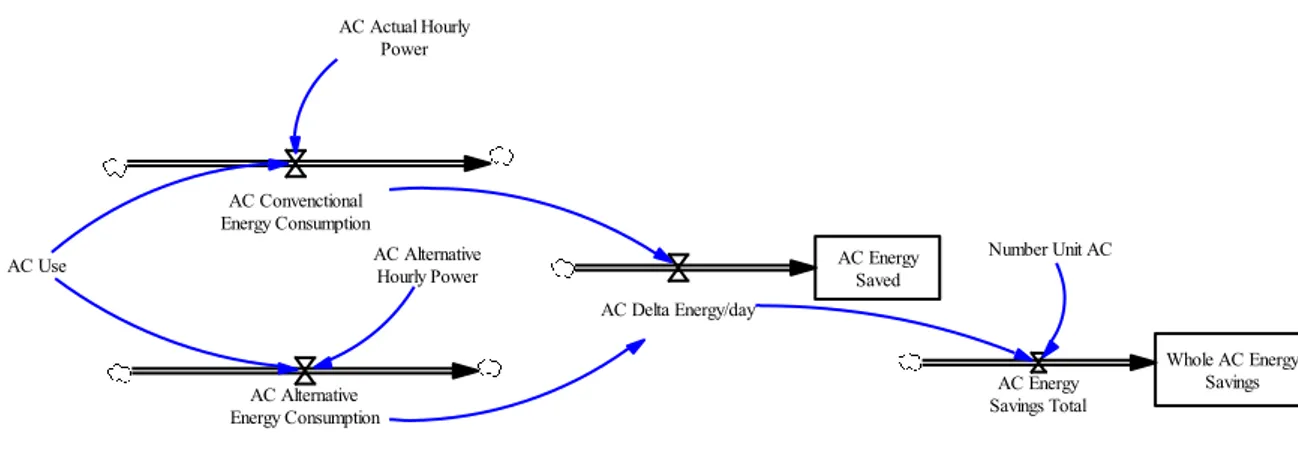
Vensim is a modelling tool that allows to conceptualize, document, simulate, analyze and optimize a dynamic system model, that in our case is represented by the swine production cycle. More specifically, in the present study “stock and flow” diagrams were used to build a simulation model enriched with actual data collected in the study farm during the three year experimental period.
The general principle followed for the model development involved the connection of words by arrows, so as to establish connections and mathematical relationships between system variables (Booth and Stermanb, 2000).
After being developed, the model was used for several simulations, which allowed to represent and study more in depth the swine production cycle ‘behaviour’ in terms of energy consumption, costs, savings and margin achievable through the replacement of actual with alternative and more energy efficient equipment.
The model was built in compliance with software instructions (Vensim, 2007), stepwise as follows:
- basic model building;
- analysis of the model structure using the Analysis tools (Tree Diagrams); - simulation of the first model draft;
- analysis of model behaviour using the dataset Analysis tools (Graphs and Tables); - controller simulations for model refinement;
- output generation for model presentation (Analysis tool output); - generation of graphs and tables.
7 ENVIRONMENTAL DATA SURVEY
7.1 Solar irradiance measure in the study period
The sun is a star in which thermonuclear chain reactions produce a special type of energy called solar radiation. This energy propagates in space symmetrically up to the external side of the Earth’s atmosphere, so that the available radiated power decreases with increasing distance from the sun.
The solar irradiance is the instantaneous power per unit area (kW/m2) received from the Sun in the form of electromagnetic radiation in the wavelength range of the measuring instrument. The part of radiation that reaches the soil is called direct radiation, whereas the remaining part is called diffuse radiation. Another type is the reflected radiation (albedo) that represents the percentage of direct and diffuse radiation that is reflected from the soil or surrounding surfaces.
Irradiance data recorded during the three year-study period 2012/2014 included 34,059 instantaneaus measures repeated every 30 minutes in the experimental survey station of SAR (Regional agro-weather service for Sardinia) and provided by ARPAS (Regional Agency for Environment Protection in Sardinia).
ARPAS is a local agency operating to foster eco-sustainable development in Sardinia and to protect and improve natural and anthropic ecosystem quality. Amongst its duties are included environment monitoring and control, and the technical support to local environmental authorities.
ARPAS collects these data systematically, and ensures their recording, validation, elaboration, and dissemination, thus supporting environment protection. On the other side, SAR is responsible for more applied aspects of environment preservation, and operates through a territorial monitoring network involving 53 survey stations distributed in the regional area (Fig. 7.1). Data continuously measured in these stations are automatically and remotely recorded.
Fig 7.1 - Map of Sardinia with all monitoring stations (Source: ARPAS)
SAR uses several Data Banks developed on Oracle relational database, implemented on Unix and Windows platforms including the following:
- station network (rete stazioni) database, containing data recorded during the last four months with high time detail;
- historical (storica) database, containing data on weather observations from SAR and other bodies like Hydrographic Services, Military Air Force, University of Sassari, Central Office of Agricultural Ecology;
- agro-phenological (agrofenologica) database containing agronomic and phenological information on plant development.
7.2 Wind speed measurement during the experimental period
Wind is a vector quantity that has a magnitude and a direction. Wind speed, or wind velocity, is measured as m/s (International System of Units), however there are other traditional units of measurement:
1) knot (nautical miles per hour) 2) km/h.
The knot is used for the measurement of nautical distances; a nautical mile correspond to 1,852 m. Instead, km/h is used to compare velocity measurements of cars or aircrafts.
A traditional scale of measure for wind speed is the Beaufort scale, introduced in 1805 by Francis Beaufort, admiral of the Royal Navy, and modified at a later time.
Boufort scale consists of a level (force), a descriptive term (eg. calm), and a visual description typical for each level.
Table 7.2 shows a comparison among Beaufort force, m/s and knot.
Wind speed is measured by anemometer and is conventionally reported at a 10 meters height. It is expressed in degrees (Nord= 0°, East=90°, South=180° West=270°) and is normally averaged over a 10-minute time frame.
Table 7.2 - Beaufort scale, knot and m/s (Source: Electric Power India)
7.3 Data elaboration and analysis
Analysis of data from the SAR station nearby the experimental site, allowed to study the solar irradiation intensity using instantaneous data collected every 30 minutes during the three-year survey period (2012-2014). In total 34,059 instantaneous data were processed for the analysis of irradiation.
Wind speed during the same period was instead studied elaborating instantaneous data recorded in the same SAR station by anemometer with a 10 minute frequency. In total 148,681 instantaneous data were employed in wind velocity analysis.
Alla data were elaborated with Microsoft Excel and mean values (± S.E.) are presented in the result section. Data were submitted to one-way analysis of variance (ANOVA) followed by LSD test for post-hoc comparison of means.
Fig. 7.3 – Survey station of SAR (Source: SAR)
Table. 7.3 – List of sensors available in the survey station
Variable Sensor height measurement Unit of
Minimal available interval
Wind speed 2 m m/s 10 min
Wind speed 10 m m/s 10 min
Wind
direction 10 m ° 10 min
Solar
Irradiation 2 m W/m2, MJ/ m2 30 min
8 ENERGY PRODUCTION BY THE PHOTOVOLTAIC SYSTEM
8.1 Photovoltaic system
The study farm hosts a photovoltaic system implemented leveraging the regional incentive program supporting the use of green energy in agriculture and animal farming. More specifically, the farm received co-funding for its project after applying to a call within the context of Measure 121 “Modernisation of agricultural holdings” (Fig. 8.1).
Fig. 8.1 – Representation of institutions involved in Measure 121.
The purpose of this measure was ‘to support farm investment and to assist agricultural
holdings to improve their economic performance through better use of the production factors including the introduction of new technologies and innovation, targeting quality, organic products and on farm diversification, including non-food sectors and energy crops as well as improving the environmental, occupational safety, hygiene and animal welfare status of agricultural holdings. Furthermore, this measure is also intended to facilitate investments that are made in order to comply with newly introduced Community standards’.
Leveraging this regional support, a rooftop integrated photovoltaic system with a power of 19.98 kW was installed in the farm. Planning and building activities were conducted before the experimental period 2012-2014, and involved several project phases and authorization procedures. Main planning and technical features of the rooftop are presented in Fig. 8.2 and 8.3.
Fig. 8.3 – Perspective drawing of the photovoltaic rooftop
This grid-connected photovoltaic power system (19.98 kW), covering a 150.54 m2 area, consists of 93 solar panels (Renergies- REN 220/ P 215), 6 inverters (SMA SUNNY BOY 3300 TL HC-IT), a power conditioning unit and a grid connection equipment (Fig. 8.4).
On the basis of a bidirectional interaction, the grid-connected photovoltaic system supplies the excess power, beyond consumption in the farm by the connected load, to the utility grid. Such excess power is sold to the energy provider (ENEL) according to a special tariff (Second Energy Account for Photovoltaic Ministerial decree DM 19/02/07).
Fig. 8.4 – Rooftop photovoltaic system
8.2 Energy production during the study period
Photovoltaic energy production during the three-year experimental period (2012-2014) was measured monthly by a dedicated energy counter supplied by the energy service provider (GSE).
GSE is in charge of monitoring and recording the energy (kWh) produced by the photovoltaic system, distinguishing between the energy used for consumption and the energy excess sold to the provider. In other words, a specific “energy account” (Conto energia) with energy “income and expenses” is maintained. This energy exchange concept is in line with the over time varying energy need in the farm and the non-constant environmental conditions that determine a variable photovoltaic energy production throughout the year.