metals
ArticleFlat-Top Cylinder Indenter Examination of Duplex
Stainless Steel 2205 after Different Heat Treatments
Giuliano Angella1, Alessandra Fava2, Roberto Montanari2,*, Maria Richetta2and Alessandra Varone2
1 Institute of Condensed Matter Chemistry and Energy Technologies (ICMATE), National Research Council of Italy (CNR), 20125 Milan, Italy; [email protected]
2 Department of Industrial Engineering, University of Rome “Tor Vergata”, Via del Politecnico 1, 0113 Rome, Italy; [email protected] (A.F.); [email protected] (M.R.); [email protected] (A.V.) * Correspondence: [email protected]; Tel.: +39-06-7259-7182
Academic Editor: Rebecca L. Higginson
Received: 5 April 2017; Accepted: 12 May 2017; Published: 17 May 2017
Abstract:The duplex stainless steel 2205 was heat treated at 750◦C, 850◦C, and 900◦C for increasing durations of up to 10 h. The samples were investigated through light microscopy (LM), transmission electron microscopy (TEM), and X-ray diffraction (XRD) to characterize the volume fraction and morphology of the precipitated secondary phases. The samples were then tested via flat-top cylinder indenter for mechanical characterization (FIMEC) testing to determine the yield stresses that were found to be significantly affected by the different heat treatments. The yield stress evolution with heat treatments resulted in being correlated to both the relative volumes of the secondary phases and the morphology of the σ phase. The FIMEC test proved to be capable of detecting the effects of small amounts of secondary phases on yield stress in DSS 2205 and seems to be a promising technique for industrial applications.
Keywords: duplex stainless steel 2205; FIMEC indentation test; secondary intermetallic phases; heat treatments
1. Introduction
Duplex stainless steels (DSS) are the major competitors of austenitic stainless steels in many chemical and petrochemical industrial applications, thanks to their good mechanical properties and corrosion resistance [1]. Such characteristics are due to the biphasic structure with approximately equal amounts of austenite γ and ferrite α phases. Some of these applications depend on the capability to realize welded joints. However, phase transformations occur during welding in the molten zone (MZ) and in the heat affected zone (HAZ) with detrimental effects on the physical and mechanical properties of DSS [2], in particular the precipitation of secondary phases (SPs), like σ and χ, cause a serious reduction in toughness [3–12]. This generally derives from incorrect process parameters during either welding or post-welding heat treatments.
σphase precipitation has been reported to be particularly detrimental for DSS [13]. The σ phase is a hard, brittle, intermetallic phase rich in Cr (29–34%), Fe (50–60%), and Mo (3–9%), and poor in Ni (3–5%) and W (0–7%); it forms from 600◦C to 1000◦C, with the most rapid kinetics around 850◦C [14]. Owing to its high Cr and Mo content, σ precipitation depletes the surrounding matrix of these elements, causing lower corrosion resistance. During isothermal treatments the σ phase often forms and grows at α/γ interfaces through a heterogeneous nucleation process, and the linking of σparticles observed for temperatures below 850◦C assists the nucleation of long cracks, leading to brittle fractures.
Metals 2017, 7, 178 2 of 13
Different mechanisms of σ precipitation have been observed: (1) eutectoid ferrite decomposition, α →γ* + σ; (2) continuous or discontinuous precipitation from ferrite, α →α* + σ; formation from austenite, γ →γ* + σ, where γ* and α* are austenite and ferrite depleted of Cr and Mo. Crystallographic characteristics of the α/γ interface affect the tendency of σ precipitation and recent results of Haghdadi et al. [15] showed that the interfaces with a rational orientation relationship (considering all five crystallographic parameters) exhibit the lowest σ precipitation propensity, owing to the high nucleation barrier energy and low diffusion rate.
Usually σ and χ phases coexist in the DSS microstructure. The χ phase is an intermetallic phase enriched with Mo (9–22%) and Cr (20–28%) that forms at 700–750◦C, even if in smaller amounts than the σ phase [16].
Cr carbides and nitrides also form from the eutectoid decomposition of ferrite nucleating at α/γ boundaries. The early growth stages are characterized by the bowing of the interface boundary away from the nuclei, causing the α/γ migration into the ferritic grain. Therefore, carbides also appear inside the γ grains rather than at the α/γ interfaces and after prolonged high-temperature exposure they show a lamellar structure [6,17].
In order to determine the proper solution temperatures and cooling rates necessary to achieve good toughness properties, hard work has been devoted to modelling σ precipitation in DSS in isothermal and unisothermal conditions [18–23].
In the industrial practice bending tests are commonly used to assess the quality of welded joints to prevent the rupture of components in service. However these tests do not always help reveal an inadequate structure in the whole welding bead, since the maximum stress is mainly concentrated in the MZ. The flat-top cylinder indenter for mechanical characterization (FIMEC) test [24–27] provides the evaluation of the mechanical properties at the local scale. In the case of welded joints made through conventional methods, like TIG, FIMEC can directly investigate the specific characteristics of MZ, HAZ, and the base metal [28]. Therefore, the present work was carried out to assess the capability of the FIMEC test to reveal possible sources of toughness loss in DSS steels after heat treatments.
The experiments were conducted on samples of DSS 2205 where SP precipitation was induced through heat treatments at 750◦C, 850 ◦C, and 900◦C for an increasing duration of up to 10 h. The microstructure evolutions were then studied through light microscopy (LM), X-ray diffraction (XRD), and transmission electron microscopy (TEM).
2. The FIMEC Test
FIMEC is an instrumented indentation test using a cylindrical punch with a diameter of 1 mm. Unlike other indentation tests with different punch geometries (pyramid, sphere, cone etc.), the contact area between the punch and the material surface remains constant as the penetration depth increases. During punching the applied load (L) and the penetration depth (h) are measured and pressure (p) vs. penetration depth (h) curves are then obtained. As shown in Figure1for a martensitic steel [27], after an initial elastic stage (up to pL) three plastic stages are observed. The first one after the elastic range ends at pY, is almost linear and shows an imprint with sharp edges. For p > pYthe curve slope strongly decreases (second stage) while the material starts to protrude around the imprint. The third stage, at higher p, shows a trend with an almost constant slope.
Metals 2017, 7, 178 3 of 13
Metals 2017, 7, 178 3 of 13
Figure 1. Flat‐top cylinder indenter for mechanical characterization (FIMEC) pressure‐penetration curve of a martensitic steel. Under a standard penetration rate of 0.1 mm/min the following correlation is used to determine the yield stress qY:
3
Y Yp
q
, (1) Equation (1) has been validated for several metallic materials (steels, copper alloys, superalloys, aluminum alloys, titanium alloys, metal matrix composites, etc.). The relative difference between the yield stress Y from standard tensile tests and qY from FIMEC is given by:Y Y Y
σ
)
(σ
Δ
q
, (2) has been found not to exceed 9%, which is similar to the yield data scattering (~7%) in tensile tests made on the same material. FIMEC allows the examination at the local scale, in a non‐destructive way, of mechanical parts of complex geometry, including MZ and HAZ in welded joints [27]. However, unlike micro‐ and nano‐indentation tests, the imprints are large enough to involve thousands of grains, so that the FIMEC measurements are representative of the behavior of the bulk material. Furthermore, the surface conditions of the material (roughness, chemical segregation, etc.) are not so critical for the results. However, the FIMEC technique has failed in testing materials with thin coatings or surface layers (e.g. kolsterized stainless steels [29–31], nitrided and nitrocarburized steels [32,33]), where the penetration depth is larger than the 100 μm thicknesses of the surface layers. Failure has also been reported in testing welding seams made through such high energy sources as laser and electron beam, where the diameter of the imprint is larger than the MZ widths [34]. The tests can also be carried out in situ, since a portable FIMEC apparatus has been developed, and can be used to test in‐service mechanical parts (plates, pipes etc.). 3. Material and Experimental Procedure The examined DSS 2205 was produced by Sandmeyer Steel Co (Philadelphia, PA, USA) with the following nominal chemical composition: C 0.03, Cr 22.75, Ni 5.04, Mo 3.19, Si 0.56, Mn 1.46, P 0.025, S 0.002, N 0.16, Fe to balance (wt %). It was supplied in the form of plates, after solution‐annealing and quenching. Samples (5 mm × 10 mm × 25 mm) were cut from the plates for testing. In order toFigure 1. Flat-top cylinder indenter for mechanical characterization (FIMEC) pressure-penetration curve of a martensitic steel.
Under a standard penetration rate of 0.1 mm/min the following correlation is used to determine the yield stress qY:
qY= pY
3 , (1)
Equation (1) has been validated for several metallic materials (steels, copper alloys, superalloys, aluminum alloys, titanium alloys, metal matrix composites, etc.). The relative difference∆ between the yield stress σYfrom standard tensile tests and qYfrom FIMEC is given by:
∆= (σY−qY)
σY (2)
∆ has been found not to exceed 9%, which is similar to the yield data scattering (~7%) in tensile tests made on the same material.
FIMEC allows the examination at the local scale, in a non-destructive way, of mechanical parts of complex geometry, including MZ and HAZ in welded joints [27]. However, unlike micro-and nano-indentation tests, the imprints are large enough to involve thousmicro-ands of grains, so that the FIMEC measurements are representative of the behavior of the bulk material. Furthermore, the surface conditions of the material (roughness, chemical segregation, etc.) are not so critical for the results. However, the FIMEC technique has failed in testing materials with thin coatings or surface layers (e.g., kolsterized stainless steels [29–31], nitrided and nitrocarburized steels [32,33]), where the penetration depth is larger than the 100 µm thicknesses of the surface layers. Failure has also been reported in testing welding seams made through such high energy sources as laser and electron beam, where the diameter of the imprint is larger than the MZ widths [34]. The tests can also be carried out in situ, since a portable FIMEC apparatus has been developed, and can be used to test in-service mechanical parts (plates, pipes etc.).
3. Material and Experimental Procedure
The examined DSS 2205 was produced by Sandmeyer Steel Co (Philadelphia, PA, USA) with the following nominal chemical composition: C 0.03, Cr 22.75, Ni 5.04, Mo 3.19, Si 0.56, Mn 1.46, P 0.025, S 0.002, N 0.16, Fe to balance (wt %). It was supplied in the form of plates, after solution-annealing and quenching. Samples (5 mm×10 mm×25 mm) were cut from the plates for testing. In order to
Metals 2017, 7, 178 4 of 13
induce the precipitation of SPs the steel was heat-treated at 750◦C, 850◦C, and 900◦C for increasing durations up to 10 h.
The surfaces of the samples were mechanically polished by using SiC paper up to 4000-grit, then finished with diamond paste and later etched by means of Beraha reagent (200 mL HCl + 1000 mL H2O + 1 g K2S2O5). For each sample, 30 micrographs were recorded on different fields at the same magnification (400×) and submitted to image analysis through the software LUCIA (Version 4.51, Za Drahou, CZ, Czech Republic, 1991–2000) to detect the SPs by means of relative area measurements. LM gives the total amount of SPs, but no information about the characteristics and the amount of each phase. Thus, X-ray diffraction (XRD) analysis was performed by using a Philips PW 1729 diffractometer with Mo-Kα radiation (λ = 0.07093 nm) (Philips, Eindhoven, The Netherlands). The spectra were recorded through 2θ step-scanning from 5◦to 55◦, in steps of 0.05◦and a counting time of 5 s per step. TEM observations through a JEM CX FII by Jeol (Tokyo, Japan) and a H600 by Hitachi (Tokyo, Japan) were carried out to obtain details on each phase. Twin-jet electro-polishing in a solution of 90% methanol and 10% perchloric acid (12 V, 100 mA) was used to prepare thin foils.
Vickers hardness tests (Micro-hardness tester, Shimadzu Corporation, Kyoto, Japan) were carried out on the samples after different heat treatments. In order to assess the specific hardness of the phases and their possible evolution microhardness Vickers tests were made on ferrite, austenite, and σ phases. 4. Results
4.1. Microstructure Characterization
The microstructure of as-supplied 2205 steel exhibits elongated austenitic grains in a ferritic matrix with a mean grain size of 25 and 65 µm for α and γ phases, respectively. LM observations did not show SPs in the solution-annealed material consisting of 51% of austenite and 49% of ferrite.
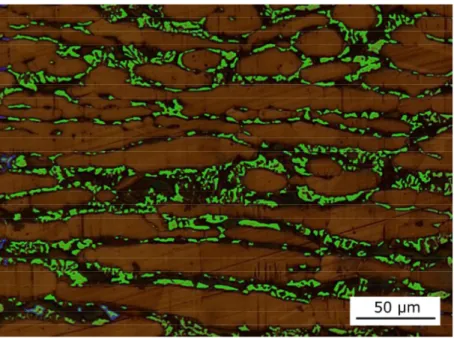
An example of LM image analysis of the heat-treated material is reported in Figure2where SPs are highlighted in green. For each heat treatment the average volume fraction of the total SPs (σ + χ + carbides + nitrides) was calculated through relative area measurements and the results are shown in Table1. Data are the average values of 30 measurements; it can be observed that standard deviations (Sdv) are higher for smaller amounts of SPs. Table1also reports the volume fractions and mean grain sizes of ferrite and austenite.
Metals 2017, 7, 178 4 of 13 induce the precipitation of SPs the steel was heat‐treated at 750 °C, 850 °C, and 900 °C for increasing durations up to 10 h. The surfaces of the samples were mechanically polished by using SiC paper up to 4000‐grit, then finished with diamond paste and later etched by means of Beraha reagent (200 mL HCl + 1000 mL H2O + 1 g K2S2O5). For each sample, 30 micrographs were recorded on different fields at the same magnification (400×) and submitted to image analysis through the software LUCIA (Version 4.51, Za Drahou, CZ, Czech Republic, 1991–2000) to detect the SPs by means of relative area measurements. LM gives the total amount of SPs, but no information about the characteristics and the amount of each phase. Thus, X‐ray diffraction (XRD) analysis was performed by using a Philips PW 1729 diffractometer with Mo‐Kα radiation (λ = 0.07093 nm) (Philips, Eindhoven, The Netherlands). The spectra were recorded through 2θ step‐scanning from 5° to 55°, in steps of 0.05° and a counting time of 5 s per step. TEM observations through a JEM CX FII by Jeol (Tokyo, Japan) and a H600 by Hitachi (Tokyo, Japan) were carried out to obtain details on each phase. Twin‐jet electro‐polishing in a solution of 90% methanol and 10% perchloric acid (12 V, 100 mA) was used to prepare thin foils.
Vickers hardness tests (Micro‐hardness tester, Shimadzu Corporation, Kyoto, Japan) were carried out on the samples after different heat treatments. In order to assess the specific hardness of the phases and their possible evolution microhardness Vickers tests were made on ferrite, austenite, and σ phases.
4. Results
4.1. Microstructure Characterization
The microstructure of as‐supplied 2205 steel exhibits elongated austenitic grains in a ferritic matrix with a mean grain size of 25 and 65 μm for α and γ phases, respectively. LM observations did not show SPs in the solution‐annealed material consisting of 51% of austenite and 49% of ferrite.
An example of LM image analysis of the heat‐treated material is reported in Figure 2 where SPs are highlighted in green. For each heat treatment the average volume fraction of the total SPs (σ + χ + carbides + nitrides) was calculated through relative area measurements and the results are shown in Table 1. Data are the average values of 30 measurements; it can be observed that standard deviations (Sdv) are higher for smaller amounts of SPs. Table 1 also reports the volume fractions and mean grain sizes of ferrite and austenite.
Figure 2. Duplex Stainless Steel DSS 2205 after heat treatment at 850 °C for 8 h: secondary phases (SPs) are highlighted in green.
Figure 2.Duplex Stainless Steel DSS 2205 after heat treatment at 850◦C for 8 h: secondary phases (SPs) are highlighted in green.
Metals 2017, 7, 178 5 of 13
Table 1. Duplex Stainless Steel DSS 2205: volume fractions of secondary phases (SPs), ferrite, and austenite after different heat treatments. The mean grain size of ferrite and austenite are reported.
T (◦C) 750 850 900 t (h) 1 2 5 8 10 1 2 5 8 10 1 2 5 8 10 αgrain size (µm) 23 20 10 10 8 15 10 8 5 - 20 17 8 5 4 γgrain size (µm) 70 75 82 85 90 75 80 88 93 99 72 76 85 87 92 α(%) 45.0 33.0 22.9 20.5 17.4 34.0 26.0 13.2 4.4 0 38.0 30.0 21.0 12.0 4.0 γ(%) 53.9 64.2 66.9 66.9 66.1 56.1 60.0 67.6 73.4 74.4 60.6 67.0 67.8 72.0 74.1 SPs (%) 1.1 2.8 10.2 12.6 16.5 9.9 14.0 19.2 22.2 25.6 1.4 3.0 11.2 16.0 21.9 Sdv 0.3 0.4 0.9 1.0 1.2 0.9 1.2 1.3 1.6 1.7 0.2 0.4 0.9 1.2 1.4
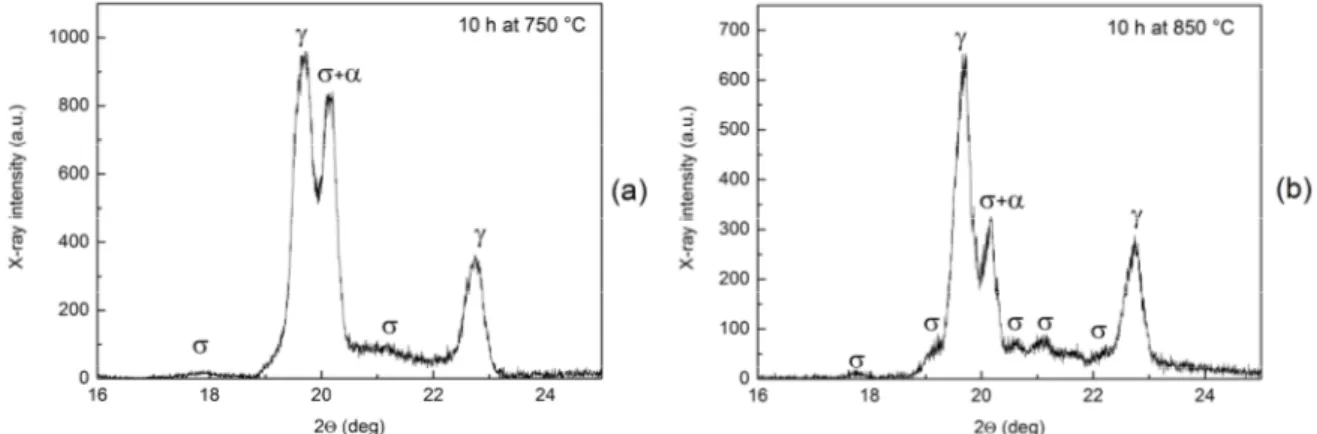
Figure3shows the XRD patterns of samples heat treated at 750◦C (a) and 850◦C (b) for 10 h: in both cases only the σ phase reflections are clearly identified, while the peaks of χ and other SPs are not visible, though a broad amount of literature reports the precipitation of these phases at 750◦C. The results suggested that the volume fractions of these SPs could be so low as to produce non-detectable weak peaks.
Metals 2017, 7, 178 5 of 13
Table 1. Duplex Stainless Steel DSS 2205: volume fractions of secondary phases (SPs), ferrite, and austenite after different heat treatments. The mean grain size of ferrite and austenite are reported. T (°C) 750 850 900 t (h) 1 2 5 8 10 1 2 5 8 10 1 2 5 8 10 α grain size (μm) 23 20 10 10 8 15 10 8 5 ‐ 20 17 8 5 4 γ grain size (μm) 70 75 82 85 90 75 80 88 93 99 72 76 85 87 92 α (%) 45.0 33.0 22.9 20.5 17.4 34.0 26.0 13.2 4.4 0 38.0 30.0 21.0 12.0 4.0 γ (%) 53.9 64.2 66.9 66.9 66.1 56.1 60.0 67.6 73.4 74.4 60.6 67.0 67.8 72.0 74.1 SPs (%) 1.1 2.8 10.2 12.6 16.5 9.9 14.0 19.2 22.2 25.6 1.4 3.0 11.2 16.0 21.9 Sdv 0.3 0.4 0.9 1.0 1.2 0.9 1.2 1.3 1.6 1.7 0.2 0.4 0.9 1.2 1.4 Figure 3 shows the XRD patterns of samples heat treated at 750 °C (a) and 850 °C (b) for 10 h: in both cases only the σ phase reflections are clearly identified, while the peaks of χ and other SPs are not visible, though a broad amount of literature reports the precipitation of these phases at 750 °C. The results suggested that the volume fractions of these SPs could be so low as to produce non‐ detectable weak peaks. Figure 3. XRD patterns of samples heat treated at 750 °C (a) and 850 °C (b) for 10 h. Thus, for the purpose of gathering more information about other possible SPs formed after each treatment, the samples were investigated through TEM. According to the XRD results, the σ phase was observed in all the examined samples, with different morphology depending on the specific heat treatment (Figure 4). In DSS, the annealing temperature affects the σ phase formation in two ways [35–39]: on the one hand, a higher temperature causes an increase of ferrite grain size, reducing the potential number of nucleation sites which, in turn, reduces the tendency of σ phase formation; on the other hand, the percentage of ferrite increases with temperature and this promotes the formation of the σ phase during annealing. In the samples treated at 750 °C the σ phase forms at α/γ interfaces through a heterogeneous nucleation process (Figure 4a) and grows in a ʺcoral‐likeʺ morphology (Figure 4b). In treatments at higher temperature (850 °C and 900 °C), and for increasing times of exposure, the σ phase becomes more compact and the particles join together leading to the “oil spot” morphology (see Figure 4c,d).
On the basis of our TEM observations the
σ phase nucleates at α/γ interfaces. During growth, σ phase depletes α ferrite in Cr, and progressively consumes the α phase, causing the observed α/γ interface migration into ferrite. Thus, the prevalent mechanism seems to be the eutectoid ferrite decomposition, α→ γ* + σ, where γ* is an austenite with lower Cr and Mo contents than in the non‐transformed austenite.
Figure 3.XRD patterns of samples heat treated at 750◦C (a) and 850◦C (b) for 10 h.
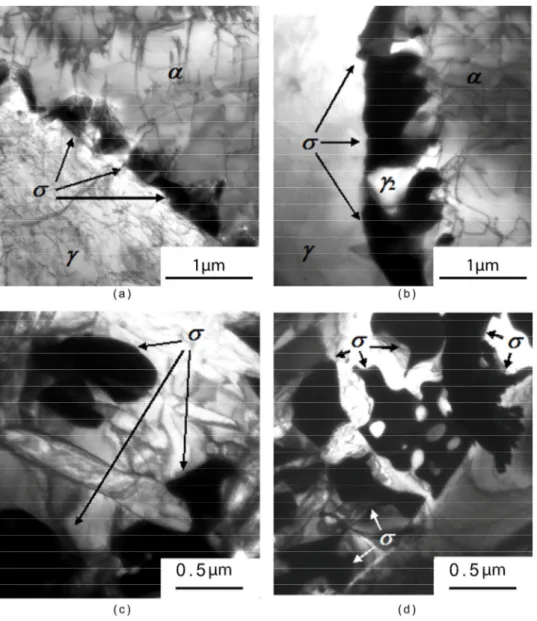
Thus, for the purpose of gathering more information about other possible SPs formed after each treatment, the samples were investigated through TEM. According to the XRD results, the σ phase was observed in all the examined samples, with different morphology depending on the specific heat treatment (Figure4). In DSS, the annealing temperature affects the σ phase formation in two ways [35–39]: on the one hand, a higher temperature causes an increase of ferrite grain size, reducing the potential number of nucleation sites which, in turn, reduces the tendency of σ phase formation; on the other hand, the percentage of ferrite increases with temperature and this promotes the formation of the σ phase during annealing. In the samples treated at 750◦C the σ phase forms at α/γ interfaces through a heterogeneous nucleation process (Figure4a) and grows in a “coral-like” morphology (Figure4b). In treatments at higher temperature (850 ◦C and 900◦C), and for increasing times of exposure, the σ phase becomes more compact and the particles join together leading to the “oil spot” morphology (see Figure4c,d). On the basis of our TEM observations the σ phase nucleates at α/γ interfaces. During growth, σ phase depletes α ferrite in Cr, and progressively consumes the α phase, causing the observed α/γ interface migration into ferrite. Thus, the prevalent mechanism seems to be the eutectoid ferrite decomposition, α→γ* + σ, where γ* is an austenite with lower Cr and Mo contents than in the non-transformed austenite.
Metals 2017, 7, 178 6 of 13 Metals 2017, 7, 178 6 of 13
Figure 4. DSS 2205 steel heat treated (a) one hour and (b) 10 h at 750 °C, and (c,d) 10 h at 850 °C. The χ phase was only detected in the samples heated at 750 °C (Figure 5). This phase is difficult to be found due to its low concentration, and its morphological and size similarity to the σ phase. It nucleates at α/γ and α/α boundaries and selected area diffraction (SAD) patterns revealed a ʺcube‐ on‐cubeʺ crystallographic relationship between χ and α phases. After one hour at 750 °C the χ particles have a round shape and size of about 500 nm. Figure 5a shows a χ particle nucleated at a α/α boundary; the superimposition of diffraction patterns with pole axes [111] from the χ precipitate and the dark left‐side α grain with the “cube‐on‐cube” crystallographic relationship is reported in the inset. In fact, consistently with the diffraction pattern, the lattice parameter of the χ cubic cell is 0.892 nm, about three times the ferrite lattice parameter 0.288 nm measured in a similar DSS [39]. As shown in Figure 5b, for longer soaking times the χ precipitates exhibit a more elongated shape and the size increases over 1 μm after 10 h.
Figure 4.DSS 2205 steel heat treated (a) one hour and (b) 10 h at 750◦C, and (c,d) 10 h at 850◦C.
The χ phase was only detected in the samples heated at 750◦C (Figure5). This phase is difficult to be found due to its low concentration, and its morphological and size similarity to the σ phase. It nucleates at α/γ and α/α boundaries and selected area diffraction (SAD) patterns revealed a “cube-on-cube” crystallographic relationship between χ and α phases. After one hour at 750◦C the χ particles have a round shape and size of about 500 nm. Figure5a shows a χ particle nucleated at a α/α boundary; the superimposition of diffraction patterns with pole axes [111] from the χ precipitate and the dark left-side α grain with the “cube-on-cube” crystallographic relationship is reported in the inset. In fact, consistently with the diffraction pattern, the lattice parameter of the χ cubic cell is 0.892 nm, about three times the ferrite lattice parameter 0.288 nm measured in a similar DSS [39]. As shown in Figure5b, for longer soaking times the χ precipitates exhibit a more elongated shape and the size increases over 1 µm after 10 h.
Metals 2017, 7, 178 7 of 13 Metals 2017, 7, 178 7 of 13
Figure 5. The χ phase is observed in DSS 2205 steel HEA‐treated for one hour at 750 °C (a); and after 10 h at 750 °C, the amount of χ phase has increased (b). Few small nitrides and M23C6 carbides were also observed in all of the examined samples with sizes in the range 0.15–0.3 μm, indicating that the volume fractions of these SPs were negligible if compared to the σ phase, which was consistent to the XRD results where only σ peaks were revealed. 4.2. FIMEC Results
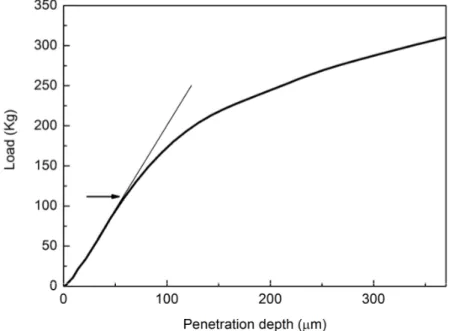
Samples of DSS 2205 in as‐received condition and after different heat treatments were tested through FIMEC and from the load‐penetration curves the yield stress qY was determined according to the procedure described in Section 2. Figure 6 shows the load‐penetration curve of the as‐received material, where the load 110 Kg corresponds to the end of the first plastic stage (indicated by the arrow). With a punch contact area A = 0.785 mm2, pY was in 1400 MPa, so according to Equation 1 the yield stress qy resulted in 467 MPa.
Figure 6. Load‐penetration curve of DSS in as‐received condition.
Figure 5.The χ phase is observed in DSS 2205 steel HEA-treated for one hour at 750◦C (a); and after 10 h at 750◦C, the amount of χ phase has increased (b).
Few small nitrides and M23C6carbides were also observed in all of the examined samples with sizes in the range 0.15–0.3 µm, indicating that the volume fractions of these SPs were negligible if compared to the σ phase, which was consistent to the XRD results where only σ peaks were revealed. 4.2. FIMEC Results
Samples of DSS 2205 in as-received condition and after different heat treatments were tested through FIMEC and from the load-penetration curves the yield stress qYwas determined according to the procedure described in Section2. Figure6shows the load-penetration curve of the as-received material, where the load 110 Kg corresponds to the end of the first plastic stage (indicated by the arrow). With a punch contact area A = 0.785 mm2, pYwas in 1400 MPa, so according to Equation (1) the yield stress qyresulted in 467 MPa.
Metals 2017, 7, 178 7 of 13
Figure 5. The χ phase is observed in DSS 2205 steel HEA‐treated for one hour at 750 °C (a); and after 10 h at 750 °C, the amount of χ phase has increased (b). Few small nitrides and M23C6 carbides were also observed in all of the examined samples with sizes in the range 0.15–0.3 μm, indicating that the volume fractions of these SPs were negligible if compared to the σ phase, which was consistent to the XRD results where only σ peaks were revealed. 4.2. FIMEC Results
Samples of DSS 2205 in as‐received condition and after different heat treatments were tested through FIMEC and from the load‐penetration curves the yield stress qY was determined according to the procedure described in Section 2. Figure 6 shows the load‐penetration curve of the as‐received material, where the load 110 Kg corresponds to the end of the first plastic stage (indicated by the arrow). With a punch contact area A = 0.785 mm2, pY was in 1400 MPa, so according to Equation 1 the yield stress qy resulted in 467 MPa.
Figure 6. Load‐penetration curve of DSS in as‐received condition. Figure 6.Load-penetration curve of DSS in as-received condition.
Metals 2017, 7, 178 8 of 13
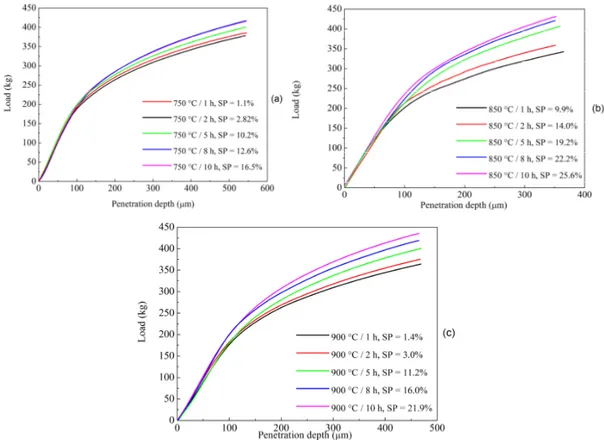
In Figure7five FIMEC curves are plotted for the treatment temperatures 750◦C (a), 850◦C (b), and 900◦C (c), corresponding to five different exposure duration (1, 2, 5, 8, and 10 h). For the sake of clarity, the volume fractions of SPs measured through image analysis of LM micrographs (see Table1) are also reported. It can be observed that, besides the experimental curves for 750◦C/8 h and 750◦C/10 h that partly overlap in Figure7a, the FIMEC curves progressively move upwards at a given temperature for an increasing duration, namely, for higher amounts of SPs.
Metals 2017, 7, 178 8 of 13
In Figure 7 five FIMEC curves are plotted for the treatment temperatures 750 °C (a), 850 °C (b), and 900 °C (c), corresponding to five different exposure duration (1, 2, 5, 8, and 10 h). For the sake of clarity, the volume fractions of SPs measured through image analysis of LM micrographs (see Table 1) are also reported. It can be observed that, besides the experimental curves for 750 °C/8 h and 750 °C/10 h that partly overlap in Figure 7a, the FIMEC curves progressively move upwards at a given temperature for an increasing duration, namely, for higher amounts of SPs.
Figure 7. Load‐penetration curves of samples heat treated for different duration at 750 °C (a), 850 °C
(b), and 900 °C (c). The corresponding volume fractions of secondary phases (SP) are reported in the figures.
In Table 2 the qy values found for all of the heat treatment conditions are reported and compared
to the hardness measurements. For volume fractions of SPs up to ~3% hardness changes are low, within the experimental error, while significant variations occur for amounts of the order of 10% and above. Therefore, as pointed out by other investigators [7,16], hardness measurements are not so sensitive to detect low SP volume fractions whereas, in the case of FIMEC, a SP volume fraction change of 1% gives rise to detectable qy variations. Micro‐hardness tests carried out in the single
phases did not show relevant changes following heat treatments: ferrite (276 HV), austenite (245 HV), and σ phase (800 HV). Table 2. Comparison of qy from FIMEC and hardness values in samples after different heat treatments. The corresponding SP volume fractions are reported. T (°C) 750 850 900 t (h) 1 2 5 8 10 1 2 5 8 10 1 2 5 8 10 qy (MPa) 535 567 669 692 725 635 681 764 828 815 492 521 624 696 730 HV 253 262 279 301 320 278 310 329 340 352 256 264 285 310 340 SPs (%) 1.1 2.82 10.2 12.6 16.5 9.9 14.0 19.2 22.2 25.6 1.4 3.0 11.2 16.0 21.9
Figure 7.Load-penetration curves of samples heat treated for different duration at 750◦C (a), 850◦C (b), and 900◦C (c). The corresponding volume fractions of secondary phases (SP) are reported in the figures.
In Table2the qyvalues found for all of the heat treatment conditions are reported and compared to the hardness measurements. For volume fractions of SPs up to ~3% hardness changes are low, within the experimental error, while significant variations occur for amounts of the order of 10% and above. Therefore, as pointed out by other investigators [7,16], hardness measurements are not so sensitive to detect low SP volume fractions whereas, in the case of FIMEC, a SP volume fraction change of 1% gives rise to detectable qyvariations. Micro-hardness tests carried out in the single phases did not show relevant changes following heat treatments: ferrite (276 HV), austenite (245 HV), and σ phase (800 HV).
Table 2.Comparison of qyfrom FIMEC and hardness values in samples after different heat treatments. The corresponding SP volume fractions are reported.
T (◦C) 750 850 900
t (h) 1 2 5 8 10 1 2 5 8 10 1 2 5 8 10
qy(MPa) 535 567 669 692 725 635 681 764 828 815 492 521 624 696 730
HV 253 262 279 301 320 278 310 329 340 352 256 264 285 310 340
Metals 2017, 7, 178 9 of 13
In addition to SP precipitation, size and volume fractions of austenite and ferrite (that are influenced by SP precipitation) can also affect the mechanical properties of duplex stainless steels. However, the qyincreases in the first stage of precipitation cannot be ascribed to the volume fraction and grain size variations of α and γ phases, since the volume fraction of SPs varies by ca. 1–3 %, which causes a negligible ferritic grain refinement. Furthermore, the volume fraction of the harder matrix phase, i.e., ferrite, slightly decreases (Table1), so the material should indeed soften without the precipitation of the very hard SPs (~800 HV).
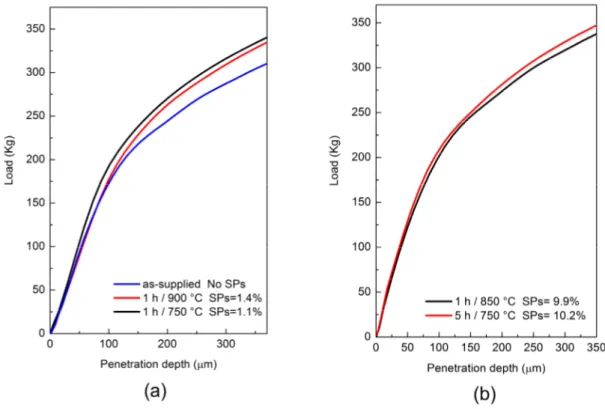
Thus, the FIMEC technique is sensitive in detecting changes of yield stress induced by the precipitation of small amounts of secondary phases, as further observed in Figure8a, where the curves recorded in tests on the as-received material (without SPs) and on samples with almost the same volume fractions of SPs (~1%) precipitated at different temperatures are reported. Furthermore, Figure8a,b shows that FIMEC is also sensitive to the morphology and distribution of the secondary phases. In fact, the curves of samples with almost the same precipitated SPs volume fraction, at increasing temperatures, exhibit differences which could be ascribed to the σ phase structure, that is, “coral-like” after heat treatments at 750◦C and changes to bulky “oil-spot” after heat treatments at higher temperatures (850◦C and 900◦C).
Metals 2017, 7, 178 9 of 13
In addition to SP precipitation, size and volume fractions of austenite and ferrite (that are influenced by SP precipitation) can also affect the mechanical properties of duplex stainless steels. However, the qy increases in the first stage of precipitation cannot be ascribed to the volume fraction
and grain size variations of α and γ phases, since the volume fraction of SPs varies by ca. 1–3 %, which causes a negligible ferritic grain refinement. Furthermore, the volume fraction of the harder matrix phase, i.e., ferrite, slightly decreases (Table 1), so the material should indeed soften without the precipitation of the very hard SPs (~800 HV).
Thus, the FIMEC technique is sensitive in detecting changes of yield stress induced by the precipitation of small amounts of secondary phases, as further observed in Figure 8a, where the curves recorded in tests on the as‐received material (without SPs) and on samples with almost the same volume fractions of SPs (~1%) precipitated at different temperatures are reported. Furthermore, Figure 8a,b shows that FIMEC is also sensitive to the morphology and distribution of the secondary phases. In fact, the curves of samples with almost the same precipitated SPs volume fraction, at increasing temperatures, exhibit differences which could be ascribed to the σ phase structure, that is, “coral‐like” after heat treatments at 750 °C and changes to bulky “oil‐spot” after heat treatments at higher temperatures (850 °C and 900 °C).
Figure 8. Comparison between FIMEC curves recorded on samples with almost the same volume fractions of precipitated SPs at different temperatures (a) and (b). Moreover in (a) the curve of the as‐ received material is plotted to show how 1% of secondary phases also induces significant variations of the FIMEC output. 5. Discussion The evaluation and quantification of SPs in DSS through LM image analysis is difficult and hard work is reported in literature to find a suitable methodology, including DSS preparation, selective etching methods, image acquisition through back‐scattered electrons in scanning electron microscopy, and the selection of the quantitative description parameters and surface distributions of stereological parameters [39–42]. In the present investigation all of the SPs reported in the literature were found in DSS 2055. Nitrides and M23C6 carbides with nanometer sizes were observed through
TEM. Even if they could not be detected because of the low resolution of LM techniques, their volume fractions were so low as to be negligible if compared to the σ phases. The χ phase was found through
Figure 8. Comparison between FIMEC curves recorded on samples with almost the same volume fractions of precipitated SPs at different temperatures (a,b). Moreover in (a) the curve of the as-received material is plotted to show how 1% of secondary phases also induces significant variations of the FIMEC output.
5. Discussion
The evaluation and quantification of SPs in DSS through LM image analysis is difficult and hard work is reported in literature to find a suitable methodology, including DSS preparation, selective etching methods, image acquisition through back-scattered electrons in scanning electron microscopy, and the selection of the quantitative description parameters and surface distributions of stereological parameters [39–42]. In the present investigation all of the SPs reported in the literature were found in DSS 2055. Nitrides and M23C6carbides with nanometer sizes were observed through TEM. Even if they could not be detected because of the low resolution of LM techniques, their volume fractions
Metals 2017, 7, 178 10 of 13
were so low as to be negligible if compared to the σ phases. The χ phase was found through TEM only at 750◦C in low volume fractions, but with morphology and size comparable to the σ phase, so the χ phase precipitates were counted in the LM image analysis reported in Table1. However, for the scope of the present work it was assumed in the first approximation that the global effect of all SPs (σ + χ) on the mechanical properties of DSS 2055 were the same as if caused by the only σ phase. This hypothesis is supported by the thermodynamic calculations of Sathirachinda et al. [35].
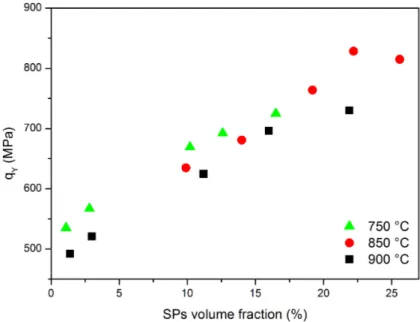
In Figure8small SPs volume fractions induced a significant change of yield stress compared to the as-received material for which qywas 470 MPa. In Figure9qYvalues determined from the curves in Figure7are plotted vs. the volume fraction of SPs formed during heat treatments at 750◦C, 850◦C, and 900◦C. It is evident that yield stress increases with the SPs amount. Furthermore, FIMEC testing can reveal the SP volume fractions on the order of 1%. The result is of great interest because conventional hardness tests are not considered reliable by several investigators [7,16,43–46] in order to reveal SP quantities smaller than 3–4%. Although such SP concentrations also have little, or no, effect on the ultimate tensile strength (UTS) and Young’s modulus [11], as a matter of fact, they are considered as a critical limit for industrial applications, because they are sufficient to strongly decrease the toughness of DSS. For instance, ~1% of σ phase causes the impact value to drop by about 50% in comparison with the original conditions (solution annealed and quenched) [41].
Metals 2017, 7, 178 10 of 13 TEM only at 750 °C in low volume fractions, but with morphology and size comparable to the σ phase, so the χ phase precipitates were counted in the LM image analysis reported in Table 1. However, for the scope of the present work it was assumed in the first approximation that the global effect of all SPs (σ + χ) on the mechanical properties of DSS 2055 were the same as if caused by the only σ phase. This hypothesis is supported by the thermodynamic calculations of Sathirachinda et al. [35]. In Figure 8 small SPs volume fractions induced a significant change of yield stress compared to the as‐received material for which qy was 470 MPa. In Figure 9 qY values determined from the curves
in Figure 7 are plotted vs. the volume fraction of SPs formed during heat treatments at 750 °C, 850 °C, and 900°C. It is evident that yield stress increases with the SPs amount. Furthermore, FIMEC testing can reveal the SP volume fractions on the order of 1%. The result is of great interest because conventional hardness tests are not considered reliable by several investigators [7,16,43–46] in order to reveal SP quantities smaller than 3%–4%. Although such SP concentrations also have little, or no, effect on the ultimate tensile strength (UTS) and Young’s modulus [11], as a matter of fact, they are considered as a critical limit for industrial applications, because they are sufficient to strongly decrease the toughness of DSS. For instance, ~1% of σ phase causes the impact value to drop by about 50% in comparison with the original conditions (solution annealed and quenched) [41].
Figure 9. qY values determined from the FIMEC curves in Figure 7 are plotted vs. the volume fraction of SPs developed through isothermal heat treatments at 750 °C, 850 °C, and 900 °C. In Figure 9 there are differences between the qY values obtained from samples with almost the same amount of SPs, but developed through heat treatments at different temperatures: the lower the temperature, the higher the yield stress. For instance, on the left‐hand side of the plot it is observed that the qY values obtained by samples with SP amounts in the range of 1%–3% are ~50 MPa higher
for the treatment at 750 °C than at 900 °C. This proves that FIMEC testing is also sensitive to the morphology of σ phase, since σ precipitation at 750 °C is mainly “coral‐like” and progressively changes to the bulky “oil‐spot” structure with heat treatments at higher temperatures (850 °C and 900 °C). In fact, with the interconnected “coral‐like” σ structure, the yield stress is expected to increase with respect to the bulky “oil spot” one, where the σ phase is surrounded by ferrite and austenite. It is known that DSS exhibits more brittle behavior after lower temperature precipitation [14] because of the “coral‐like” σ phase structure, where slight deformations also give rise to transcrystalline cracks that propagate through the σ phase over long distances with consequent toughness loss. This is not possible if a matrix of ferrite and austenite surrounds the σ phase, like in the bulky “oil spot” structure that is produced after higher temperature exposure. Therefore, the FIMEC technique seems very promising to assess, in a non‐destructive way and on a local scale, the characteristics of
Figure 9. qYvalues determined from the FIMEC curves in Figure7are plotted vs. the volume fraction of SPs developed through isothermal heat treatments at 750◦C, 850◦C, and 900◦C.
In Figure9there are differences between the qYvalues obtained from samples with almost the same amount of SPs, but developed through heat treatments at different temperatures: the lower the temperature, the higher the yield stress. For instance, on the left-hand side of the plot it is observed that the qYvalues obtained by samples with SP amounts in the range of 1–3% are ~50 MPa higher for the treatment at 750◦C than at 900◦C. This proves that FIMEC testing is also sensitive to the morphology of σ phase, since σ precipitation at 750◦C is mainly “coral-like” and progressively changes to the bulky “oil-spot” structure with heat treatments at higher temperatures (850◦C and 900◦C). In fact, with the interconnected “coral-like” σ structure, the yield stress is expected to increase with respect to the bulky “oil spot” one, where the σ phase is surrounded by ferrite and austenite. It is known that DSS exhibits more brittle behavior after lower temperature precipitation [14] because of the “coral-like” σ phase structure, where slight deformations also give rise to transcrystalline cracks that propagate through the σ phase over long distances with consequent toughness loss. This is not possible if a matrix of ferrite and austenite surrounds the σ phase, like in the bulky “oil spot” structure that is produced
Metals 2017, 7, 178 11 of 13
after higher temperature exposure. Therefore, the FIMEC technique seems very promising to assess, in a non-destructive way and on a local scale, the characteristics of mechanical components made of DSS after exposure at different temperatures. Therefore, the technique could also be used to verify the quality of welded joints and the effects of post-welding heat treatments through tests performed directly in the MZ and HAZ, where different amounts of σ with different morphologies can be found.
An experimental campaign is underway to obtain more datasets from other alloys (duplex and superduplex steels), to further support the results obtained on 2205 steel and validate the FIMEC measurements on detecting small SP fractions.
6. Conclusions
The present work was carried out in order to assess the capability of the instrumented indentation FIMEC test to reveal possible sources of toughness loss in DSS steels represented by SP precipitation occurring with temperature exposure. The tests were carried out on DSS 2205 steel heat-treated at 750◦C, 850◦C, and 900◦C for increasing durations (1, 2, 5, 8, and 10 h), and the SP precipitation was studied through LM, XRD, and TEM.
The results can be summarized as follows:
1. FIMEC is capable of detecting changes of yield stress induced by the precipitation of small SP amounts (~1%);
2. It is also sensitive to the specific σ phase morphology (“coral-like” or bulky structures).
Therefore, the instrumented indentation FIMEC test seems to be a suitable technique for checking the state of DSS after temperature exposure and the quality of welds on DSS as an alternative to bending tests commonly used today in industrial practice. A portable FIMEC apparatus can be used to test in-service mechanical parts (plates, pipes, etc.).
Author Contributions:Giuliano Angella performed the TEM observations, Roberto Montanari and Alessandra Varone performed the XRD experiments; Roberto Montanari and Alessandra Fava performed the FIMEC tests, Maria Richetta performed the microhardness tests and optical microscopy observations with image analysis; and Roberto Montanari, Alessandra Varone, and Giuliano Angella wrote the paper.
Conflicts of Interest:The authors declare no conflict of interest. References
1. Solomon, H.D.; Devine, T.M. Duplex Stainless Steels—A tale of two phases. In Proceedings of the Conference on Duplex Stainless Steels, St. Louis, MO, USA, 23–28 October 1982; pp. 693–756.
2. Capello, E.; Chiarello, P.; Previtali, B.; Vedani, M. Laser welding and surface treatment of a 22Cr-5Ni-3Mo duplex stainless steel. Mater. Sci. Eng. A 2003, 351, 334–343. [CrossRef]
3. Karlsson, L.; Bengtsson, L.; Rolander, U.; Pak, S. The kinetics of intermetallic phase formation in duplex stainless weld metals and their influence on mechanical properties. In Proceedings of the Applications of Stainless Steels, Stockholm, Sweden, 9–11 June 1992; pp. 335–344.
4. Fargas, G.; Anglada, M.; Mateo, A. Effect of the annealing temperature on the mechanical properties, formability and corrosion resistance of hot-rolled duplex stainless steel. J. Mater. Process. Technol. 2009, 209, 1770–1782. [CrossRef]
5. Ahn, Y.S.; Kang, J.P. Effect of aging treatments on microstructure and impact properties of tungsten substituted 2205 duplex stainless steel. Mater. Sci. Technol. 2000, 16, 382–388. [CrossRef]
6. Chen, T.H.; Yang, J.R. Effects of solution treatment and continuous cooling on σ-phase precipitation in a 2205 duplex stainless steel. Mater. Sci. Eng. A 2001, 311, 28–41. [CrossRef]
7. Chen, T.H.; Weng, K.L.; Yang, J.R. The effect of high-temperature exposure on the microstructural stability and toughness property in a 2205 duplex stainless steel. Mater. Sci. Eng. A 2002, 338, 259–270. [CrossRef] 8. El Koussy, M.R.; El Mahallawi, I.S.; Khalifa, W.; Al Dawood, M.M.; Bueckins, M. Effect of thermal aging on
microstructure and mechanical properties of duplex stainless steel weldments. Mater. Sci. Technol. 2004, 20, 375–381. [CrossRef]
Metals 2017, 7, 178 12 of 13
9. Nowacki, J.; Rybicki, P. The influence of welding heat input on submerged arc welded duplex steel joints imperfections. J. Mater. Proc. Technol. 2005, 164, 1082–1088. [CrossRef]
10. Badji, R.; Bouabdallah, M.; Bacroix, B.; Kahloun, C.; Belkessa, B.; Maza, H. Phase transformation and mechanical behavior in annealed 2205 duplex stainless steel welds. Mater. Charact. 2008, 59, 447–453. 11. Chan, K.W.; Tjong, S.C. Effect of Secondary Phase Precipitation on the Corrosion Behavior of Duplex Stainless
Steels. Materials 2014, 7, 5268–5304. [CrossRef]
12. Calliari, I.; Pellizzari, M.; Zanellato, M.; Ramous, E. The phase stability in Cr-Ni and Cr-Mn duplex stainless steels. J. Mater. Sci. 2011, 46, 6916–6924. [CrossRef]
13. Karlsson, L.; Rigdal, S.; Lake, F. Effects of intermetallic phases in duplex stainless steel weldments. In Proceedings of the Duplex America 2000 Conference on Duplex Stainless Steel, Houston, TX, USA, 29 February–1 March 2000; pp. 257–272.
14. Pohl, M.; Storz, O.; Glogowski, T. Effect of intermetallic precipitations on the properties of duplex stainless steel. Mater. Charact. 2007, 58, 65–71. [CrossRef]
15. Haghdadi, N.; Abou-Ras, D.; Cizek, P.; Hodgson, P.D.; Rollett, A.D.; Beladi, H. Austenite-ferrite interface crystallography dependence of sigma phase precipitation using the five-parameter characterization approach. Mater. Lett. 2017, 196, 264–268. [CrossRef]
16. Calliari, I.; Zanesco, M.; Ramous, E. Influence of isothermal aging on secondary phases precipitation and toughness of a duplex stainless steel SAF 2205. J. Mater. Sci. 2006, 41, 7643–7649. [CrossRef]
17. Lee, K.M.; Cho, H.S.; Choi, D.C. Effect of isothermal treatment of SAF 2205 duplex stainless steel on migration of δ/γ interface boundary and growth of austenite. J. Alloys Compd. 1999, 285, 156–161. [CrossRef]
18. Sieurin, H.; Sandstrom, R. Sigma phase precipitation in duplex stainless steel 2205. Mater. Sci. Eng. A 2007, 444, 271–276. [CrossRef]
19. Kim, Y.J.; Chumbley, L.S.; Gleeson, B. Continuous cooling transformation in cast duplex stainless steels CD3MN and CD3MWCuN. J. Mater. Eng. Perform. 2008, 17, 234–239. [CrossRef]
20. Ferro, P. A dissolution kinetics model and its application to duplex stainless steels. Acta Mater. 2013, 61, 3141–3147. [CrossRef]
21. Ferro, P.; Bonollo, F. A Semiempirical Model for Sigma-Phase Precipitation in Duplex and Superduplex Stainless Steels. Metall. Mater. Trans. A 2012, 43, 1109–1116. [CrossRef]
22. Caluscio Dos Santos, D.; Magnabosco, R. Kinetic Study to Predict Sigma Phase Formation in Duplex Stainless Steels. Metall. Mater. Trans. A 2016, 47, 1554–1565. [CrossRef]
23. Warren, A.D.; Harniman, R.L.; Guo, Z.; Younes, C.M.; Flewitt, P.E.J.; Scot, T.B. Quantification of sigma-phase evolution in thermally aged 2205 duplex stainless steel. J. Mater. Sci. 2016, 51, 694–707. [CrossRef]
24. Gondi, P.; Donato, A.; Montanari, R.; Sili, A. A miniaturized test method for the mechanical characterization of structural materials for fusion reactors. J. Nucl. Mater. 1996, 233, 1557–1560. [CrossRef]
25. Donato, A.; Gondi, P.; Montanari, R.; Moreschi, F.; Sili, A.; Storai, S. A remotely operated FIMEC apparatus for the mechanical characterization of neutron irradiated materials. J. Nucl. Mater. 1998, 258, 446–451. [CrossRef]
26. Riccardi, B.; Montanari, R.; Moreschi, L.F.; Sili, A.; Storai, S. Mechanical characterization of fusion materials by indentation test. Fusion Eng. Des. 2001, 58, 755–759. [CrossRef]
27. Riccardi, B.; Montanari, R. Indentation of metals by flat-ended cylindrical punch. Mater. Sci. Eng. A 2004, 381, 281–291. [CrossRef]
28. Montanari, R.; Filacchioni, G.; Riccardi, B.; Tata, M.E.; Costanza, G. Characterization of Eurofer-97 TIG-welded joints by FIMEC indentation tests. J. Nucl. Mater. 2004, 329, 1529–1533. [CrossRef]
29. Balijepalli, S.K.; Colanoni, I.; Donnini, R.; Kaciulis, S.; Lucci, M.; Montanari, R.; Ucciardello, N.; Varone, A. Elastic modulus of the S phase in a kolsterized 316L stainless steel. La Metall. Ital. 2013, 105, 42–47. 30. Balijepalli, S.K.; Donnini, R.; Kaciulis, S.; Montanari, R.; Varone, A. Young’s modulus profile in kolsterized
AISI 316L steel. Mater. Sci. Forum 2013, 762, 183–188. [CrossRef]
31. Rotundo, F.; Ceschini, L.; Martini, C.; Montanari, R.; Varone, A. High temperature tribological behavior and microstructural modifications of the low-temperature carburized AISI 316L austenitic stainless steel. Surf. Coat. Technol. 2014, 258, 772–781. [CrossRef]
32. Sola, R. Post-treatment surface morphology effect on the wear and corrosion resistance of nitrided and nitrocarburized 41 CrAlMo7 steel. La Metall. Ital. 2010, 102, 21–31.
Metals 2017, 7, 178 13 of 13
33. Sola, R.; Poli, G.; Giovanardi, R.; Veronesi, P.; Calzolari, C.; Zanotti, A. Wear and corrosion resistance modification of nitrided and nitrocarburized steeels. La Metall. Ital. 2010, 102, 29–39.
34. Montanari, R.; Varone, A.; Barbieri, G.; Soltani, P.; Mezzi, A.; Kaciulis, S. Welding of IN792 DS superalloy by electron beam. Surf. Interface Anal. 2016, 48, 483–487. [CrossRef]
35. Sathirachinda, N.; Pettersson, R.; Pan, J. Depletion effects at phase boundaries in 2205 duplex stainless steel characterized with SKPFM and TEM/EDS. Corros. Sci. 2009, 51, 1850–1860. [CrossRef]
36. Zucato, I.; Moreira, M.C.; Machado, I.F.; Lebrao, S.M.G. Microstructural characterization and the effect of phase transformations on toughness of the UNS S31803 duplex stainless steel aged treated at 850◦C. Mater. Res. 2002, 5, 385–389. [CrossRef]
37. Gregori, A.; Nilson, J.O. Decomposition of ferrite in commercial superduplex stainless steel weld metals; microstructural transformations above 700◦C. Metall. Mater. Trans. A 2002, 33, 1009–1018. [CrossRef] 38. Ramirez, A.J.; Lipold, J.C.; Brandi, S.D. The relationship between chromium nitride and secondary austenite
precipitation in duplex stainless steels. Metall. Mater. Trans. A 2003, 34, 1575–1597. [CrossRef]
39. Michalska, J.; Sozanska, M. Qualitative and quantitative analysis of σ and χ phases in 2205 duplex stainless steel. Mater. Charact. 2006, 56, 355–362. [CrossRef]
40. Escriba, D.M.; Materna-Morris, E.; Plaut, R.L.; Padilha, A.F. Chi-phase precipitation in a duplex stainless steel. Mater. Charact. 2009, 60, 1214–1219. [CrossRef]
41. Badji, R.; Bouabdallah, M.; Bacroix, B.; Kahloun, C.; Bettahar, K.; Kherrouba, N. Effect of solution treatment temperature on the precipitation kinetic of σ-phase in 2205 duplex stainless steel welds. Mater. Sci. Eng. A 2008, 496, 447–454. [CrossRef]
42. Cvijovic´, Z.; Radenkovic´, G. Microstructure and pitting corrosion resistance of annealed duplex stainless steel. Corros. Sci. 2006, 48, 3887–3906. [CrossRef]
43. Redjaïmia, A.; Proult, A.; Donnadieu, P. Morphology, crystallography and defects of the intermetallic χ-phase precipitated in a duplex (δ + γ) stainless steel. J. Mater. Sci. 2004, 39, 2371–2386. [CrossRef]
44. Nilsson, J.-O.; Huhtala, T.; Jonsson, P.; Karlsson, L.; Wilson, A. Structural stability of super duplex stainless weld metals and its dependence on tungsten and copper. Metall. Mater. Trans. A 1996, 27, 2196–2208. [CrossRef]
45. Nilsson, J.O.; Kangas, P.; Karlsson, T.; Wilson, A. Mechanical properties, microstructural stability and kinetics of σ-phase formation in 29Cr-6Ni-2Mo-0.38N superduplex stainless steel. Metall. Mater. Trans. A 2000, 31, 35–45. [CrossRef]
46. Akisanya, A.R.; Obi, U.; Renton, N.C. Effect of ageing on phase evolution and mechanical properties of high tungsten super-duplex stainless steel. Mater. Sci. Eng. A 2012, 535, 281–289. [CrossRef]
© 2017 by the authors. Licensee MDPI, Basel, Switzerland. This article is an open access article distributed under the terms and conditions of the Creative Commons Attribution (CC BY) license (http://creativecommons.org/licenses/by/4.0/).