1 Alma Mater Studiorum
Alma Mater Studiorum –– Università di BolognaUniversità di Bologna
DOTTORATO DI RICERCA IN
GEOFISICA
Ciclo XXVSettore Concorsuale di afferenza: 04/A4 Settore Scientifico disciplinare: GEO/10
TITOLO TESI
LOCATING SOURCE OF VOLCANIC TREMOR AT STROMBOLI VOLCANO, ITALY
Presentata da: MARIANTONIETTA LONGOBARDI
Coordinatore Dottorato Relatore
PROF. MICHELE DRAGONI DR. LUCA D’AURIA
2
Index
Intoduction………....7
I Chapter: Volcanic tremor………...9
1.1 General consideration of volcanic tremor………...9
1.1.1 Tremor frequency distribution………11
1.1.2 Duration………..11
1.1.3 Amplitudes………..12
1.1.4 Special cases………15
2 Modelling the source of volcanic tremor………..18
2.1 Resonance of large magma bodies……….20
2.2 Hydrothermal boiling……….23
2.3 Excitation of fluid-filled cracks………..24
2.4 Fluid-flow-induced oscillations………..29
3 Volcanic tremor at Kilauea volcano………..32
3.1 Harmonic tremor……….34
3.2 The Mauna Ulu eruption in 1969………36
3 II Chapter: Methods of analysis applied to volcanic tremor……….50 2.1 Method of spectral estimation……….50 2.1.2 Identification of source effects from observed spectra………53 2.1.3 Study of wavefield properties- polarisation analysis-...…………...56 2.1.4 Study of wavefield and source location using array methods- method of correlation coefficients -………58 2.1.5 Semblance methods for source location………61 2.1.6 Visual and acoustic observations related to tremor activity………..64 2.1.7 Volcanic tremor at Stromboli………75
4
III Chapter: Finite element method………77
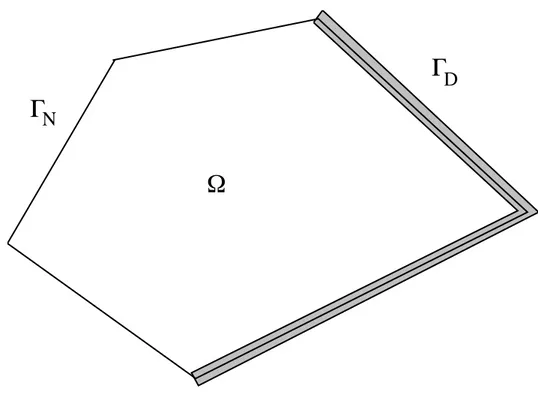
3.1 The physical domain………77
3.2 Green’s theorem………...78
3.3 The problem, written in weak form………..79
3.4 The discret variational problem………81
3.5 The associated system………..82
5
Introduction………86
IV Chapter: Application at Stromboli volcano………..87
4.1 Green’s function………...87
4.2 Finete element method (FEM)……….88
4.3 Examples computation……….89
4.4 Location of the source………..94
4.5 Synthetic tests………...95
6 Conclusions………..102 References………105
7
Introduction
The purpose of this work is to develop a method for locating volcanic tremor sources. This method will be applaied on Stromboli vulcano dataset (7 years of recods). The work will concentrate mostly identifyng the number and location of the sources investigating on their temporal variation.
Volcanic tremor has attracted considerable attention by seismologist because of its potential value as a tool for forecasting eruptions and better understanding the physical processes that occur inside active volcanoes. However, unlike tectonic earthquakes where the dominant source process is brittle failure of rock, the driving mechanism of tremor seems to involve complex interactions of magmatic fluids with the surrounding bedrock. These interactions are responsible for the following distinct characteristics found in volcanic tremor recorded at many volcanoes worldwide: a) the onset of tremor may be emergent or impulsive, with its amplitude showing in many cases a dirct relationship the volcanic activity; b) in the frequency domain the spectra consist of a series of sharp peaks in the band 0.1-7 Hz, representing either a fundamental frequency and its harmonics, or a random distribution, while quite often they exhibit temporal variations in their content; c) the depth of the source can very considerably from one volcano to another in the range of a few hundred metres to 40 km; d) tremor may occur prior to and/or after eruptions with a duration that ranges from several minutes to several days or months. The methods used to study tremor include spectral analysis using both the Fast Fourier
8 Transformation and the Maximum Entropy Method, polarisation analysis of the wavefield and methods that make use of array data to deduce the backazimuth and type of the seismic waves as well as the location of the source. Visual and/or recorded acoustic observations of the ongoing volcaanic activity have assisted in many cases to further constrain proposed physical mechanisms for the generation of tremor. The models suggested as possible sources of tremor can be grouped as follows: a) fluid flow induced oscillations of conduits transporting magmatic fluids; b) excitation and resonance of fluid-filled cracks; c) bubble growth or collapse due to hydrothermal boiling of groundwater; d) a variety of models involving the oscillations of magma bodies with different geometries. It has been proposed by many authors that the source of tremor is not unique and may differ from one volcano to another, a fact that adds mor difficulty in the source modelling efforts.
Most methods used to locate volcanic tremor sources are: 1) use of array, 2) the calculation of wave field amplitude. The study on volcanic tremor for Stromboli volcano will be carried out adopting the latter basing the method on a realistic wavefield model.
9
1 Chapter
Volcanic Tremor
1.1 General Consideration of Volcanic Tremor
Volcanic tremor that occurs the eruptions of volcanoes is one of the most interesting phenomena characterizing the dynamics of eruption. Whereas volcanic-tectonic earthquakes (Gorshokov, 1954) principally do not differ from ordinary tectonic ones and volcanic (explosive) earthquakes have many common features with powerful explosions, volcanic tremor seems to be a unique phenomenon that has no correspondences with any other phenomena being studied with seismic methods.
Volcanic tremor was recoded for the first time during the Usu volcanic eruption (Omori 1911) in 1910 and after that was recorded repeatedly during the eruption of volcano Kilauea (Eaton and Richter, 1960; Finch, 1949), Mauna Loa (Finch, 1943; Jaggar, 1920), Krakatau and Paricutin (Finch, 1949), Vesuvius (Imbo, 1935), Meakan-dake (Sakuma, 1959). In the course of seismic investigation of volcanic tremor, some regularities were found that characterize this process, the principal ones of which are as follows: 1) stability of volcanic tremor in time (from 2-3 days to several months) (Gorshkov, 1954; Finch, 1943, 1949; Jaggar, 1920; Omori, 1911), 2) stability of the period and the amplitude of tremor (Gorshkov, 1954; Finch, 1949; Macdonald, 1952; Sakuma, 1957).
In most of the above mentioned papers the authors have supposed in the obvious form that the volcanic tremor is provoked by the displacements of
10 masses in the deep or near surface parts of volcano apparutus. So, a nonstationary source was suggested as the cause of a time stationary phenomena. In particular, Fincher (1949) supposed that the source of volcanic trembling on Hawaii was “rhythmic shock activity of rising lava”. However, from the geological and seismological points of view one cannot imagine such a mechanism of “tectonic-magmatic generator” that forces the pillar of lava some kilometers high to pulsate with the stable frequency and amplitude for some weeks or even some months.
In other papers, leakage of gases trhough the system of cracks (Sakuma, 1959), and the movement of magma in the channel were taken as possible sources of volcanic tremor.
Volcanic tremor is, as previously noted, always a sign of high activity. However since the exct mechanisms are still unknonw, the importance and timing between the first appearance of tremor and possible eruptive activity is sill a matter of discussion (McNutt, 2000a).
11 1.1.1 Tremor Frequency Distributions
The mean and median frequencies are both near 3.5 Hz, and 90% of the data lie between 1 and 9 Hz. It is often observed that tremor frequencies are relatively insensitive to changes in azimuth or small changes in distance (attenuation becomes important only over large distances).
1.1.2 Duration
One of the most basic pieces of information about a tremor episod is its duration. Figure 1 shows a histogram of tremor durations for two samples, 488 cases from a single volcano, Pavlof (Alaska), and a worldwide sample of 1100 cases from 84 volcanoes. Short-duration episodes, those lasting minutes to hours, account for 93% of the Pavlof sample and 80% of the worldwide sample. The two distributions roughly mimic each other, that is, a single volcano and a large group of volcanoes share common features. Most of the long-duration tremor episodes, those lasting weeks or longer, accompany long-duration eruptions.
12 Fig.1. Volcanic tremor durations for 488 cases from Pavlof Volcano and for a worldwide sample of 1100 cases from 84 volcanoes. Heights of bars are proportional to percentage of total data sample. Times are 2-59 min (M), 1-23 h (H), 1.6 days (D), and 1 week or longer (W).
13
1.1.3 Aplitudes
It normalizes or standardizes the amplitudes to a common reference. This is essentially the same type of solution used in the determination of earthquake magnitudes. A normalization called reduced displacemente (R.D.) is widely used. There are two formulas. For body wave (P- waves and S-waves):
For surface waves (Rayleigh waves, Love waves. And PL waves):
Where A is amplitude in centimeters peak-to-peak, r is distance from source to seismic station in centimeters, M is sismograph magnification at the tremor frequency, and λ is wavelenght in centimeters. The term is a correction for root mean square (rms) amplitude, assuming that most tremor resembles a sinuisod. The formulas correct for the effects of geometric sperading, instrument magnification, and rms amplitude, but not for attenuation. Both formulas were mathematically derived from the far-field expressions for displacement at a point source. The surface wave formula explicitly includes the wavelength. The normalization distance is
14 1cm, which is essentially at the source. The unit of reduced displacement are cm^2. A seismic station that can record earthquakes of magnitude 1.0 will also record tremor of 2.2 cm^2 reduced displacement at 3 Hz. For each increase of one earthquake magnitude unit, the reduced displacement increases by a factor of 10. (Seismology, Theoretical.)
15
1.1.4 Special Cases: A. Banded Tremor
“Banded” tremor occur in regular, periodic bursts separated by quiescence of uniform duration. The resulting pattern looks like stripes or bands on seismograms. The degree of regularity is partly a function of the speed of revolution of the seismograph drum. If the duration of the tremor signal or quiescent period is an integer multiple of the period of revolution, then the tremor will appear exactly banded. If the two are dissimilar, the signal will appear irregularly banded. Most examples of banded tremor have been recorded during times of hydrothermal activity, suggesting that the tremor may be caused by cavities refilling at a uniform rate and then boiling off. The magmatic cases suggest flow at uniform rate into a shallow magma body that eruption when some critical capacity or strength is exceeded.
B. Spasmodic Tremor
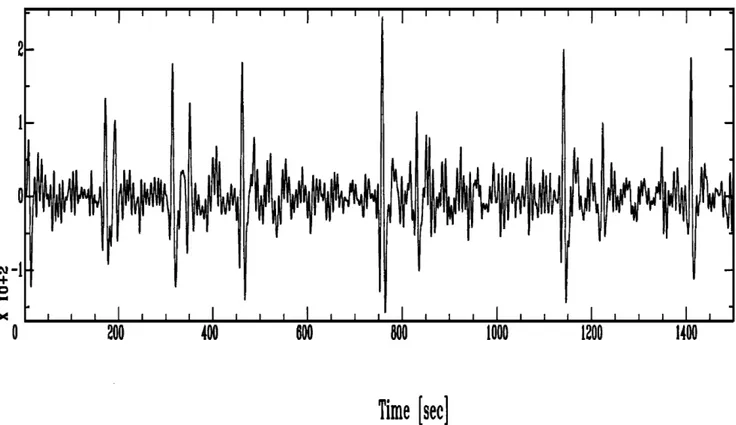
Most tremor looks like an irregular sinusoid with frequencies between 1 and 5 Hz. A second type of tremor, called spasmodic tremor, consists of pulses of high frequency, usually 5-10 Hz or more. In some cases, the pulses are discrete earthquakes producing separate P-waves and S-waves. In others the seismograms are phaseless. The signal is continuous in the sense that new subevents occur before the coda of the previous subvent returns to background levels (Fig. 2). Spasmodic tremor has been recorded at Kilauea, Mount. S. Helens. Although this type of tremor has only been
16 recorded at a small number of volcanic areas, no signals like these are known from nonvolcanic areas. The presence of fluids has been suggested as a contributing cause of spasmodic tremor, since fluids would increase the pore pressure and lubrificate fault surface.
17 Fig. 2. Seismograms of a typical earthquake and typical spasmodic tremor at Mammoth Mountain, Calfornia. The spasmodic tremor burst has overlapping coda of small earthquakes and high
18
C. Deep Tremor
Most tremor originates at shallow depths (0-5 km), but deep tremor or deep LF events occur repeatedly at Kilauea at depths of 30-60 km. The durations of these episodes rarely exceed 1 h. Deep LF events are known at Izu-Oschima (Japan) where a single monotonic LF event occurred at a depth of 30 km, at Lassen Peak (California) whre about one dozen long-period events between depths of 16 and 22 km were recorded, and at Mammoth Mountain, where a sigle LF event at a depth of 18 km was recorded.
19
2 Modelling the source of volcanic tremor
The process of how magma ascends from a deeper source and moves towards the surface causing an eruption has been studied extensively by many authors and at different scales. On the smallest possible scale magma is considered to flow through the porous matrix of partially molten rock, forming during its ascent shape-preserving waves as has been demonstred analytically (Scott and Stevenson, 1984) and experimentally (Scott and Stevenson, 1986). On a larger scale, the interior of a volcano is modelled as consisting of a shallow magma reservoir fed by a deeper source and a cylindrical-shaped conduit that transports the fluid upwards and may be connected to a network of other conduits (Fedotov,1981). In general the reservoir is considered to behave elastically under variable stress conditions imposed by fluid accumulation or outflow. The cylindrical conduit on the oder hand is believed to exhibit more complicated, viscous behaviour so that a high driving fluid pressure from below results in deformations transmitted periodically as expansions or contractions of its wall (Ida and Kumazava, 1986; Ida, 1996). Elastic behaviour of the conduit may also be expected when the fluid pressure builds up quikly, forcing the conduit to respond elastically by a fast opening (Maeda, 2000).
Several observations made during eruptions seggest a direct link between inward and outward flow of magma from a reservoir and the generation of volcanic tremor. Tilt observations indicate the occurence of cycles of slow build-up of ground dformation starting as volumetric expansion and terminating with contraction, being accompanied almost always by tremor
20 episodes (Kilauea Dvorak and Okamura, 1985; Izu Oshima Oikawa et al., 1991; Fukao et al., 1998).
21
2.1 Resonance of large magma bodies
Among the first model to be used in order to explain the occurence of volcanic tremor is that of the free oscillations of magma bodies of various shapes. For example Sassa (1936) and later Shima (1958) and Kubotera (1974) suggested that the observed 10-s-period tremor at Mt. Aso was caused by the oscillation of a spherical magma chamber beneath the volcano. Assuming that the low-frequency earthquakes may be a kind of impulse response of the tremor-generating system, Chouet (1985) proposed a model to explain such earthquakes by studing the oscillations of a buried magmatic pipe. The pipe consisted of three parts: on the top a hemispherical cavity filled with gas was considered to be triggering the oscillations due to excess gas pressure, in the middle the resonating pipe had a cylidrical shape and was filled with magma, and at the bottom it was shut by a horizontal disk. The calculated free surface response of this system showed an impulsive signature in the vicinity of the pipe, but evolved to harmonic wavetrain at larger diastances. Based on similar ideas about the relationship of tremor and low-frequency earthquakes, Crosson and Bame (1985) studied the resonance of a magmatic filled spherical cavity encased in country rock which contained a smallar cavity filled with gas. The motivation for such a model also came from observations at Stromboli, where low-frequency earthquakes were found to originate a few seconds prior to exsplosions. In that sense expansion of the gas-filled cavity could set the magma-filled one into resonance. The signal generated by such an oscillation had a frequency content of 1-5 Hz, consistent with the observations, and an impulsive signature in the time domain. Again it
22 was assumed that sustained expansions of the gas-filled pocket (probably due pressure variations) would give rise to continuous tremor.
23
2.2 Hydrothermal boiling
The fact that the formation of bubbles in a liquid is an efficient way of seismic energy generation has long been recognised and utilised in exploration geophysics (Dobrin and Savit, 1986). Gysers and geothermal reservois are natural sources of such seismic energy and seismological studies at the Old Faithful geyser revealed the existence of tremorlike signals related to boiling of ground-water (Kieffer, 1984; Kedar et al., 1996). Leet (1988) suggested that processes similar to the ones observed at Old Faithful could be used to explain the generation of volcanic tremor recrded during quiet periods at certain volcanoes, which he called “non eruption tremor”. Two restrictions regarding this model are: a) the magma chamber underneath the volcano acting as the source of heat should not reside at higer elevation level than the groundwater table; and b) the process should operate at shallow depths, so that steam can be separated from the liquid. Obviously, hydrothermal boiling cannot explain tremor processes operating at depths larger than a few kilometres from the Earth’s surface. Boiling of graundwater causes the formation and growth of bubbles in the liquid that may collapse if they encounter a liquid ragion of lower temperature. Either of these two mechanisms can generate seismic energy, but Leet (1988) found that bubble collapse is 10^2 - 10^4 times more efficient in converting thermal power to seismic power; the boiling heat transfer rates in order for bubble collapse to generate 1-Hz tremor should be about 1000 MW, which he notes is the upper limit of observed heat flow in volcanic crater lakes and geothermal areas. The resulting signal is expected to resemble white noise, with equal energy in all
24 frequency bands, which is in contrast to the sharply peaked tremor spectra.
25
2.3 Excitation of fluid-filled cracks
Brittle failure of rock and crack formation inevitably accoompany any upward movement of magma during different stages of volcanic activity. The main result of such rock fracturing is the generation of various types of seismic signals, ranging from events that can hardly be distinguished from common tectonic earthquakes to low-frequency events with emergent onsets, absence of clear S-wave phases and a slowly decaing coda Chouet, 1996). Injection of water into hot dry rock has been found to produce seismic signals similar to low-frequency volcanic earthquakes and supports the idea of a source that involves the opening of tensile cracks caused by excess fluid pressure (Bame and Fehler, 1986). The overall similarity of tremor and low-frequency events in the time and frequency domains, notwithstanding their different signal has been pointed out by many authors as indicating that a common source may be at work, and which of the two seismic signals will be generated depends on the duration of the excitation mechanism (Fehler, 1983; Chouet, 1985; Hofstetter and Malone, 1986; Tsuruga et al., 1997; Almendros et al., 1997). Volcanic tremor underneath Kilauea during the 1963 eruption was mainly composed of P waves, shared the same source area with the low-frequency eartquakes and was deep enough to assume that the observed tremor could be explained by the magmatic pressure build-up as magma moves away from a deep reservoir beneath the summit of the volcano. The cracks may be placed in a series and are connected by narrow channels that open when magma pressure reaches a critical value, facilitating the movement of fluid from one crack to the next one. The vibration caused by such a movement
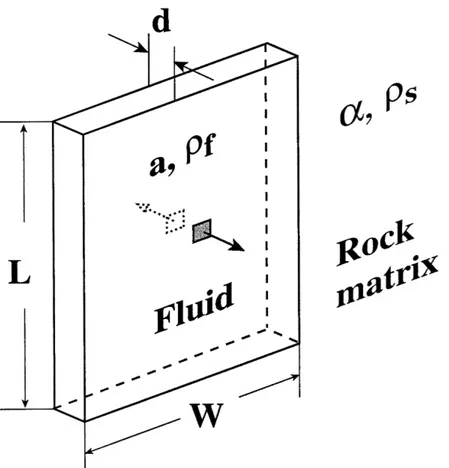
26 was found to have a period proprtional to the crack length and amplitude that depended on the excess pressure and the area of extension. In order to explain the temporal variations of the frequency content during a tremor episod from higer (5-10 Hz) to lower frequenzies (1.5-3 Hz), Aki and Koyanagi (1981) suggested that this process starts with a few cracks generating a signal of small period which increases as more cracks vibrate and the length of the chain gets longer. However, two descrepancies have been pointed out regarding this model; first, as the length of the chain is increasing, thisshould lead to sustematic lowering of the frequencies of the length of the chain is increasing of the tremor signal, which was not observed. Second, numerical studies on crack generation and growth show that a tensile stress regime combined with the fact that the largest part of each crack is expected to be filled with fluid, favour catastrophic growth rather than a stable opening-closing process (Sammis and Julian, 1987). Chouet (1986, 1988) considered the displacement of the walls of a fluid-filled crack (Fig. 4) caused by a pressure disturbance in the fluid as a possible model for the generation of low-frequency earthquakes, as well as tremor, if the disturbance is sustained. This model is qualitatively different from that proposed by Aki et al. (1977), since it assumes the vibration of only one crack with no inflow or outflow of fluid taking place. The caracteristics of the far field wavefield radieted by a rectangular shaped vibrating crack, filled with an inviscid fluid and assuming that the surrounding bedrock behaves as a Poisson solid, were found to depend on the following parameters: a) the crack geometry; b) the position and the area over which the pressure disturbance occurs; c) boundary conditions for the stress on the crack’s surface and the fluid flow at the crack
27 paramiter; and d) a dimensionless quantity called the crack stiffness C and the fluid-solid impedance contrast Z. Volcanic tremor underneath Kilauea during the 1963 euption was mainly composed of P waves, shared the same source area with the low-frequency earthquakes and was deep enough to assume that its source had to do with magma transportation rather than degassing processes (Aki et al., 1977; Aki and Koyanagi, 1981). Aki et al. (1977) proposed that the observed tremor could be explained by the jerky extension of a chain of cracks caused by magmatic pressure build-up as magma moves away from a deep reservoir beneath the summit of the volcano. The cracks may be placed in a series and are connected by norrow channels that open when magma pressure reaches a critical value, facilitating the movement of fluid from one crack to the next one. The vibration caused by such a movment was found to have a period proportional to the crack length and an amplitude that depended on the excess pressure and the area of extension. In order to explain the temporal variations of the frequency content during a tremor episode from higer (5-10 Hz) to lower frequencies (1.5-3 Hz), Aki and Koyanagi (1981) suggested that this process starts with a few cracks generating a signal of small period which increases as more cracks vibrate and the length of the chain gets longer. However, two discrepancies have been pointed out regarding this model; first, as the length of the chain is increasing, this should lead to systematic lowering of the frequencies of the tremor signal, which was not observed. Second, numerical studies on crack generation and growth show that a tensile stress regime combined with the fact that the largest fluid, favour catastrophic growth rather than a stable opening-closing process (Sammis and Julian, 1987). Chouet (1986, 1988)
28 considered the displacement of the walls of a fluid-filled crack caused by a pressure disturbance in the fluid as a possible model for the generation of low-frequency earthquakes, as well as tremor, if the disturbance is sustained. This model is qualitatively differnt from that proposed by Aki et al. (1997), since it summes the vibration of only one crack with no inflow or out flow of fluid taking place.
29
Malone, 1986; Tsuruga et al., 1997; Almendros et al., 1997).
Volcanic tremor underneath Kilauea during the 1963 eruption was mainly composed of P waves, shared the same source area with the low-fre-quency earthquakes and was deep enough to as-sume that its source had to do with magma trans-portation rather than degassing processes (Aki et al., 1977; Aki and Koyanagi, 1981). Aki et al. (1977) proposed that the observed tremor could be explained by the jerky extension of a chain of cracks caused by magmatic pressure build-up as magma moves away from a deep reservoir be-neath the summit of the volcano. The cracks may be placed in a series and are connected by narrow channels that open when magma pressure reaches a critical value, facilitating the movement of £uid from one crack to the next one. The vi-bration caused by such a movement was found to have a period proportional to the crack length and an amplitude that depended on the excess pressure and the area of extension. In order to explain the temporal variations of the frequency content during a tremor episode from higher (5^ 10 Hz) to lower frequencies (1.5^3 Hz), Aki and Koyanagi (1981) suggested that this process starts with a few cracks generating a signal of small period which increases as more cracks vibrate and the length of the chain gets longer. However, two discrepancies have been pointed out regard-ing this model; ¢rst, as the length of the chain is increasing, this should lead to systematic lowering of the frequencies of the tremor signal, which was not observed. Second, numerical studies on crack generation and growth show that a tensile stress regime combined with the fact that the largest part of each crack is expected to be ¢lled with £uid, favour catastrophic growth rather than a stable opening^closing process (Sammis and Juli-an, 1987).
Chouet (1986, 1988) considered the displace-ment of the walls of a £uid-¢lled crack (Fig. 17) caused by a pressure disturbance in the £uid as a possible model for the generation of low-fre-quency earthquakes, as well as tremor, if the dis-turbance is sustained. This model is qualitatively di¡erent from that proposed by Aki et al. (1977), since it assumes the vibration of only one crack
with no in£ow or out£ow of £uid taking place. The characteristics of the far-¢eld wave¢eld radi-ated by a rectangular shaped vibrating crack, ¢lled with an inviscid £uid and assuming that the surrounding bedrock behaves as a Poisson solid, were found to depend on the following pa-rameters: (a) the crack geometry; (b) the position and the area over which the pressure disturbance occurs; (c) boundary conditions for the stress on the crack’s surface and the £uid £ow at the crack perimeter; and (d) a dimensionless quantity called the crack sti¡ness C and the £uid-solid impedance contrast Z, de¢ned as:
C ¼ WbLd; Z ¼ bsK
bfa ð17Þ
where b is the bulk modulus of the £uid, W is the rigidity of the solid, L is the crack length, d is the crack thickness, bs is the density of the solid with
K its P-wave velocity and bf the density of the
£uid with P-wave velocity equal to a. For many di¡erent combinations of the above parameters Fig. 17. Geometry of the £uid-¢lled crack model described by Chouet (1986, 1988); see text for more details. The shaded area indicates the place of application of the pressure transient that triggers resonance (B.A. Chouet, pers. comm., 2001).
VOLGEO 2511 29-10-02
K.I. Konstantinou, V. Schlindwein / Journal of Volcanology and Geothermal Research 119 (2002) 161^187 180
Fig. 3. Geometry of the fluid-filled crack model described by Chouet (1986, 1988). The shaded area indicates the place of application of the pressure transient thet triggers resonance.
30
2.4 Fluid-flow-induced oscillations
The quantitative study of magma flow through a geometrically irregular volcanic conduit poses a diffult numerical problem which requires the formulation and simultaneous solution of a system of partial differential equations describing the flow of the fluid as well as the elastic disturbance being caused by the coupling to the surrounding rock (Chouet and Julian, 1985). Futher complications may arise if the fluid consists of a gas and liquid phase, or if the thickness of the conduit changes in space as well as in time, effectively exhibiting viscous or visco-elastic behaviour. In models of tremor generation involving fluid flow, a number of simplyfing assumptions are usually made: a) the fluid has constant density and consists of one phase only, b) the motion occurs in one or two dimension and c) the conduit behaves elastically, while its thickness can only change as a function of time. Based on these assumptions and using the principles of conservation of mass and momentum for the fluid, Julian (1994) derived a third-order system of non-linear ordinary differential equations that describe the flow inside a verically extending crack connecting an upstream and downstream reservoir (Fig.3).
Another type of flow-induced oscillation may occur if the fluid system is suddendly perturbed from its equilibrium state by some external cause, like fracturing of the surrounding bedrock and formation of a new conduit, or a sudden variation in the fluid supply (St Lawrence and Qamar, 1979; Ferrick et al., 1982). This will result in the generation of a fluid transient with characteristics that will depend on the physical properties of the fluid, the geometry of the conduit and the boundary conditions. Pressure
31 oscillations caused by the transient will displace the conduit walls generating elastic waves in the surrounding medium.
More complicated behaviour is expected if the conduit is a part of an extended network such as is believed to exist beneath many volcanoes. Energy considerations show that once the system is perturbed it will continue to oscillate, until damped primarily by fluid friction, since dissipation of energy due to the generation of seismic waves is relatively small (Ferrick and St. Lawrence, 1984). Similar unsteady flow in cinduits followed by tremor-like seismic signals has been reported at a power plant at oroville, California caused by a faulty valve and at Tarbella dam, Pakistan, while water was moving through outflow tunnels (McNutt, 1986).
32
metrically irregular volcanic conduit poses a
di⁄-cult numerical problem which requires the
formu-lation and simultaneous solution of a system of
partial di¡erential equations describing the £ow
of the £uid as well as the elastic disturbance being
caused by the coupling to the surrounding rock
(Chouet and Julian, 1985). Further complications
may arise if the £uid consists of a gas and liquid
phase, or if the thickness of the conduit changes
in space as well as in time, e¡ectively exhibiting
viscous or visco-elastic behaviour. In models of
tremor generation involving £uid £ow, a number
of simplifying assumptions are usually made: (a)
the £uid has a constant density and consists of
one phase only, (b) the motion occurs in one or
two dimensions and (c) the conduit behaves
elas-tically, while its thickness can only change as a
function of time.
Based on these assumptions and using the
prin-ciples of conservation of mass and momentum for
the £uid,
Julian (1994)
derived a third-order
sys-tem of non-linear ordinary di¡erential equations
that describe the £ow inside a vertically extending
crack connecting an upstream and a downstream
reservoir (Fig. 14). Considering a £uid density
and viscosity typical for basaltic melts (
b
= 2500
Table 3
Reported visual and acoustic observations related to tremor activity
Region Visual/acoustic observation Reference
Pavlof Lava fountaining related to high-amplitude tremor McNutt, 1986; Garce¤s and Hansen, 1998
Klyutchevskoy Variation of tremor spectral amplitude envelope whenever the eruptive activity changed
Gordeev et al., 1990
Kilauea Gas-piston events associated with cycles of ponding and withdrawal of lava from the crater followed by high-amplitude tremor
Ferrazzini and Aki, 1992
Mt. Semeru Pumping and explosion sounds with durations of 40 s^16 min that coincided with tremor episodes
Schlindwein, 1994
Stromboli Gas bursts at the top of the magma column coincide with high-amplitude tremor
Ripepe et al., 1996; Ripepe, 1996
Arenal Di¡erent explosion sounds that are accompanied by ash plumes and precede tremor episodes
Benoit and McNutt, 1997; Garce¤s et al., 1998; Hagerty et al., 2000
White Island Eruptive/intrusive activity always followed by inharmonic tremor Sherburn et al., 1998
Satsuma-Iwojima Strong tremor occurring while vent emmits high-temperature volcanic gas
Ohminato and Ereditato, 1998
Karimsky/Sangay ‘Chugging’ tremor episodes followed by steam locomotive-like sounds
Johnson and Lees, 2000
Fig. 14. Lumped parameter model of the generation of vol-canic tremor. Viscous incompressible £uid £ows in the x di-rection from the upstream to downstream reservoir through a channel of length (L) with imperfectly elastic walls, mod-elled as movable but undeformable blocks of mass 2M, sti¡-ness 2k and damping constant 2A (all measured per unit dis-tance in the z direction). All motion occurs in the x^y plane and it is independent of z. The dynamic variables are the channel thickness h(t) and the £uid speed v(x,t) (from Julian, 1994; reproduced with permission of American Geophysical Union).
VOLGEO 2511 29-10-02
K.I. Konstantinou, V. Schlindwein / Journal of Volcanology and Geothermal Research 119 (2002) 161^187 177
Fig. 4. Lumped parameter model of the generation of volcanic tremor. Viscous incompressible fluid flows in the x direction from the upstream to downstream reservoir through a channel of length (L) with imperfectly elastic walls, modelled as movable but underformable blocks of mass 2M, stiffness 2k and damping constant 2A (all measured per unit distance in the z direction). All motion occurs in the x-y plane and it is independent of z. The dynamic variables are the channel thickness h(t) and the fluid speed v(x,t) (from Julian, 1994).
33
3 Volcanic tremor at Kilauea volcano
Harmonic tremor characterized by an almost constant frequency pattern throughout the duration of its seismic signal is associated with eruptive activity and magma movement in Hawaii. The signal frequency is believed to vary inversely to the length of the generating source, and amplitude varies according to rate of magma movement under confining pressure. The eruption related tremor reflects high-frequency seismic and acoustic disturbance from lava-fountain activity. The amplitude of eruption tremor oscillates at intervals of a few seconds in a temporal pattern resembling that of intense lava fountaining, in which high bursts repeatedly occur seconds apart. This characteristic pattern may be related to pulsating magma movement driven by continual pressure fluctuations. Added to the eruption zone activity, tremor and long-period events that are localized at the summit vary in intensity according to the maagnitude and rate of the associated inflation-deflation episodes. Long-period events and tremor are inferred to share a common origin, and selected long-period events with identifiable onset times are locatable using standard earthquake locating techniques. The locations of long-period event may, in turn, be used to identify the source region of tremor beneath Hawaii and to further define depth-time classifications of tremor.
34
3.1 Harmonic tremor
Harmonic tremor, a seismic indicator of magma movement and eruptive activity, has been instrumentally documented at the Hawaiian Volcano Observatory (HVO) since 1912. It is identified on seismograms by a sustained signal that varies within a limited range of frequencies. Its duration is determined by the duration of volcanic eruption or of accelerated magmatic activity within the transpport system. At HVO, tremori s classified into three categories of inferred depth on the basis of relative amplitude and real extent of detection in the seismic network. Tremor is logged in terms of minutes per hour for short episodes and hours par day for longer events. Most of our tremor data is related to activity at Kilauea, since that is ehere most activity has occurred in the past 20 years and where our network of seismometers is densest. Seismic data collected from such prolonged Kilauea eruptions as the Mauna Ulu sequence in 1969-1974 and the Puu Oo sequence in 1983-1985, and from a significant southwest rift intrusion in August 1981 have provided a comprehensive record of shallow tremor associated with eruptions and intrusions, s well as, tremor associated with the aftermath of eruptive-intrusive activity or during periods of increased magmatic activity within the magma transport sustem at depth. Tremor near eruptive vents varies in amplitude according to the vigor of eruption. The seismic signal associated with eruption attenuates rapidly with increasing distance from the eruptive vent. Harmonic tremor that occurred in places or times unrelated to eruption is presumed to be associated with magma movement at depth. It is commonly localized beneath the Kilauea summit region at crustal depths but spreads to cover a large area beneath the active volcanoes in the south Hawaii region at mantle depths. Episodes of such tremor are often accompanied by increased numbers of long-period events, which have measurable onsets and travel tmes across the seismic network that fit P-wave velocities expected for normal earthquakes. The amplitude and signal duration of the long-period events vary like those of earthquakes, but otherwise their spectra resemble those of tremor in having consistently
35 peaked frequencies throughout the coda. Similarity of the distance-attenuation rates for the long-period events and for tremor further implies a common source or origin. If we accept a common origin for long-period events and tremor, then the precise determination of hypocenters for a sufficient number of long-period events accurately constrains the source region for tremor beneath Hawaii. The depth distribution of located long-period events as a function of time provides insight into the dynamic processes involved in the ascent of magma pluming system to eruptions of lava on the surface. Koyanagi and others (1976) have shown how swarms of short-period earthquakes outline the upper boundary of the shallow storage system beneath the summit of Kilauea and how a persistent source of long-period events defines the magmatic feeding sysstem below. A region in which few earthquakes occur, lacated at a depth of 3-6 km, is interpreted to be the storage zone of magma having an expected low rigidity. Swarms of shallow earthquakes and rapid changes in ground tilt during vigorous intrusions of magma are often accompanied by a background of low-amplitude tremor. Upon eruption of lava, the tremor amplitude increases and the frequency of earthquakes decreases. During the euption, the amplitude of tremori is influenced by lava movement and fountaining at the eruption site and by magma movement within the conduit sistem near the summit. Bursts of tremor at intermediate depths beneath Kilauea are occasionally recorded during eruptions, but these usually accompany gradual inflation of the summit. Persistent deep tremor in the mantle beneath south Hawaii had individual episodes that last one-half hour to several hours, and their cumulative reduced displacement as a function of time yields a rate of magma ascent from the mantle (Aki and Koyanagi,19981). Reduced displacement refers to the source intensity of tremor calculated from seismographically measured ground amplitudes.
36
3.2 The Mauna Ulu eruption in 1969
The Mauna Ulu eruption series was preceded frequency of shallow earthquakes in the summit region several weeks before and a subsequent increase in the number of east-rift earthquakes a week before the pre-eruption seismic swarm. The initial outbreak on May 24, 1969, started within hours of earthquake swarms and weak tremor in the east rift and deflation of the summit. Increased harmonic tremor occurred just before the lavaa outbreak on the east rift. After a two-week repose, activity renewed with long periods of quiescence persisted until the end of the year, producing 12 pronounced episodes of strong eruption. The intense fountaining episodes accompanied by high-amplitude tremor generally lasted less than a day; they were spaced at intervals varyng from several days to more than two months. Between the major episodes, low amplitude tremor was continous in the aerea of the active vents. The repeated pattern of eruption and accompanying sequence of tilt and seismic events is summarized in figure (Fig. 5). The nearness of th eruptive vent to the summit made it difficult to distinghish tremor possiblygenerated from separate sources along the conduit system during major episodes of eruption. Strong eruption tremor dominated at stations near the eruptive vents, as well as at those in the summit region. Gradual inflation and an increase in shallow earthquakes at the summit preceded the eruptive outbreaks. Shallow tremor at the eruption vent increased in aplitude simultaneously with the increase in lava output and fountaining. Abrupt onsets and endings these eruptive episodes were accompanied by equally rapid changes in tremor amplitude. Sustained high rates of summit deflation associated with the major eruptive outbreaks were followed by an increase in very small long-period events and harmonic tremor at the summit. Harmonic tremor sometimes developed into a fluctuating pattern, in which bursts of higher amplitude lasting 5-10 seconds occurred repeatedly and as frequently as several times per minute level of continuous tremor, and long-period events with higher amplitude and more definable onset times occurred at wide intervals of many minutes. The
37 areal variation of tremor amplitude is shown in figure 6 1-min samples of seismograms from temporary stations occupied with a jeep-mounted mobile seismic unit. This survey was made a few hours after a major eruptive episode in order to avoid seismic and acoustic noise from hugh fountaining and during a time interval when tremor amplitude remained fairly stable so that time difference had minimal effect on station-to-station comparisons. However, the sampling was intended to be soon enough after the eruptive episode to capture the expected stabilizing movement of magma within the conduit system following a major outbreak. The survey was repeated several times after major episodes of lava fountaning. For comparability, the tremor was recorded at the same instrumental gain at each station. Amplitude read from continously recording stations near the eruptive vent and in the summit area were used for reference. The comparisons of amplitudes in figure 7A and 7B generally indicate a persistent source at the active vent, and a secondary source at the summit caldera region, which decay to background after about a day of activity. Between major episodes of lava fountaining, when eruptive activity was limited to varyng rates of visible lava movement in the vent (Swanson and other, 1979), the amplitude of harmonic tremor recorded on seismographs within a few km of the vent changed according to the rate of lava movement. An example of time variation in tremor amplitude that correlated with a pattern of lava oscillation in the Mauna Ulu vent is shown in figure 8. High and low activity alternated at intervals of a few to many hours. During other intervals between major outbreaks of lava, low tremor activity showed fairly constant amplitude sustained for many days, or erratic showed fairly constant amplitude sustained for many days, or erratic fluctuations with peak amplitudes lasting from less than a minute to many minutes, or cyclic patterns with regular time intervals of amplitude changes. One variety of cyclic oscillation, descibed as gas piston activity (Swanson, 1971), was defined by tremor of low amplitude for 5-15 minutes during gradual rise of the lava column in the vent. The increased seismic signal during collapse of the lava column characteristically has a symmetrical cigar-shaped envelope: amplitude increases gradually,
38 reaches a peak at least several times above the initial background, and finally decreases at a rate comparable to the rate of increase during onset. Signal frequencies at peak amplitudes are 2-5 Hz at recording distance of about one kilometer from the eruptive vent. The tremor signal is generally local and decreases below background noise a few kilometers from the source vent. This oscillating pattern of lava and tremor activity, sometimes lasting for many days, was observed again during the Puu Oo eruption.
39 Fig.5. Plot of summit tilt, numbers of shallow earthquakes, relative amplitud of tremor and episodes of eruption for the Mauna Ulu eruption of Kilauea Volcano. May-October 1969. Tilt mesaurements
40 at 2-hours interval from the Uwekahuna east-west component tiltmeter near the northwest rim of Kilauea caldera. Earthquake counts at 2-hour intervals from selected local stations, detection threshold estimated at about magnitude 0.1. Amplitude of tremor taken from adjusted hourly readings of smoked-paper records and plotted in relative units above background noise at three stations: Mauna Loa (MLO), 25 km from the eruption site; West Pit (WPT), 11 km from the eruption site; and East Koar (EKO), 5 km from the eruption site. Times of major eruptive epsodes indicated by horizontal bars and labeled with their sequence numbers. Data beyond October incomplete and therefore omitted.
41 Fig. 6. Armonic tremor recorded by portable seismograph following eruptive episode IV of the Mauna Ulu eruption. The numbers indicate the order in which each site was monitored. All seismogram segments are one minute long . A, Immediatly after the eruptve episode. Note the
42 moderate-amplitude tremor at the summit stations 11 and 14. B, One day after the eruption. Note that tremor in the summit area (stations 1 and 19 here) has decreased to background noise.
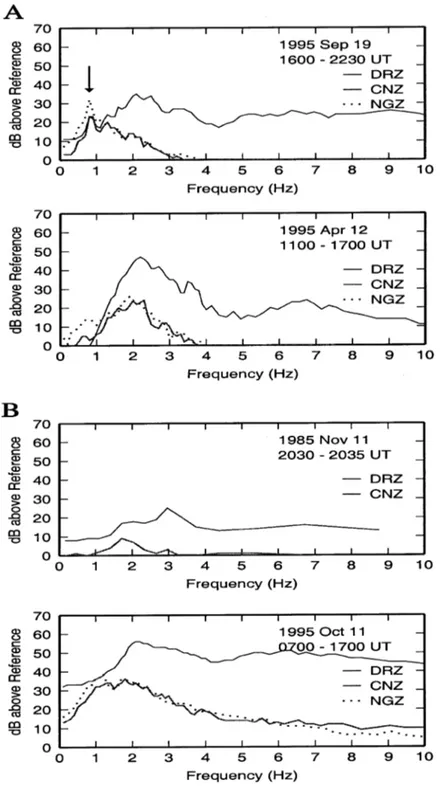
43 Fig. 7. Portions of a smoked-paper seismogram from station (EKO) on the upper east rift zone of Kilauea, 4.5 km from the eruptive vent, that monitored varying amplitudes of low tremor associated
44 with confined lava moment following a major episode of the Mauna Ulu eruption in October 1969. Recording speed and instrumental magnification were kept constant over the entire interval of time.
45
3.3 The Puu Oo eruption in 1983-1985
The pattern of seismicity from mid-1982 to 1985 and continuing reflects the mechanical process within Kilauea Volcano that developed into a major eruptive sequence in the east rift zone (Koyanagi and others, in pres). The geologic and geophysical data pertaining to the sequence of rift intrusions, fissure outbreaks, and eruptive episodes from a centralized vent system for this eruption from 1983 to mid-1984 are summarized by Wolfe and others. From Semptember to December 1982, increase of shallow earthquake in the summit region during periods of inflationary ground tilt, alternating with downrift-migrating swarms of earthquakes in the east rift zone during deflationary periods, indicated that episodic surges of magma were supplying the conduit sistem in the rift zone. This episodic activity led to a major intrusive event on January 2, 1983: rapid summit deflation and vigorous downrift migration of shallow earthquakes were sustained for 24 hours and finally resulted in a fissure outbreak in the east rift zone. High-frequency tremor accompanied the pre-eruption swarm of earthquakes in the east rift. The sustained deflation at the summit was accompanied by short-period earthquake, presumably due to fracturing of the host rocks in response to the withdrawal of magma, and harmonic tremor and long-period events associated with the accelerated magmatic activity. The onset of eruption was accompanied by a marked increase in east-rift tremor, followed by five days of incremental intrusion earthquakes and outbreak of lava farther downrift. The early weeks of the Puu Oo eruption were charavcterized by strong tremor with erratic high-frequency signals from a wide source area. As the pattern of eruption changed from fissure outbreaks to multiple –vent eruption and eventually to repeated lava emissions from e single vent system at Puu Oo, weaker and more continous harmonic tremor originated near the eruptive vent and corresponded in amplitude to the vigor of eruptive activity. Episodes of high lava fountains accompanied by high-amplitude tremor that usually lasted from less than a day to more than a week occurred at intervals of about one to nine weeks. Between major episodes of eruption, the
46 amplitude of the local tremor varied according to the level of the limited lava activity, which was sometimes visible, at depths of 0-50 m in the vent. The patterns of tremor recorded near the actice Puu Oo vent between eruptive episodes are illustrated in figure 8. As in the Mauna Ulu eruption, burst of moderate-amplitude tremor lasting about one minute occurred repeatedly during periods of low-amplitude tremor background tremor lasting 5-15 minutes that characterized gas piston activity (figure 8A). More sustained episodes consisting of increased amplitude lasting about three hours were observed during a repose period in February 1985 (figure 9B). major episodes of high fountains and lava output were accompanied by increased tremor, whose amplitude excceded by more than an order of magnitude de continuous backfround tremor during intervals of subdued eruptive activity. The rapid response of seismic amplitude to changes in lava fountaning and output rate imply that the principal source of tremori s shallow and localized at the eruption site. Convincing evidence of a deeper tremor source beneath the summit of Kilauea, separated from activity in the eruption region, was the tremor recorded at the North Pit following sustained high rates of deflactionary tilt at the summit. This relationship of tremor that varied in amplitude and duration according to the rate and magnitude of the episodes of the Puu Oo eruption from 1983 to mid-1984, and a reduction of the data indicating this relation is documented by Koyanagi and others. These episodes of summit tremor that accompanied major episodes of the eruption were frequently preceded by increasing rates ad amplitudes of discrete long-period events, which peaked into continuous tremor and then decayed gradually back to background, with bursts of long-period events, at progressively lower amplitude and wider intervals of time (figure 9). in contrast to both the summit storage zone and the east-rift eruption site, the rift conduit connecting them remained virtually free of detectable harmonic tremor during the repeated major episodes of eruption. From this we infer an absence of barriers in the central part of the lateral conduit system, allowing quasi-steady flow of magma with minimal pressure fluctuations. A chronological sequence of lava production, increased harmonic tremor in the east rift zone and
47 summit, and ground tilting is outlined in figure 10 for one of the vigorouse eruptive episodes in the prolonged east rift eruption. Ground tilt showing rapid deflation during the twenty-fifth eruptive episod in September 1984 (figure 10) was measured as the east-west component on a continuously recording tiltmeter located at Uwekahuna vault northwest of the summit deformation center. Deflationary tilt started gradually at about 1400 (H.s.t) on September 19 and accelerated in rate at 1700. It continued at a high rate until 0600 on September 20 and then gradually declined, ending by about 0900. The deflationary tilt during these 19 hours totaled 15 microradians, and it reached a maximum rate of 1.35 per hour at about 2000 on september 19. Peak-to-peak amplitude of harmonic tremor was measured on Develocorder seismograms from station MPR for east-rift tremor and from station NPT for summit tremor. Ground oscillation in micrometers was reduced from the amplitude measurement averaged for about one minute at each hour and adjusted for instrumental magnification at the recorded frequency and for station corrections. The average period of the east-rift tremor signal recorded at MPR was about 0.5 s, and that of the summit tremor recorded at NPT was about 0.3 s. Station MPR, situated about 6 km west of the eruptive vent, recorded rapid increase and decrease of the east-rift tremor at the onset and end of the eruptive episode, with a temporary decrease in the middle. The hourly sampling rate used in figure 11 omitted a strong burst of tremor between 1622 and 1633 during the early activity, as well as the exact times of rapid changes at the onset and end of the vigorous fountaining episode.
48 Fig.8. Portions of seismograms from revolving-drum recorders at stations on Kilauea Volcano showing various seismic events. A, Record from station PUK, about 1 km west of the eruptive vent Puu Ooshowing gas-piston events (X) and south flank earthquakes (Y). B, Record from station KMM showing a cyclic pattern of low tremor at the eruptive vent between the major episodes on February 4 and March 13, 1985, of the Kilauea east-rift eruption. Episodes of high tremor (C) less than an hour in duration repeatedly alternated with several hours of lower amplitude (D) during February 7-11, 1985. Two cigar-shaped (E) recorded at 0946 and 1145 were signals characteristic of cyclic lava movement, termed gas-piston acttivity, in the vent. Numerous microshocks (F) associated with thermal contraction crackingon the adjacent new lava flows, degassing explosions, and continual structural adjustments at the vent were conspicuous during times of lowbackground tremor. Other varieties of repose tremor during the prolonged eruption at Puu Oo are described by Wolfe and others.
49 Fig.9. Section of smoked-paper seismograms from station NPT showing the sequence of harmonic tremor and long-period events at the summit following episode 30 of east-rift eruption on February 4-6, 1985. Recording speed and instrumental magnification were kept constant over the entire time interval. A, Period from 0900 to 2000 on February 6 shows an increased number of discrete long-period events in a decreasing background of continuous tremor. Occasionally, stronger long-long-period events were recorded widely on the summit network of station.
50 Fig.10. Change in tilt and tremor amplitude during and after episode 25 of the prolonged Kilauea east-rift eruption characterized by high lava production and fountaning. Tremor amlitudes are approximate averages, ±0.2 micrometers. Curves between hourly readings were interpolated.
51
2 Chapter
Methods of analysis applied to volcanic tremor
2.1 Method of spectral estimation
In most studies of volcanic tremor the estimation of the frequency content has been one of the primary tools for investigating the nature of the signal. However, any method used for the calculation of the spectrum should be able to cope successfully with a number of characteristics not present in other seismic signals. First, tremor can persist for long periods of time resulting in the accumulation of large amounts of data that have to be analysed. Second, they may exhibit strong temporal variations in amplitude and/or frequency content that should be monitored, because of their importance for source modelling and eruption forecasting. Third, the calculated spectrum may have multiple sharp peaks around narrow frequency bands, in which case a high degree of resolution is required in order to resolve the individual frequencies. One of the first spectral methods to be applied to digital tremor data was the direct segment method (Bath, 1974). The long tremor time series is divided into smaller non-overlapping segments and the spectrum is calculated for each segment by means of a Fast Fourier Transform (FFT). The final spectral estimate is then the average of all the individual spectra. This method has been used in volcanic tremor recordings from Mt. St. Helens (Fehler, 1983; Hofstetter and Malone, 1986). It enhances the spectral peaks that are common to every time segment and suppresses those generated by random
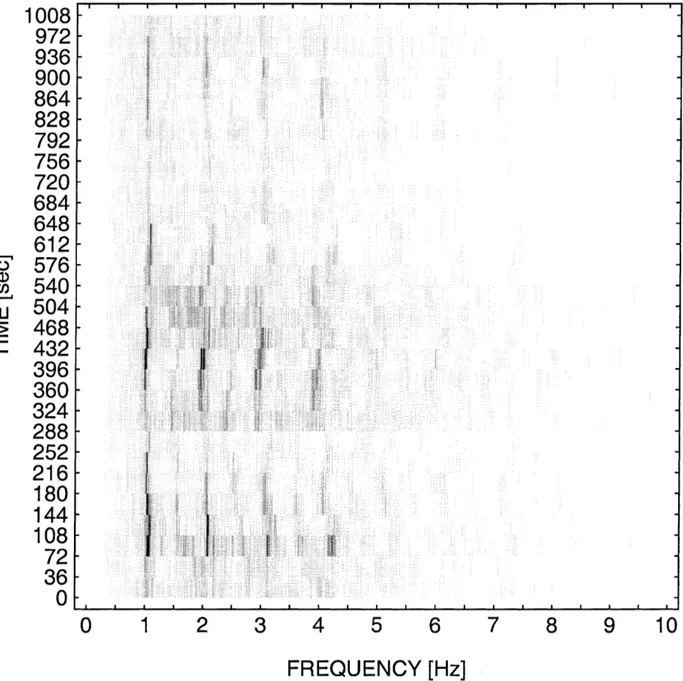
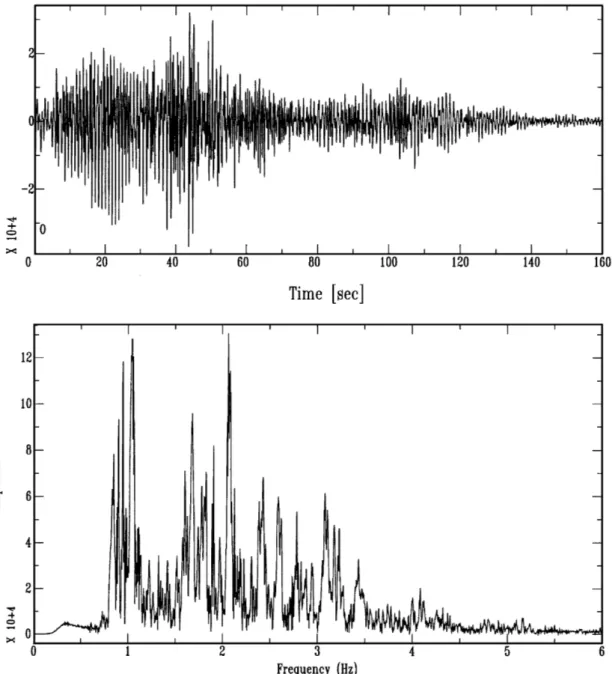
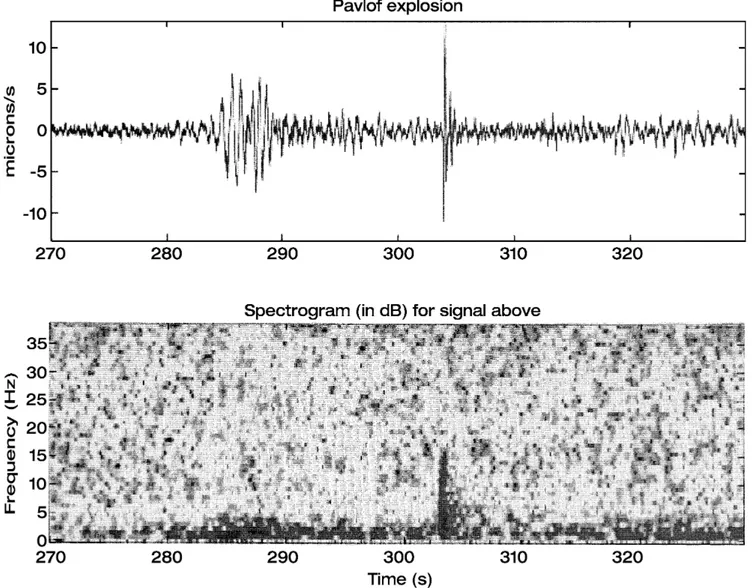
52 noise. A similar method for real-time spectral estimation of tremor data has been implemented at the Ruapehu volcano observatory (Hurst, 1985), where average spectra are calculated over successive 3-min intervals with a frequency resolution of 0.1 Hz in the band between 0.05 and 4.04 Hz (Sherburn et al., 1999) (Fig. 11). In order to detect temporal changes in the frequency content of the signal a direct comparison of the averaged spectra should be performed. Such a comparison of spectra from different time periods is feasible only when the amount of data is relatively small and the observed variations are larger than the ambient noise levels. A better way of detecting temporal variations is by incorporating in the display all the variables that are likely to change (time, frequency, amplitude). This accomplished by creating a spectrogram (Fig. 12), which is a 2D representation of the variations of spectral amplitude and frequency of the observed signal as time elapses. The calculation of the spectrogram can be achieved by moving a sliding window over the whole length of the time series and estimating the amplitude spectrum by performing an FFT for overlapping positions of the window (e.g. Mt. Semeru-Schlindwein et al., 1995; Ruapehu-Sherburn et al., 1999). The resolution of the spectrum obtained by using an FFT algorithm is proportional to the reciprocal of the window length chosen for the analysis. In order to increase the spectral resolution more than it is possible with the FFT, the Maximum Entropy Method (MEM) (Burg, 1967) has been applied in a number of cases (Pavlof- McNutt, 1986; Izu-Oshima-Yamaoka et al., 1991; Mt. Etna-Seidl et al., 1990). Assuming that the time series is generated by a linear random mechanism MEM fits to the data, in a least squares sense, an
53 autoregressive process of order of the form (detailed derivations of these equations can be found in Ulrych and Bishop (1975)):
(1)
by applying a prediction filter of length , where are the filter coefficients calculated by solving the normal equations posed by the least squares problem, is a white noise series with zero mean and variance. Then the spectrum of will be estimated by the equation:
(2)
where is frequency and M represents the total number of samples in the time series considered for the analysis. If the selected time window of the data is small enough MEM will produce a much higher resolution spectrum than the usual FFT methods, otherwise the result will be essentially the same.
54
2.1.2 Identification of source effects from observed spectra
Any recorded seismic signal can be considered as the result of the consecutive application of a series of linear filters to the original wavelet generated by a source (Lay and Wallace, 1995). This can be represented mathematically by the convolution of one filter with the other in the time domain :
(3) or the equivalent equation in the frequency domain:
(4)
where is the recorded waveform, is the original source wavelet, represents the filter characteristics due to the propagation of the signal through the Earth, represents filtering effects due to the structure beneath the recording station and accounts for the filtering due to limited frequency bandwidth of the recording instrument. Hereafter we will refer to , and filters as “source”, “path” and “site effects” respectively. Since in most cases the resulting spectrum consists of a series of sharp peaks, a major difficulty is to successfully determine which factors have shaped it. A comparison between tremor and earthquake spectra recorded at the same station is a common method of checking for possible site effects, since they should influence both signals (Mt. St. Helens-Fehler, 1983; Kilauea-Goldstein and Chouet, 1994; Deception Island-Almendros et al., 1997). Unfortunately it is far more difficult to find and isolate path effects, mainly because of the limited knowledge of the structure between the source and the receivers in most
55 volcanic areas. If the recording stations are close enough and azimuthally distributed around the source, similarities in spectra of different stations may be attributed to source effects (e.g. Pavlof-Mc Nutt, 1986). A less empirical approach to the source-path effect separation problem involves the use of spectral ratios for pairs of events recorded at a number of station (Sakurajima-Tsuraga et al., 1997). The method uses two time windows A and B from a tremor time series that were recorded at several different stations. Based on the assumption that these two events are generated by the same source and at the same hypocentral area, the path and site effects will be the same, thus Eq. 4 will be yielding spectral ratios of the storm for the th station. The correlation of the estimated ratios for the all station and for different frequency bands can be checked by performing a statistical covariance analysis, where high correlation coefficients should indicate a common source effect for the two events. This method may not be always applicable, since the assumptions for events generated by the same source and at the same depth are not generally valid in every volcanic environment. The problem of the correct identification of specific frequencies as source effects and not as propagational artefacts has been made easier with the widespread use of spectrograms that display any new frequency as it appears. Since the path and site effect factors listed in Eq. 3 behave as linear filters and cannot generate new frequencies to their input signal (Anstey, 1981), these frequencies can only be attributed to a source effect.
56
2.1.3 Study of the wavefield properties – Polarisation analysis-
A further step in the analysis of the volcanic tremor is the study of its wavefield and the identification of the types of waves that compose it. The standard method that has been used for such an analysis is that of the covariance matrix (Montalbetti and Kanasewich, 1970; Jurkevics, 1988) which utilizes data recorded by one or more three-component seismometers. The method works in the time domain by badpass filtering the signal around the frequency band of interest and then calculating the covariance matrix for a short, sliding time window along the time series by using the following equation:
(5)
where is the data matrix in one
window and is the th sample of component , is the number of samples and T denotes the transpose of X. the estimated covariance matrix S will be of the form:
(6)
where z, n, e denote the vertical, north-south and east-west components respectively and is the cross-variance of the vertical and east-west components, while is the auto-variance of the vertical component. Solving the eigenvalue problem will give the three eigenvalues and their corresponding eigenvectors . The three principal axes of the polarization ellipsoid will be given by ,
57 with the eigenvectors are equal to in amplitude units. One non-zero eigenvalue implies a purely rectilinear ground motion, while two non-zero eigenvalues characterize a purely elliptical palarisation. In order to obtain a measure of what kind of motion prevails in the time window the rectilinearity and planarity coefficients are used, that are given by
and respectively. The method
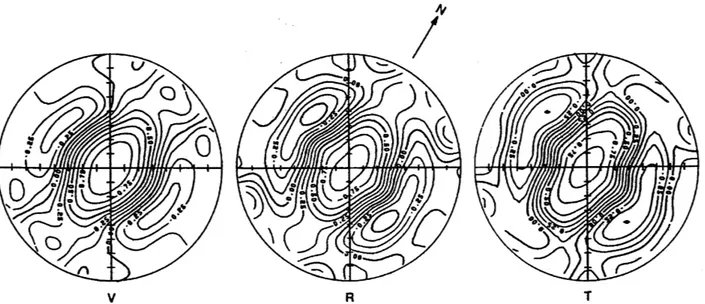
described above has been used to study the wavefield properties of volcanic tremor from Mt. Etna for a time period spanning 6 years (1987-1993) during which different kinds of volcanic activity were at work, including periods of quiescence, Strombolian activity or lava fountaining (Ferrucci et al., 1990; Ereditato and Luongo, 1994; Wegler and Seidl, 1997). The polarization analysis for the whole of this period revealed a persistent pattern of high values for the rectilinearity coefficient with an east-west polarization, suggesting that the wavefield consists of waves radiated by a vertical extended source aligned along the north-south direction. The dominant wave types have been identified either as P waves (Ferrucci et al., 1990) or as Love/SH waves (Ereditato and Luongo, 1994; Wegler and Seidl, 1997) showing a complicated overlapping pattern. Similar observations have been reported for the tremor wavefield in other volcanoes, such as Arenal where the dominant wave type was identified as S waves by Benoit and McNutt (1997), whereas composition of the wavefield and were unable to identify any particular wave type.
58
2.1.4 Study of wavefield and source location using array methods
- Method of correlation coefficients –
While polarization analysis can give a qualitative picture of the composition of the tremor wavefield (even using data from only one seismometer), array methods can provide a much more detailed knowledge of it, at the expense of having to use more instruments and a specific receiver geometry. Aki (1957) designed and used the method of correlation coefficients in order to identify the predominant wave type of the background seismic noise generated by traffic in Tokyo. The method assumes that the recorded seismic signal is stationary and stochastic in time and space and that it consists mostly of surface waves, implying that the method can resolve wavefield properties generated by shallow sources. The spatial correlation function is calculated for pairs of receivers, one being at the centre of a semicircular array (reference receiver) and the others at its circumference, covering an azimuth of 0 to degrees. This function is defined as:
(7) where the angle brackets denote averaging over time, and
are the Cartesian coordinates of the two receivers, is the distance between them and is the azimuth of the two receivers measured from the direction of the axis. Integrating this function for the azimuth range covered by the array will give: