2020-12-21T10:13:28Z
Acceptance in OA@INAF
An aqueously altered carbon-rich Ceres
Title
Marchi, S.; RAPONI, Andrea; Prettyman, T. H.; DE SANCTIS, MARIA CRISTINA;
Castillo-Rogez, J.; et al.
Authors
10.1038/s41550-018-0656-0
DOI
http://hdl.handle.net/20.500.12386/29035
Handle
NATURE ASTRONOMY
Journal
3
Number
A B
1
2
3
4
5
6
7
8
9
10
11
12
13
14
15
16
17
18
19
20
21
22
23
24
25
26
27
28
29
30
31
32
33
34
35
36
37
38
39
40
41
42
43
44
45
46
47
48
49
50
51
52
53
54
55
56
57
58
59
60
61
62
63
Letters
https://doi.org/10.1038/s41550-018-0656-01Southwest Research Institute, Boulder, CO, USA. 2Istituto di Astrofisica e Planetologia Spaziali–Istituto Nazionale di Astrofisica, Roma, Italy. 3Planetary Science Institute, Tucson, AZ, USA. 4Jet Propulsion Laboratory, California Institute of Technology, Pasadena, CA, USA. 5Agenzia Spaziale Italiana, Via del Politecnico, Roma, Italy. 6Earth Planetary and Space Sciences, University of California, Los Angeles, Los Angeles, CA, USA.
*e-mail: [email protected]
The surface mineralogy of dwarf planet Ceres appears to be
dominated by products of rock–fluid interactions, such as
phyllosilicates—some of which are NH
4-bearing—and
carbon-ates
1–3. Elemental concentrations derived from the inferred
mineral mixing fractions, however, do not match
measure-ments of H, C, K and Fe on Ceres
4. A complicating factor in
assessing Ceres’ unique surface composition is the secular
accretion of asteroids typical of chondritic compositions.
Here we show that Ceres’ mineral and elemental data can be
explained by the presence of carbonaceous chondritic-like
materials (~50–60 vol%), possibly due to infalling asteroids,
admixed with aqueously altered endogenic materials that
contain higher-than-chondritic concentrations of carbon. We
find that Ceres’ surface may contain up to 20 wt% of carbon,
which is more than five times higher than in carbonaceous
chondrites. The coexistence of phyllosilicates, magnetite,
car-bonates and a high carbon content implies rock–water
altera-tion played an important role in promoting widespread carbon
chemistry. These findings unveil pathways for the synthesis
of organic matter, with implications for their transport across
the Solar System.
Geophysical, compositional and collisional models informed by
Dawn data (for example, refs
2,5,6) reveal that Ceres is a partially
dif-ferentiated body, that is, did not form a metallic core and has an
outer layer characterized by aqueous alteration products. This
alter-ation fuelled by accretionary and radiogenic heating (for example,
ref.
7) took place early in Ceres history, a time in which collisions
were most frequent
6. Ceres’ early collisional evolution could have
altered its long-term geophysical and compositional evolution, and
therefore needs to be accounted for to fully interpret present-day
remote-sensing data.
To assess the interplay between collisions and compositional
remote-sensing data from the Dawn spacecraft, we rely on a
numerical model to quantify the contamination of Ceres by
infall-ing asteroids (Methods). Dawn’s data have revealed that Ceres’
observed cratering record is at odds with what is observed on other
large asteroids, such as Vesta
6. The apparent deficiency of large (>
100 km in diameter) craters on Ceres is particularly significant as
larger impactors are expected to dominate the mass delivered. Here
we adopt a recent Monte Carlo model of Ceres’ past 4.55 Gyr of
collisional evolution in the asteroid belt
6. The nominal simulated
exogenous mass colliding with Ceres is 3.8
× 10
19kg (about 4% of
Ceres’ mass; see Fig.
1
). Based on available impact mixing
numeri-cal simulations (Methods), we then consider that ~70% of this mass
is accreted by Ceres, the rest lost to space. Of the accreted mass,
Q1 Q2 Q3 Q4
we estimate that about half is buried at depth, and half is entrained
in the ejecta and remains near-surface
8,9. For the latter, we
conser-vatively adopt a nominal mixing depth of 4 km corresponding to
the computed ejecta thickness at the crater rim for the largest relict
basin (Methods). With these assumptions, the resulting
contamina-tion of the top 4 km layer corresponds to a nominal ~75 wt%
(rang-ing from 20 to 175 wt%). For a comparison, the lower limit of our
contamination model rescaled to Vesta is broadly consistent with
concentrations of highly siderophile elements in Vestan meteorites
(Methods).
The effects of this putative exogenic collisional accretion on
Ceres’ spectral properties can be addressed as follows. In the
cur-rent main belt, asteroids colliding with Ceres are likely to belong to
two major spectral classes, S- and C-types
10. Depending on Ceres’
formation location and early evolution of the Solar System, other
impactor populations may have contributed. For instance, it has
been suggested that Ceres could have been implanted into the
aster-oid belt
1,11, but this would have happened within a few million years
of Solar System formation
12, which is unresolvable by our collisional
model. For the sake of simplicity, we model S- and C-type main
belt impactors using ordinary chondrite (OC) and carbonaceous
chondrite (CC) meteorites (for example,
CI, CM, CR), respectively.
We disentangle the spectral contribution of possible contaminants
by computing the maximum fraction of meteoritic-like
contami-nants that could be mixed in with the observed average spectrum
of Ceres without causing detectable deviations. We rely on
labora-tory spectra of OC and CI/CM/CR meteorites and perform spectral
mixtures (Methods). Our modelling shows that the upper limit for
exogenous contaminants for each meteoritic component separately
are (in vol%): 7% OC, 20% CI, 8% CM, 8% CR (Supplementary
Fig. 1). These results indicate that the observed average Ceres’
spec-trum could be compatible with a significant contamination of CI
materials (up to ~20 vol%), while addition of more than ~10 vol% of
either OC or CM/CR seems to be excluded. A corollary is that the
observed Ceres’ average spectrum can only be representative of its
primordial, aqueously altered surface composition for
contamina-tions comparable to or less than the lower limit of collisional
deliv-ery (~20 vol%). On the contrary, higher contaminations (> 20 vol%)
would significantly alter Ceres’ spectrum. Such levels of
contami-nation from asteroids are possible based on our collisional model,
raising the possibility that Ceres’ inferred mineral composition may
not correspond to its primordial composition.
Spectral modelling enabled by the Visible and Infrared Mapping
Spectrometer (VIR)
1,13,14has shown that the overall low albedo of
Ceres can be explained by adding a spectrally neutral darkening
Q7
An aqueously altered carbon-rich Ceres
S. Marchi
1*, A. Raponi
2, T. H. Prettyman
3, M. C. De Sanctis
2, J. Castillo-Rogez
4, C. A. Raymond
4,
E. Ammannito
5, T. Bowling
1, M. Ciarniello
2, H. Kaplan
1, E. Palomba
2, C. T. Russell
6, V. Vinogradoff
2and
A B
64
65
66
67
68
69
70
71
72
73
74
75
76
77
78
79
80
81
82
83
84
85
86
87
88
89
90
91
92
93
94
95
96
97
98
99
100
101
102
103
104
105
106
107
108
109
110
111
112
113
114
115
116
117
118
119
120
121
122
123
124
125
126
127
128
129
Letters
Nature astroNomy
agent to products of aqueous alteration, such as phyllosilicates
and carbonates. A common feature of former spectral models is
the presence of a very high amount of dark material
15(~80 vol%),
commonly assumed to be magnetite, which is a product of aqueous
alteration, as well as amorphous carbon
1,16. Here we explore the
pos-sibility that the darkening agent is CC materials, which are naturally
very dark. In the following discussion, we assume that the CC
com-ponent is exogenic, consistent with possible significant collisional
contamination. As CC materials contain phyllosilicates, the inferred
abundance of Ceres-native phyllosilicates is lower than estimated
from Ceres’ spectral modelling. Thus, we first consider a mixture
of Ceres-native Mg-phyllosilicate, Mg,Ca-carbonate, magnetite,
and NH
4-clay, combined with a CI-like contaminant as needed
to match the average spectrum (Fig.
2a
). Our spectral modelling
shows that it is possible to achieve a good fit to the average Ceres
spectrum with about 60 vol% CI-like material. We stress that the
final mixture percentages reported above are typically uncertain by
a few 10% of their values (for example, ref.
17; Methods). The higher
percentage of CI-like material in the final mixture with respect to
the previous computation is due to different starting assumptions,
namely observed average spectrum versus modelled mineralogy.
The amount of inferred CI-like material is compatible with the
range of expected impact delivery (~20–175 wt%), although we
cannot rule out that a significant fraction of this material is from
the primordial aqueous alteration event, in analogy to the
observa-tion that CC meteorites exhibit a wide range of degree of
altera-tion
18,19. Note that the addition of CM-like material gives similar
results (Methods and Supplementary Fig. 2). These findings
sug-gest that the mix of 50–60 vol% CI- and/or CM-like materials with
a primordial pervasively aqueously altered Ceres is compatible with
VIR observations.
Next, we compare calculated concentrations of H, C, K and
Fe for the mineral assemblages derived from the spectral models
in Fig.
2a
to the ice-free composition of Ceres regolith measured
by the Dawn’s Gamma Ray and Neutron Detector (GRaND). The
results are indicated in case A of Table
1
. The first important finding
is that the proposed mixture fails to reproduce GRaND elemental
data. Most notably, the former contains too much Fe due to the high
concentration of magnetite, as well as too little C, H and K. In this
model, the final K concentration is sourced from CI material. The
most important additional K-bearing mineral phase in our model is
annite. The sample of annite used for the VIR spectral fitting is K
free (Methods), and this is what we have assumed for the GRaND
elemental analysis. Including ~2% of K-bearing annite would
resolve this discrepancy, and not affect the quality of the spectral fit,
as indicated by our modelling. Alternatively, based on
geochemi-cal models
20, similar small concentrations of K—not detectable by
VIR—could be in the form of KCl.
The mismatch in Fe is significant, and indicates that magnetite
cannot be the sole opaque phase on Ceres
4,21. Magnetite—or other
Fe-bearing darkening agents such as sulfides observed in CC
mete-orites—has to be present in small quantities, which is also consistent
with geochemical modelling
20. In addition, lowering the amount of
CI-like material would require a higher concentration of magnetite
1020 1019 1018 Mass accreted (kg) 1017 1016 1015 101 102 Projectile size (km) 0 1 2
Time (Gyr ago)
3 4
Fig. 1 | Ceres post-formation collisional history. Mass (left y axis; or equivalent projectile size (right y axis)) accreted in time bins of 25 Myr as a function of time. The plot shows 25 Monte Carlo simulations. We assumed an impactor density of 2,600 kg m–3. Dots in the top-left corner indicate the cumulative mass for each simulation. Grey indicates total mass below the average (3.8 × 10¹⁹ kg), those in yellow are above. The total mass accreted ranges from 1 × 10¹⁹ to 9 × 10¹⁹ kg.
Notice that in general about two-thirds of the total mass is accreted in the first 100 Myr
of Solar System evolution, and thus it may have not been efficiently retained in the upper crust depending on the degree of internal evolution, while local variations in the concentration of accreted material may also be possible due to the stochastic nature of large collisions.
Q5 Q6 0.040 a b 0.038 0.036 0.034 0.032 I/F I/F 0.030 0.028 0.026 0.040 0.038 0.036 0.034 0.032 0.030 0.028 0.026 2.0 2.5 3.0 3.5 4.0 2.0 2.5 3.0 3.5 4.0 Wavelength (μm) Wavelength (μm)
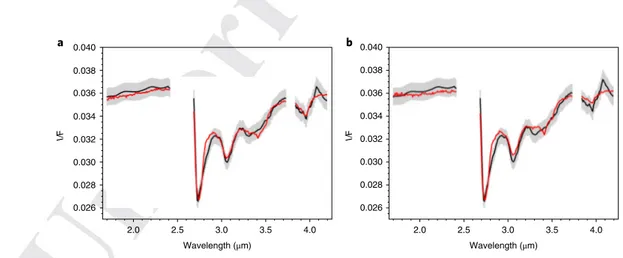
Fig. 2 | Ceres spectral models. Spectral fit (red curves) of the average spectrum of Ceres (black lines; grey bands indicate 1σ error bars for each spectral
channel). a, The model corresponds to 60% CI, 17.5% magnetite, 3% antigorite, 3.5% NH4-annite, 12.5% NH4-montmorillonite, 3.5% dolomite. b, Modelling results using the same methods as in a, but now including amorphous carbon: 60% CI, 2.5% magnetite, 22% amorphous carbon, 2% antigorite, 4% NH4-annite, 8.5% NH4-montmorillonite, 1% dolomite. All mixtures are in vol%. Grain size of 20 μ m is derived by the best-fit routine (grain size is assumed the same for all species). Note that our spectral models rely on spectral data of available ammoniated species in the RELAB database (for example, annite, montmorillonite; Methods), but other species may be equally viable. I/F is the radiance factor (Methods).
A B
130
131
132
133
134
135
136
137
138
139
140
141
142
143
144
145
146
147
148
149
150
151
152
153
154
155
156
157
158
159
160
161
162
163
164
165
166
167
168
169
170
171
172
173
174
175
176
177
178
179
180
181
182
183
184
185
186
187
188
189
190
191
192
193
194
195
(or Fe-bearing sulfides) to achieve a good spectral fit of Ceres, and
thus an even worse elemental fit for GRaND. As we discussed, the
nominal mixture percentages are uncertain, but our analysis
pro-vides a strong constraint that CC-like material must be present in
the near surface in significant concentrations (> 50 vol%). These
analyses also show that mixtures that include only magnetite as
dark material are incompatible with GRaND, even including up to
30 vol% CI/CM contaminants.
Finally, we investigate amorphous carbon as an alternative
darkening agent, as proposed in previous studies (for example,
refs
1,4,22,23). Intriguingly, aliphatic organics have been found near the
Ernutet crater on Ceres, with an inferred abundance up to ~9 vol%
for terrestrial kerite-like materials
14. More recently, it has been
pro-posed
24that if these organics are similar to insoluble organic matter
found in CC meteorites rather than terrestrial organics, then their
inferred abundance from infrared spectra may be locally higher,
up to
several tens of vol%. Despite these analyses, the nature of the
inferred organic component on Ceres remains poorly constrained
25.
Aliphatic organics are known to be vulnerable to C–H bond damage
by ultraviolet and energetic proton radiation with a net effect of
low-ering the H/C ratio
26,27and the progressive suppression of the 3.4 μ m
absorption. Indeed, Ceres’ regional spectra exhibit a strong
ultravio-let minimum at 0.21
μ m that has been interpreted as due to low H/C
ratio organics
22. If Ernutet’s organics have been recently exposed by
impacts
8, then by similarity, high concentrations of organic carbon
could be present elsewhere on Ceres, but exposure through geologic
time has diminished the amount of H to the point where aliphatic
C–H bonds are no longer observed with infrared spectroscopy
(Methods). In fact, elemental data show Ceres’ global regolith could
contain high concentrations of C as carbonates and organics
23. To
test this possibility, we ran additional spectral models substituting
magnetite with amorphous carbon, which has no detectable 3.4
μ m
absorption. We stress that infrared spectral modelling alone is not
sensitive enough the resolve independently the concentrations of
these two dark components, so some degree of degeneracy remains.
We compare elemental concentrations determined from VIR
min-eral mixing ratios with measurements of Ceres’ ice-free elemental
composition
4(Table
1
). The results provide a good fit with the
aver-age VIR spectrum of Ceres. In the end-member case of no
magne-tite, the total Fe content becomes too low. The addition of a small
amount of magnetite (~2.5 vol%; Fig.
2b
) may provide a good fit to
Fe and C derived by GRaND. Thus, the combined use of spectral
and elemental data allows us to better constrain the nature of the
Q8
dark phases. We also find that the H concentration can be explained
by assuming a H/C atomic ratio of ~0.6 for the amorphous carbon
component within the ~1 m depths sensed by GRaND. Our results
imply the presence of organics with vertically varying H/C,
poten-tially compatible with an inferred relatively fast timescale for
ali-phatic C–H bond destruction (Methods). Future work is required
to see whether the inferred bulk H/C ratio is compatible with
the dehydrogenation of organics due to the space weathering at
the surface.
Table 1 | Elemental composition of mineral assemblages
[H] (wt%) [C] (wt%) [K] (μ g g–1) [Fe] (wt%) Density (g cm–3) GRaND equatorial 1.9 ± 0.2 > CI 414 ± 40 16 ± 1 – CI 1.55 3.45 550 18.2 2.11 (2.26) CM 1.4 2.2 370 21.3 2.12 (2.71) OC ~0 0.25 850 24 3.32 (3.54) NH4-annite 1.23 0 0.8 34.1 3.33 NH4-montmorillonite 0.67 0 0 0 2.35 Dolomite 0 13.03 0 0 2.85 Antigorite 1.34 0 0 13.9 2.61 Amorphous carbon 4.97 95.21 0 0 2.00 Magnetite 0 0 0 72.4 5.17 Case A 0.90 2.18 274.2 33.5 2.85 Case B 1.97 20.19 334.2 16.9 2.34
GRaND equatorial measurements for H, C, K, Fe (ref. 4). Note that C concentration is a lower bound. Average elemental concentrations for carbonaceous chondrite meteorites (CI, CM) and ordinary
chondrite meteorites (OC) are from ref. 31. These are shown for reference. Case A and B correspond to mixtures presented in Fig. 2a,b, respectively. Case B is our best model for Ceres. Meteorite average
bulk and grain densities (in parentheses) are from ref. 32.
Phyllosilicate NH4-phyllosilicate
Carbonate
Magnetite Organics
Fluids
Aqueously altered crust
Carbonaceous chondrite-like contaminants or primordial crust
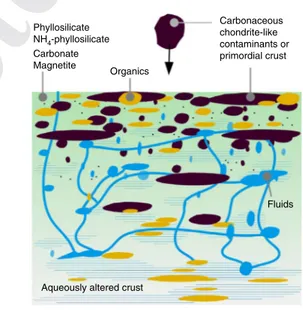
Fig. 3 | Ceres’ upper crust. Schematic view of a possible evolutionary path for the primordial Ceres’ crustal evolution. The figure shows the presence of CC-like material (either from infalling asteroids or a component of the primordial crust; indicated in black) mixed with endogenous products of aqueous alteration such as phyllosilicates, carbonates and magnetite (indicated by the green matrix), and organics (indicated in orange). Shaded blue regions indicate water, and blue lines represent conduits for water migration. Organics may have formed in situ during aqueous alteration and/or could have been concentrated by ascending fluids in the upper crust resulting in the inferred higher-than-chondritic carbon concentration in the near-surface (see main text for discussion). The top layer of Ceres’ crust is largely homogenized by impact gardening and other mass wasting processes.
A B
196
197
198
199
200
201
202
203
204
205
206
207
208
209
210
211
212
213
214
215
216
217
218
219
220
221
222
223
224
225
226
227
228
229
230
231
232
233
234
235
236
237
238
239
240
241
242
243
244
245
246
247
248
249
250
251
252
253
254
255
256
257
258
259
260
261
Letters
Nature astroNomy
We have reconciled the mineralogy inferred from VIR with
ele-mental data from GRaND by allowing for the presence on Ceres
of a significant component of carbonaceous chondrite-like
mate-rial (~50–60 vol%) mixed with NH
4-phyllosilicates, magnetite and
amorphous carbon. The chondrite-like material could originate
from the global aqueous alteration of the primordial crust, and/or
collisionally accreted material after Ceres’ global aqueous alteration
event (Fig.
3
). We stress that our solution may not be unique, but it
represents a simple explanation of available compositional
remote-sensing data. As a result, we infer a concentration of C in Ceres’
regolith up to ~20 wt% (Table
1
), or more than 5 times higher than
in the most C-rich chondrites
28, similar to the amount inferred by
ref.
23. Such high concentration implies that either the bulk Ceres
accreted ultra C-rich materials, and/or that C has been concentrated
in its crust. Reaction-path calculations have shown that a wide
range of organic compounds are expected to form during aqueous
alteration (for example, refs
29,30). Ceres’ inferred mineral
assem-blages are compatible with a global-scale event of aqueous alteration
associated with widespread organic chemistry.
Methods
Collisional models. A suite of about 1,000 Monte Carlo simulations were run to track the timing and magnitude of all collisions with impactors larger than 2 km in diameter. The simulations start at 4.55 Gyr before present and run to the present time. Impactor sizes are drawn randomly from the size-frequency distribution of current main belt asteroids. The number of collisions per unit time is assumed to be directly proportional to the mass of the main belt. The latter is extrapolated back in time assuming two major evolutionary phases33: the so-called late heavy
bombardment (LHB; ~4.1–4.2 Gyr ago) and the primordial depletion (> 4.4 Gyr ago). During the LHB, the main belt was depleted by a factor of 4–5; while the primordial depletion removed ~95–98% of the original mass33. The adopted model
has been calibrated to reproduce the number of observed large craters on Vesta33.
Although it is uncertain whether Ceres formed in situ or was implanted at a later time, recent dynamical simulations have shown that it is very unlikely that Ceres was implanted during or after the LHB34. This result justifies our assumption of
4.55 Gyr of collisional evolution in the main belt. Our results are consistent (within a factor of 2) with a recent model (F. Roig, personal communication), which also includes different timing of the LHB.
For each simulation, we compute the total mass (or equivalent impactor size) of all infalling asteroids (Fig. 1). The average mass of all impactors is 3.8 × 10¹⁹ kg. As a reference, Ceres’ mass is 9.4 × 10²⁰ kg.
The above estimates do not consider that collisions may result in partial accretion of the impactor due to Ceres’ relatively low escape speed. Accretion models based on iSALE
(ref. 8) and SPH simulations35 show that about 70% of
impactor material is accreted. Based on our iSALE simulations, we also estimate that about 50% of the impactor is buried at a depth of several kilometres and thus does not contribute to surface contamination. Also, we did not include any cometary contribution to the bombardment that may have delivered additional mass during the LHB, nor the long-term accretion of dust-sized particles. The latter could be the result of asteroidal collisional grinding or cometary emissions.
An important parameter is the mixing scale of the accreted material. This is assessed by considering only the fraction of projectile material that is entrained with the ejecta. For this, we look at the largest putative crater on Ceres, the 800 km Vendimia Basin. Scaling laws result in an ejecta thickness of ~2–3 km at the rim36,
and here we adopted a conservative 4 km as an upper limit for ejecta mixing. To test our collisional model, we make a comparison to Vesta, for which we have constraints on the accreted mass based on the concentration of highly siderophile elements in howardite–eucrite–diogenite meteorites37. To do this, we
take the range computed for Ceres 20–175 wt% and rescale to Vesta. We consider a Vesta/Ceres impact flux ratio of ~2.5/3.6 (refs 6,38), and a different retention
factor for impactor of 70 km about ~0.4/0.9 (using the planetary collision online tool based on ref. 35). The mass balance also requires consideration of the bulk
density ratio of 1.25/2.90 (Ceres’ versus Vesta’s crust density). We also note that a significant fraction of the accreted mass (~2/3) is delivered early in Vesta’s history, which we assume may have not been efficiently retained in Vesta’s mantle. Thus, we predict the following mass has been accreted by Vesta after its solidification:
. × . × . ∕ . × . ~ Lower limit : 0 2 0 33 2 5 3 6 0 44 2 wt%
. × . × . ∕ . × . ~ Higher limit : 1 75 0 33 2 5 3 6 0 44 18 wt% Osmium in diogenite meteorites indicates the presence of exogenous contamination up to 1–2 wt% (ref. 37). The peculiarity of these rocks is that they
have likely been ejected during the formation of the large Rheasilvia Basin39. Under Q9
these circumstances, the excavation depth could have been up to a few tens of km. Petrological investigations constrain diogenite formation depth between 10 and 20 km (ref. 40). The latter depth would imply a contamination ranging from 0.4 to
4 wt%. In conclusion, our predictions for Vesta are compatible with observations. Our impact delivery model also has geophysical implications. For instance, the addition of high-viscosity materials to a weaker, volatile-rich crust could affect the overall topography relaxation properties5. However, combined relaxation and gravity
models suggest that the fraction of high viscosity phases in the bulk crust does not exceed 20 vol% (ref. 41). This implies that the crust contains low-density phases such
as clathrate hydrates, which are not expected to be stable in the near-surface. If the inferred CC-like material has an exogenous origin, this could result in stratification of Ceres’ crust, with less viscous material (delivered) closer to the surface. The grain density of our best model is 2,300 kg m–3, significantly higher than the inferred average 1,400 kg m–3 at a depth of several kilometres. This larger grain density may not be in contradiction with interior density models provided our composition is applicable to the top several kilometres layer, whose density cannot be constrained by gravity data. We point out that our model is valid for a dehydrated near-surface layer. Spectral mixing. Ceres’ visible and infrared spectral range is characterized by several diagnostic near-infrared absorption bands that can be used, together with spectral mixing models, to constrain the contamination of exogenous material. Ceres’ average and modelled spectra have been obtained using the Hapke model42
in standard geometry (incidence angle = 30°, emission angle = 0°) by taking into account the photometric parameters derived by ref. 43. We considered the infrared
channels of the VIR instrument to analyse the spectral range from 1.7 to 4.2 μ m. We primarily focus on end-member compositions for the exogenous material from ordinary chondrites and three main groups of carbonaceous chondrites meteorites. In all cases, we used spectra obtained from samples that have been processed to remove contamination from terrestrial water. We analyse separately CI (Ivuna type), two CMs (Mighei type), a CR (Renazzo type) and an OC (L5). Details and references for each type are in Supplementary Table 1.
For each meteorite spectrum, we computed an intimate mixture with the average Ceres, also varying the relative proportion of the two components. The resulting model abundance corresponds to the fraction of total cross-section of the exogenous grains over the total surface. Here we assume the grain size of contaminants (chondrites) are equal to those of the average material of Ceres surface, thus the abundance modelled is also a volume fraction. If we further assume the density of contaminants (chondrites) are equal to those of the average material of Ceres surface, then the volume abundance is also mass fraction (see next section). We compute an upper limit for chondrite contaminants by the higher percentage for which the modelled spectrum is entirely within the error bars of the measured average spectrum.
The resulting upper limits of exogenous contaminants are inferred to be approximately (in vol%): 7% OC, 20% CI, 8% CM, 8% CR (Supplementary Fig. 1). The higher upper limit for CI is due to their lower albedo and more neutral contribution with respect to other types of chondrites.
Our spectral mixing computations rely on the Ceres’ average spectrum, as defined by ref. 43. To obtain information on the mineralogy, we used a quantitative
spectral analysis of the composition using Hapke’s radiative transfer model42. The
whole formulation of the bidirectional reflectance (r) is:
π μ μ μ μ μ θ = + + ∕ ∕ − × r SSA K B p g H K H K S i e g 4 00 [ SH ( ) (SSA, ) (SSA, 0 ) 1] ( , , , ) (1)
hwere i, e and g are the incidence, emission and phase angles, respectively, and μ0
and μ are the cosines of the incidence and emission angles. The average spectrum is
defined in standard viewing geometry (i = 30°, e = 0°, g = 30°). The parameters that contain most of the spectral information are the single scattering albedo (SSA), and the related Ambartsumian–Chandrasekhar functions H(SSA, μ/K) describing the
multiple scattering components. Other parameters that describe the photometric behaviour as a function of the viewing geometry, especially the phase function, are: the single particle phase function p(g); the shadow hiding opposition effect BSH(g); the shadow function modelling large-scale roughness S(i, e, g, θ), with θ being the
average surface slope; the porosity parameter K, linked to the filling factor42.
These photometric parameters are defined after ref. 43. The SSAs have been
modelled for an intimate mixing between different minerals, which implies that the particles of the end-member materials are in contact with each other and are all involved in the scattering of a single photon. The SSA of each mineral is defined starting from their grain size and their optical constants, as described in ref. 42.
The optical constants are derived from laboratory measurements (Supplementary Table 2) with the method described by ref. 44. The average SSA of the regolith is
defined through the weight, p, which represents the relative abundances of the minerals. The weight pi is defined as the cross-section of the grains of the ith mineral as a fraction of the area. p is also a volume fraction, assuming grain sizes are equal for all minerals. Hereafter, we refer to the weight pi as ‘abundances’.
= p+ p + p+ . . . p p p+ + + . . . = SSA SSA1 1 SSA2 2 SSA3 3 with : 1 2 3 1 (2) Free model parameters to be retrieved by the fitting routine are: (1) abundances of the end-members and their grain sizes (assumed equal for all end-members);
A B
262
263
264
265
266
267
268
269
270
271
272
273
274
275
276
277
278
279
280
281
282
283
284
285
286
287
288
289
290
291
292
293
294
295
296
297
298
299
300
301
302
303
304
305
306
307
308
309
310
311
312
313
314
315
316
317
318
319
320
321
322
323
324
325
326
327
(2) a multiplicative constant of the absolute level of reflectance of the model to account for uncertainties in the radiometric and photometric accuracies, as well as other photometric effects; (3) temperature T and beaming function Λ (ref. 45).
The latter is free to vary in the range (0–1), and it is multiplied by the directional emissivity εd to obtain the effective emissivity (εeff) (see equation (3)). The beaming function accounts for effect of the roughness.
εeff= ×Λ ε εd; d= −1 SSA×H(SSA,μ∕K) (3)
The total radiance is modelled by accounting for the contributions of both the reflected sunlight and the thermal emission:
ε λ
= ×r F⊙+ ×
D B T
Rad 2 eff ( , ) (4)
where r is the Hapke bidirectional reflectance (equation (1)), Fʘ is the solar irradiance at 1 au, D is the heliocentric distance (in au) and B(λ, T) is the Planck
function. Thus, the estimation of the thermal emission to be removed is done simultaneously with the reflectance modelling to yield a consistent result between these two contributions to the total signal measured. The SSA is modelled starting from minerals previously identified1,13,14 (see Supplementary Table 2). Spectral
models are reported in radiance factor I/F = rπ .
In this work, we used the Hapke model to be directly comparable with recent Ceres’ literature. A limitation of the Hapke model is the uncertainty in deriving abundances, particularly for spectrally featureless dark components. In our work, these components are magnetite and amorphous carbon. We point out that these species are not spectrally neutral, but exhibit a significant slope in the infrared, which provides usual constraints to the spectral fit. In addition, it is important to note that in this work we take advantage of GRaND elemental data to further constrain Fe (magnetite) abundance. More in general, a systematic study46 found that the Hapke approach is adequate in modelling low albedo
mixtures. In addition, a detailed comparison47 of Ceres’ photometric properties
with a number of photometric models found that Hapke model is adequate for Ceres. Furthermore, a detailed comparison48 of laboratory spectra of various
mixtures with synthetic spectra derived from the Hapke model has shown that the difference is of the order of 10–20% for dark mixtures (comparable to Ceres’s albedo). The difference is further reduced if Hapke photometric parameters have been accurately characterized for the mixtures. We stress that in our modelling we used Hapke parameters specifically derived for Ceres from Dawn data43. In line
with previous publications (for example, refs 13,14), we acknowledge that retrieved
mineral abundances based on the Hapke model are uncertain by 10% of their values. In conclusion, these studies show that the applicability of the Hapke model to Ceres is acceptable, although a detailed study is beyond the scope of our work.
Elemental mixing. Dawn’s GRaND (ref. 49) measured the bulk elemental
composition of Ceres’ regolith to depths of several decimetres within broad surface regions (hundreds of kilometres spatial resolution4). The concentration of
hydrogen ranges from 16 to 29 wt% water-equivalent hydrogen. The distribution of hydrogen is longitudinally symmetric, increasing gradually from the equator to the poles. This indicates the presence of a global, subsurface ice table that contains about 10 wt% water ice. Ice-stability models predict that ice is present at depths greater than sensed by GRaND within about 20° of the equator. Thus, elemental measurements within this equatorial band can be compared with meteorite analogues and the mineralogy of the ‘optical’ surface (micrometres to millimetres) sensed by VIR. Equatorial average concentrations reported by ref. 4 are given
in Table 1. Carbon was detected by GRaND, and those measurements indicate the concentration of C within the ice-free regolith is greater than found in CI chondrites (Table 1). Measured Fe and H concentrations were fit by mixing a CI chondrite composition with a carbonaceous material, consisting of organics and carbonates. The analysis indicates up to 15 wt% C could be present in Ceres’ regolith23; however, quantitative comparisons with VIR data were
not made.
To compare GRaND elemental concentrations with VIR mineralogy, we estimated the concentration of elements from the fitted mineral component in spectral mixing ratios (Fig. 2). As in previous work4,21, these were interpreted as
mineral volume fractions. Given approximate empirical formulae of the minerals and the volume fractions, then the elemental weight fractions and mixture density can be calculated as:
ρ ρ φi=Gi i (5) ρ Σρ= i (6) ρ ρ = ∕ wi i (7) Σφ = 1i (8) Q10
where ρGi, ρi and φi are, respectively, the specific gravity (grain density), partial density, and volume fraction of the ith mineral in the mixture and ρ is the bulk
density of the mixture. If the mineral volume fractions sum to 1 (equation (8)), then the mineral weight fractions and mixture (regolith) density can be determined from equations (5–7). Elemental weight fractions were determined from structural formulae for the selected minerals (Supplementary Table 3). The elemental composition of CI chondrite is from ref. 31, with H adjusted to match
concentrations (14 wt% equivalent H2O) measured by mass spectrometry50. Space weathering of aliphatic organics. Bombardment of Ceres’ surface by solar energetic particles and radiation may destroy C–H bonds exposed at the surface. Here we estimate the rate of proton and ultraviolet flux destruction of aliphatic organics, following the approach of ref. 26, and references therein. We adopt a
steady-state bulk proton flux at Ceres of Fp ~ 107 H+ cm−2 s−1 for protons in the energy range 1–3 keV protons rescaled from available measurements in Earth’s proximity (M. Villarreal, personal communication; ref. 51). The estimated ultraviolet
photon flux at the top of Earth’s atmosphere is Fuv ~ 1.3 × 10¹⁰ photons cm−2 s−1 (ref. 52), which at Ceres corresponds to F
uv ~ 1.7 × 10⁹ photons cm−2 s−1. We neglect galactic cosmic rays and neutral hydrogen as they do not contribute significantly to C–H bond destruction at Ceres.
Then we use equation (13) of ref. 26 to compute the number of C–H bonds over
time, nCH(t). For this we used the following C–H bond destruction cross-sections:
σ = ×1 10 cm photon− − d,UV 19 2 1
σ = . ×2 9 10 cm per 30 keV proton−
d,p 15 2
These values were calculated for the hydrogenated carbon grains26 (referred to as
ACARL_H). ACARL_H has a H/C ~ 0.65. These destruction cross-section values may be dependent on the H/C of the material, so we are assuming that the ACARL_H grains are relevant to the material on Ceres. Here we rearranged the equation above to give nCH(t)/nCHmax (number of C–H bonds through time with respect to the maximum number of C–H bonds in the material), where nCHmax is assumed to be 1 (ref. 26). It is shown that the ratio n
CH/nCHmax differs from (H/C)/(H/C)max by < 3% if the maximum H/C value is less than or equal to 1 (ref. 53); thus, the previous quantity
is a good representation of the number of C–H bonds over time. Results are shown in Supplementary Fig. 3. We have chosen starting values of nCH/nCHmax equal to 1, 0.9 and 0.8. Since this equation was derived for the interstellar material, it is unclear how the presence of inorganic species (particularly H-bearing phyllosilicates) in a closely packed surface will affect this estimate. Further work is needed for more accurate estimates of C–H decay when exposed to space weathering on planetary surfaces (for instance, body rotation alone would increase the timescale by a factor of at least two due to self-shielding by spinning). The experimentally derived destruction cross-section for protons is for 30 keV protons, whereas the solar wind proton flux is for ~1 keV protons. We also assume that 1 MeV protons have a destruction cross-section 3.2× lower than 30 keV (ref. 26). If this is a linear relationship, we expect 1–3 keV
protons to have a destruction cross-section, that is, ~2.8× higher than the 30 keV protons or ~8 × 10⁻¹⁵ cm2 per proton. This results in a small variation of the decay time scale, and here we use the destruction cross-section for 30 keV.
Estimates of C–H decay from a more hydrogen-rich starting composition to H/C ~ 0.6 are of the order of 10–100 Myr based on the proton and ultraviolet flux at Ceres. If new material is exposed and subsequently buried at a fast rate, then significant amounts of hydrogen (for example, organics with higher H/C ratio) could have survived the space weathering environment. Whether this stratification of organics by H/C composition would remain given expected regolith mixing by impacts is an open question. However, if this is the case, the VIR instrument probing the surface chemistry at a depth of micrometres may see more amorphous/ aromatic carbon (for example, low H/C) material than the GRaND instrument, which integrates over the top metre of material. Therefore, organics may be compositionally stratified, with a surficial layer of low H/C material overlying material with greater hydrogen content at depth.
Data availability
The data that support the plots within this paper and other findings of this study are available from the corresponding author upon reasonable request.
Received: 7 June 2018; Accepted: 16 November 2018;
Published: xx xx xxxx
References
1. De Sanctis, M. C. et al. Ammoniated phyllosilicates with a likely outer Solar System origin on (1) Ceres. Nature 528, 241–244 (2015).
2. Ammannito, E. et al.
Distribution of phyllosilicates on the surface of Ceres.
Science 353, 1006 (2016).
3. Carrozzo, F. G. et al. Nature, formation, and distribution of carbonates on Ceres. Sci. Adv. 4, e1701645 (2018).
A B
328
329
330
331
332
333
334
335
336
337
338
339
340
341
342
343
344
345
346
347
348
349
350
351
352
353
354
355
356
357
358
359
360
361
362
363
364
365
366
367
368
369
370
371
372
373
374
375
376
377
378
379
380
381
382
383
384
385
386
387
388
389
390
391
392
393
Letters
Nature astroNomy
4. Prettyman, T. H. et al. Extensive water ice within Ceres’ aqueously altered regolith: evidence from nuclear spectroscopy. Science 355, 55–59 (2017). 5. Fu, R. R. et al. The interior structure of Ceres as revealed by surface
topography. Earth. Planet. Sci. Lett. 476, 153–164 (2017).
6. Marchi, S. et al. The missing large impact craters on Ceres. Nat. Commun. 7, 12257 (2016).
7. Castillo-Rogez, J. C. & McCord, T. B. Ceres’ evolution and present state constrained by shape data. Icarus 205, 443–459 (2010).
8. Bowling, T. et al.
Post-impact thermal structure and cooling timescales of occator crater on asteroid 1 Ceres. Icarus (in the press).
9. Daly, R. T. & Schultz, P. H. Predictions for impactor contamination on Ceres based on hypervelocity impact experiments. Geophys. Res. Lett. 42, 7890–7898 (2015).
10. DeMeo, F. E. & Carry, B. Solar System evolution from compositional mapping of the asteroid belt. Nature 505, 629–634 (2014).
11. McKinnon, W. B.
Where did Ceres accrete? In Proc. Conf. Asteroids, Comets,
Meteors 2012 abstr. 6475 (2012). http://www.lpi.usra.edu/meetings/acm2012/
pdf/6475.pdf
12. Kretke, K. A., Bottke, W. F., Levison, H. F. & Kring, D. A. Mixing of the asteroid belt due to the formation of the giant planets. In Proc. Conf. Accretion:
Building New Worlds 2017 LPI contribution no. 2043, id. 2027 (2017).
13. De Sanctis, M. C. et al. Bright carbonate deposits as evidence of aqueous alteration on (1) Ceres. Nature 536, 54–57 (2016).
14. De Sanctis, M. C. et al.
Science 355, 719–722 (2017).
15. Raponi, A. et al.
Mineralogical mapping of Coniraya quadrangle of the dwarf planet Ceres. Icarus https://doi.org/10.1016/j.icarus.2017.10.023 (in the press). 16. Raponi, A. et al. Mineralogy of Occator crater on Ceres and insight into its
evolution from the properties of carbonates, phyllosilicates, and chlorides.
Icarus https://doi.org/10.1016/j.icarus.2018.02.001 (in the press).
17. Kurokawa, H. et al. A Bayesian approach to deriving Ceres surface composition from Dawn VIR data: initial quantification of bright spot and typical dark material phases with this method.
(LPSC, 2018). 18. Howard, K. T., Alexander, C. M. O.’D., Schrader, D. L. & Dyl, K. A.
Classification of hydrous meteorites (CR, CM and C2 ungrouped) by phyllosilicate fraction: PSD-XRD modal mineralogy and planetesimal environments. Geochim. Cosmochim. Acta 149, 206–222 (2015).
19. King, A. J., Schofield, P. F., Howard, K. T. & Russell, S. S. Modal mineralogy of CI and CI-like chondrites by X-ray diffraction. Geochim. Cosmochim.
Acta 165, 148–160 (2015).
20. Castillo-Rogez, J. C. et al. Insights into Ceres’ evolution from surface composition. Meteorit. Planet. Sci. (in the press).
21. McSween H. Y. et al.
Carbonaceous chondrites as analogs for the composition and alteration of Ceres. Meteorit. Planet. Sci. (2017).
22. Hendrix, A. R., Vilas, F. & Li, J.-Y. Ceres: sulfur deposits and graphitized carbon. Geophys. Res. Lett. 43, 8920–8927 (2016).
23. Prettyman T. H. et al.
Elemental composition and mineralogy of Vesta and Ceres: distribution and origins of hydrogen-bearing species. Icarus https://doi. org/10.1016/j.icarus.2018.04.032 (in the press).
24. Kaplan, H. H., Milliken, R. E. & Alexander, C. M. O’D. New constraints on the abundance and composition of organic matter on Ceres.
Geophys. Res. Lett. 45, 5274–5282 (2018).
25. De Sanctis M. C. et al. Characteristics of organic matter on Ceres from VIR/Dawn high spatial resolution spectra. Mon. Not. R. Astron. Soc.
(in review).
26. Mennella, V., Baratta, G. A., Esposito, A., Ferini, G. & Pendleton, Y. J. The effects of ion irradiation on the evolution of the carrier of the 3.4 micron interstellar absorption band. Astrophys. J. 587, 727–738 (2003).
27. Godard, M. et al. Ion irradiation of carbonaceous interstellar analogues. Effects of cosmic rays on the 3.4 μ m interstellar absorption band. Astron. Astrophys. 529, A146 (2011).
28. Alexander, C. M. O. ‘D., Howard, K. T., Bowden, R. & Fogel, M. L. The classification of CM and CR chondrites using bulk H, C and N abundances and isotopic compositions. Geochim. Cosmochim. Acta 123, 244–260 (2013). 29. Schulte, M. & Shock, E. Coupled organic synthesis and mineral alteration on
meteorite parent bodies. Meteorit. Planet. Sci. 39, 1577–1590 (2004). 30. Vinogradoff, V., Bernard, S., Le Guillou, C. & Remusat, L. Evolution of
interstellar organic compounds under asteroidal hydrothermal conditions.
Icarus 305, 358–370 (2018).
31. Lodders & Fegley
The Planetary Companion (Oxford Univ. Press, Oxford,
1998).
32. Britt, D. T. & Consolmagno, G. J. Stony meteorite porosities and densities: a review of the data through 2001. Meteorit. Planet. Sci. 38, 1161–1180 (2003). 33. O’Brien, D. P. et al. Constraining the cratering chronology of Vesta. Planet.
Space. Sci. 103, 131–142 (2014).
34. Vokrouhlický, D., Bottke, W. F. & Nesvorný, D. Capture of trans-neptunian planetesimals in the main asteroid belt. Astron. J. 152, 20 (2016). article id. 39. 35. Leinhardt, Z. M. & Stewart, S. T. Collisions between gravity-dominated
bodies. I. Outcome regimes and scaling laws. Astrophys. J. 745, 79 (2012).
Q15 Q16 Q17 Q18 Q19 Q20 Q21 Q22 Q23 Q24
36. Marchi, S., Bottke, W. F., Kring, D. A. & Morbidelli, A. The onset of the lunar cataclysm as recorded in its ancient crater populations. Earth. Planet. Sci.
Lett. 325, 27–38 (2012).
37. Day, J. M. D., Walker, R. J., Qin, L. & Rumble, D. III Late accretion as a natural consequence of planetary growth. Nat. Geosci. 5, 614–617 (2012). 38. Marchi, S. et al. The violent collisional history of asteroid 4 Vesta. Science
336, 690 (2012).
39. Marchi, S. et al. High-velocity collisions from the lunar cataclysm recorded in asteroidal meteorites. Nat. Geosci. 6, 411 (2013).
40. Mandler, B. E. & Elkins-Tanton, L. T. The origin of eucrites, diogenites, and olivine diogenites: magma ocean crystallization and shallow magma chamber processes on Vesta. Meteorit. Planet. Sci. 48, 2333–2349 (2013).
41. Ermakov, A. I. et al. Constraints on Ceres’ internal structure and evolution from its shape and gravity measured by the dawn spacecraft. J. Geophys. Res.
Planets 122, 2267–2293 (2017).
42. Hapke, B. Theory of Reflectance and Emittance Spectroscopy 2nd edn (Cambridge Univ. Press, Cambridge, 2012).
43. Ciarniello, M. et al. Spectrophotometric properties of dwarf planet Ceres from the VIR spectrometer on board the Dawn mission. Astron. Astrophys. 598, A130 (2017).
44. Carli, C., Ciarniello, M., Capaccioni, F., Serventi, G. & Sgavetti, M. Spectral variability of plagioclase-mafic mixtures (2): investigation of the optical constant and retrieved mineral abundance dependence on particle size distribution. Icarus 235, 207–219 (2014).
45. Davidsson B. J. R., Gutierrez P. J. & Rickman H. Icarus 201, 335 (2009). 46. Ciarniello, M., Capaccioni, F. & Filacchione, G. A test of Hapke’s model by
mean of Monte Carlo ray-tracing. Icarus 237, 293–305 (2014).
47. Schröder, S. E. et al. Resolved spectrophotometric properties of the Ceres surface from Dawn Framing Camera images. Icarus 288, 201–225 (2017). 48. Mustard, J. F. & Pieters, C. M. Photometric phase functions of common
geologic minerals and applications to quantitative analysis of mineral mixture reflectance spectra. J. Geophys. Res. 94, 13619–13634 (1989).
49. Prettyman, T. H. et al. Dawn’s gamma ray and neutron detector. Space Sci. Rev. 163, 371–459 (2011).
50. Alexander, C. M. O.’D. et al. The provenances of asteroids, and their contributions to the volatile inventory of the terrestrial planets. Science 337, 721–723 (2012).
51. Villarreal, M. N. et al. The dependence of the Cerean exosphere on solar energetic particle events. Astrophys. J. Lett. 838, L8 (2017).
52. Judge, D. L., McMullin, D. R. & Ogawa, H. S. Absolute solar 30.4 nm flux from sounding rocket observations during the solar cycle 23 minimum. J.
Geophys. Res. 104, 28321–28324 (1999).
53. Mennella, V., Brucato, J., Colangeli, L., Palumbo., P. & Bond, C.-H. Formation in carbon grains by exposure to atomic hydrogen: the evolution of the carrier of the interstellar 3.4 micron band. Astrophys. J. 569, 531–540 (2002). 54. Takir, D. et al. Nature and degree of aqueous alteration in CM and CI
carbonaceous chondrites. Meteorit. Planet. Sci. 48, 1618–1637 (2013). 55. Zubko, V. G. et al. Optical constants of cosmic carbon analogue grains—I.
Simulation of clustering by a modified continuous distribution of ellipsoids.
Mon. Not. R. Astron. Soc. 282, 1321–1329 (1996).
56. Gautier, M., Muller, F., Le Forestier, L., Beny, J. M. & Guegan, R. NH4 -smectite: characterization, hydration properties and hydro mechanical behaviour. Appl. Clay Sci. 49, 247–254 (2010).
57. Roberts W. L., Campbell T. J. & Rapp G. R.
Encyclopedia of Minerals (Van Nostrand Reinhold, 1990).
Acknowledgements
This work was supported by the NASA Dawn project. We thank H. Y. McSween, B. L.
Ehlmann and M. Villarreal for their insightful comments.
Author contributions
S.M. conceived the work. A.R., M.C.D.S., E.A., M.C., H.K. and E.P. provided spectral
models. T.H.P. and N.Y. provided elemental models. All authors contributed to the interpretation of the results and to the writing of the manuscript.
Competing interests
The authors declare no competing interests.
Additional information
Supplementary information is available for this paper at https://doi.org/10.1038/ s41550-018-0656-0.
Reprints and permissions information is available at www.nature.com/reprints. Correspondence and requests for materials should be addressed to S.M.
Publisher’s note: Springer Nature remains neutral with regard to jurisdictional claims in published maps and institutional affiliations.
© The Author(s), under exclusive licence to Springer Nature Limited 2018
Q25
Q11
Q12