This is an Accepted Manuscript of an article published in Global
Crime on 13 February 2011, available online:
http://www.tandfonline.com/10.1080/17440572.2011.548962
Where is the mafia in Italy? Measuring the presence of the mafia
across Italian provinces
Francesco Calderoni
Università Cattolica del Sacro Cuore and Transcrime, Milan, Italy
Abstract This article presents the Mafia Index (MI), an index measuring the presence of mafias at the provincial level.
In the abundant literature on Italian mafias, relatively few studies have attempted to measure the presence of mafias across the country. A review of previous attempts points out the limitations and methodological shortcomings of existing measurements.
The study provides an operational definition of ‘mafia’ and selects the most appropriate indicators and variables according to multiple criteria. The MI combines data on mafia-type associations, mafia murders, city councils dissolved for infiltration by organised crime, and assets confiscated from organised crime and covers the period between 1983 and 2009. The MI
highlights the strong concentration of the mafias in their original territories, but also their significant presence in central and northern provinces. This confirms that mafias should not be regarded as typically southern Italian phenomena, but rather as a national problem.
Keywords: mafia; mafias; organised crime; data; index; Italy; Italian provinces; measurement
Introduction
Among the Italian words best-known in the world, mafia is surely the most infamous. Among Italy’s many achievements, being the country of origin of the mafias is
certainly the most inglorious.1 Italy also has primacy in literary and scientific production on mafias. The Italian literature on the mafia is so abundant that it could fill an entire library.2 Surprisingly, however, a relatively small number of studies and publications have attempted to measure the presence of mafias on the Italian territory. This may appear remarkable, for the analysis of a problem is a key step towards solving it. An appropriate analysis requires reliable data and information. But the unavailability of direct and easily accessible data should not preclude attempts to estimate problems, with a view to improving knowledge about them and consequently to devising solutions. Probably, better data and information sharing, and therefore better measurements, could contribute to Italy’s efforts to prevent mafias or to enforce
the law against them.
1
For the purpose of this study, ‘mafias’ refers not only to the Sicilian Mafia but also to other criminal groups which share some significant features with the latter (although they are not the same phenomenon). Traditionally there are four main mafias in Italy: besides the Sicilian Mafia, there are the Camorra, the ‘Nrangheta and the Sacra Corona Unita. Some authors talk of a “fifth” mafia, referring to criminal phenomena exhibiting some of the significant features of the four main groups. This denomination has been applied to criminal groups in Sicily, Sardinia, Basilicata and Veneto (see for example, Bascietto, Stidda. La quinta mafia, i boss, gli affari, i rapporti con la politica; Sergi, Gli anni dei basilischi.In general, the category ‘mafias’ is widely accepted in the Italian literature (where mafie is the plural form of the word. See Santino, Dalla Mafia Alle Mafie; Fiandaca and Costantino, La Mafia, Le Mafie; Sciarrone, Mafie vecchie, mafie nuove; Pezzino, Le mafie.) and at the international level (usually including other phenomena such as the Yakuza, the Triads and the so-called Russian Mafia. See, for example, Varese, “How Mafias Migrate”; Naylor, “Mafias, Myths, and Markets: On the Theory and Practice of Enterprise Crime.”). Moreover, it is customary to apply the term ‘mafia’ (in the singular) to criminal organizations other than the Sicilian Mafia.
In Italy, the allocation of other similar criminal groups to the category ‘mafia’ also occurs in criminal law. The last paragraph of Article 416-bis of the Italian Criminal Code (mafia-type association) explicitly states: “the provisions above apply also to the camorra, the ‘ndrangheta and other associations, however known or called, even foreign, which use the intimidatory power of the group to achieve the goals typical of a mafia-type association”.
2
Several publications have exclusively focused on compiling bibliographies on the mafia. See Chindemi and Corso, Bibliografia Sulla Mafia; Dioguardi, Bibliografia Sulla Mafia, 1987-2000; Lanfranchini and Marin, Per Conoscere La Mafia; Mercadante, Mafia: Bibliografia ragionata; Bedotto, Mafie: Panorama bibliografico (1945-1993). As far as possible, this article will cite and refer to English publications (either original works or translations from Italian). However, most references will inevitably be to Italian works.
The aim of this article is to contribute to the existing measurements of the presence of mafias across the Italian territory. It presents and discusses the Mafia Index (MI hereinafter), which is a composite index measuring the presence of mafias at the provincial level in Italy.
The following section (Section 1) discusses the shortcomings of the existing measurements of mafias in Italy, reviewing the most recent attempts to create indexes of the presence of mafias and/or organised crime. The article then presents the
methodology used to create the Mafia Index (Section 2). The MI is analysed and discussed in Section 3. Section 4 concludes.
1. Analysis of existing attempts to measure the presence of mafias and organised crime in Italy
This section briefly reviews reports and scientific studies seeking to measure mafias and/or organised crime in Italy (1.1). It highlights that most of the existing
measurements have significant shortcomings and that there is a need for a new and better index (1.2.).
1.1. The most recent measurements of mafia and organised crime in Italy
A review of the current state of the art in measurement of the presence of the mafias and/or organised crime in Italy points up problems and difficulties with the existing measurement exercises.3 This review focuses on the overall aim of the studies and on the measurement methodology adopted.
3
For the sake of brevity this article focuses only on contributions published in the past five years.
The Organised crime index by ISTAT
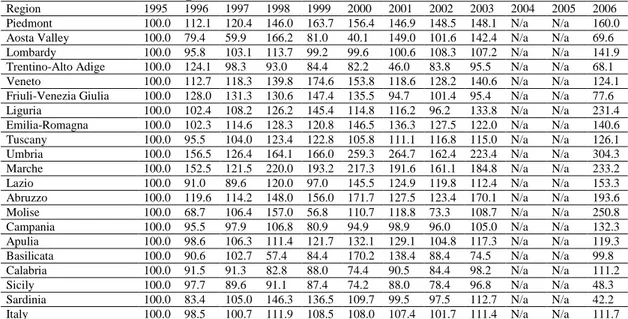
The Italian National Institute of Statistics (ISTAT) has created an organised crime index (OCI)4 whose purpose is to support the evaluation of public policies to reduce socio-economic disparities in Southern Italy. The ISTAT index includes data on a wide variety of crimes at regional5 level from 1995 to 2006 (although data for 2004 and 2005 are missing).6 ISTAT calculates the OCI by summing the absolute values for each crime weighted for the average statutory penalty. The OCI is parameterised to 1995 (1995=100). Table 1 reports the OCI for all Italian regions.
4
ISTAT, “B. Indicatori di contesto chiave e variabili di rottura.”
5
In Italy, regions are the highest level of local administration. As a consequence of progressive legislative reforms, regions have acquired significant powers and autonomy, including legislative competence on a wide variety of matters. There are twenty Italian regions, and their number did not change during the time period covered by this study.
6
ISTAT has adopted the operational definition of organised crime used by the Italian
Ministry of the Interior. The definition comprises mafia murders, bomb or fire attacks, arsons, serious robberies (e.g. bank or post offices). The source of the data is the operational database of the Italian law enforcement agencies. Until 2003 this database was known as “modello 165”, while since 2004 a new system (“SDI”, acronym for Sistema di Indagine) has replaced the previous one.
Table 1. The ISTAT Organised Crime Index
Region 1995 1996 1997 1998 1999 2000 2001 2002 2003 2004 2005 2006
Piedmont 100.0 112.1 120.4 146.0 163.7 156.4 146.9 148.5 148.1 N/a N/a 160.0 Aosta Valley 100.0 79.4 59.9 166.2 81.0 40.1 149.0 101.6 142.4 N/a N/a 69.6 Lombardy 100.0 95.8 103.1 113.7 99.2 99.6 100.6 108.3 107.2 N/a N/a 141.9 Trentino-Alto Adige 100.0 124.1 98.3 93.0 84.4 82.2 46.0 83.8 95.5 N/a N/a 68.1 Veneto 100.0 112.7 118.3 139.8 174.6 153.8 118.6 128.2 140.6 N/a N/a 124.1 Friuli-Venezia Giulia 100.0 128.0 131.3 130.6 147.4 135.5 94.7 101.4 95.4 N/a N/a 77.6 Liguria 100.0 102.4 108.2 126.2 145.4 114.8 116.2 96.2 133.8 N/a N/a 231.4 Emilia-Romagna 100.0 102.3 114.6 128.3 120.8 146.5 136.3 127.5 122.0 N/a N/a 140.6 Tuscany 100.0 95.5 104.0 123.4 122.8 105.8 111.1 116.8 115.0 N/a N/a 126.1 Umbria 100.0 156.5 126.4 164.1 166.0 259.3 264.7 162.4 223.4 N/a N/a 304.3 Marche 100.0 152.5 121.5 220.0 193.2 217.3 191.6 161.1 184.8 N/a N/a 233.2 Lazio 100.0 91.0 89.6 120.0 97.0 145.5 124.9 119.8 112.4 N/a N/a 153.3 Abruzzo 100.0 119.6 114.2 148.0 156.0 171.7 127.5 123.4 170.1 N/a N/a 193.6 Molise 100.0 68.7 106.4 157.0 56.8 110.7 118.8 73.3 108.7 N/a N/a 250.8 Campania 100.0 95.5 97.9 106.8 80.9 94.9 98.9 96.0 105.0 N/a N/a 132.3 Apulia 100.0 98.6 106.3 111.4 121.7 132.1 129.1 104.8 117.3 N/a N/a 119.3 Basilicata 100.0 90.6 102.7 57.4 84.4 170.2 138.4 88.4 74.5 N/a N/a 99.8
Calabria 100.0 91.5 91.3 82.8 88.0 74.4 90.5 84.4 98.2 N/a N/a 111.2
Sicily 100.0 97.7 89.6 91.1 87.4 74.2 88.0 78.4 96.8 N/a N/a 48.3
Sardinia 100.0 83.4 105.0 146.3 136.5 109.7 99.5 97.5 112.7 N/a N/a 42.2 Italy 100.0 98.5 100.7 111.9 108.5 108.0 107.4 101.7 111.4 N/a N/a 111.7
Source: ISTAT 2010
The Eurispes Mafia Penetration Index
The Institute of Political, Economic and Social Studies (Eurispes) created the Indice
di penetrazione mafiosa7 (IPM) in 2004.8 The aim of the IPM is to measure the level of permeability of a given territory to organised crime.9
The 2004 and 2005 editions of the IPM focused only on the provinces of Calabria.10 The IPM includes several socio-economic variables.11 For each indicator,
7
Mafia penetration index.
8
Eurispes, 16° Rapporto Italia 2004.
9
Ibid., 425.
10
In Italy, provinces are mid-level administrative units. They have particular importance from a criminological point of view because law enforcement agencies are frequently organised on a provincial basis. Until 1992 there were 95 provinces. In 1992, 7 provinces were created (Verbano-Cusio-Ossola, Biella, Lecco, Lodi, Rimini, Prato, Crotone, Vibo Valentia), bringing the total to 103 provinces. In 2001, 4 new provinces were created in Sardinia (Olbia-Tempio, Ogliastra, Medio Campidano and Carbonia-Iglesias) and implemented in 2004. In 2004, 3 new provinces were created (Monza e della Brianza, Fermo and Barletta-Andria-Trani) and were implemented in 2009. This study is based on crime statistics. These refer, for the 1983-1995 period, to the pre-1992 set of 95 provinces for which data are available since 1996 (due to a lag in adaptation of the data collection procedures) For the 1996-onward period, the study refers to the set of 103 provinces, once again owing to lags in adaptation of the data collection procedures.
the province with the highest value (i.e. the worst situation) receives a score of 10. The other provinces receive decreasing scores according to their rank among all the provinces analysed. The sum of the scores provides the value of the IPM. Eurispes did not calculate the IPM in 2006.
In 2007 and 2008 Eurispes extended the measurement of the IPM to the four Italian regions with a traditional presence of mafia-type groups (Apulia, Calabria, Campania and Sicily, see footnote 1) and modified the indicators.12 In 2009 Eurispes did not calculate the IPM.
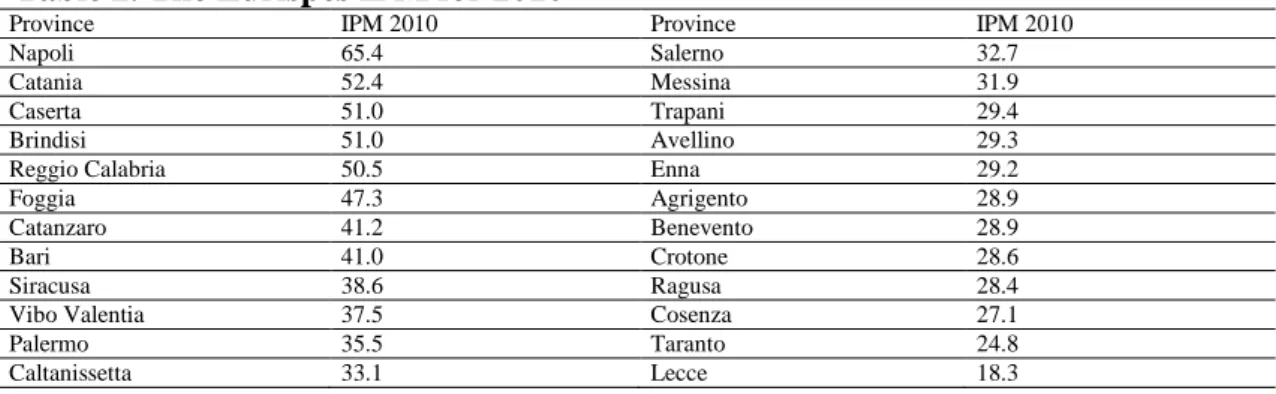
The IPM changed once again in 2010. It now includes only the rates for a number of offences attributable to mafia-type associations.13 The IPM covers the 24 provinces of the regions with a traditional presence of mafias, and the year 2008. For each offence, the province with the highest rate receives a score of 7.7. The other provinces receive a score proportional to their rate. The sum of the scores on each offence yields the IPM. Table 2 reports the IPM for 2010.
11
Unemployment rate, trust in the institutions, crime rates for offences committed by mafia-type associations (extortion, smuggling, drug production, drug possession and drug dealing, criminal association, mafia-type association, exploitation of prostitution, handling stolen goods), city councils dissolved for mafia infiltration, intimidatory acts against local administrators and, only for IPM 2005, mafia murders.
12
Unemployment rate, crimes attributable to mafia associations per 10,000 inhabitants (sum of extortion, drug production, possession and dealing, mafia-type association, exploitation and facilitation of prostitution, handling stolen goods, bomb and fire attacks), mafia murders per 10,000 inhabitants, city councils dissolved for mafia infiltration (absolute values), number of episodes of terrorism or political violence (absolute values) and number of phone
interceptions in the provinces (absolute values). Eurispes, 20° Rapporto Italia 2008, 470.
13
Bomb or fire attacks, mass murders, handling stolen goods, robberies, extortions, usury, kidnap for ransom, mafia-type association, money-laundering, smuggling, drug production and trafficking, exploitation and facilitation of prostitution, mafia murders. Eurispes, 22° Rapporto Italia 2010, 597.
Table 2. The Eurispes IPM for 2010
Province IPM 2010 Province IPM 2010
Napoli 65.4 Salerno 32.7
Catania 52.4 Messina 31.9
Caserta 51.0 Trapani 29.4
Brindisi 51.0 Avellino 29.3
Reggio Calabria 50.5 Enna 29.2
Foggia 47.3 Agrigento 28.9
Catanzaro 41.2 Benevento 28.9
Bari 41.0 Crotone 28.6
Siracusa 38.6 Ragusa 28.4
Vibo Valentia 37.5 Cosenza 27.1
Palermo 35.5 Taranto 24.8
Caltanissetta 33.1 Lecce 18.3
Source: Eurispes 2010
The analyses by Censis
The Centro Studi Investimenti Sociali (Censis) has performed two analyses to measure the presence of organised crime in a territory.14
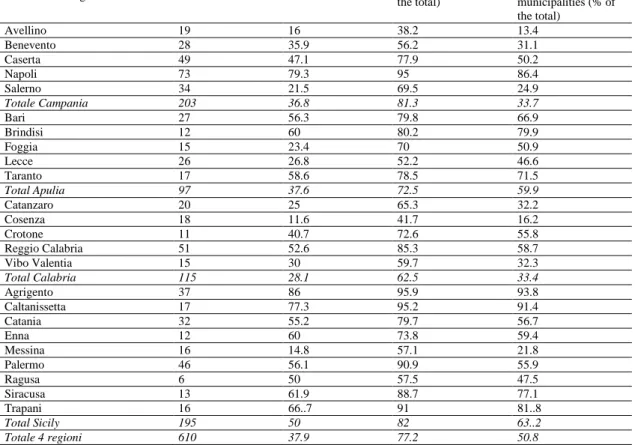
The first analysis (see Table 3) measured the presence of mafia-type organizations using three proxy indicators,15 and it covered the four Italian regions with a traditional presence of mafia-type groups and a time period of three years, probably from 2004 to 2006.16 It calculated the number of municipalities exhibiting at least one of the above-mentioned ‘contiguity signs’ per province, as well as their percentage on the total number of municipalities, their population on the total provincial population, and their land area on the total provincial area.17
14
Censis, Il condizionamento delle mafie sull’economia, sulla società e sulle istituzioni del Mezzogiorno.
15
Mafia “clans” identified in reports by the Ministry of Interior and by the Anti-camorra Observatory of the Campania region, the number of city councils dissolved for mafia infiltration and the number of assets confiscated from organised crime.
16
The study does not clearly state the time span of the data.
17
Censis, Il condizionamento delle mafie sull’economia, sulla società e sulle istituzioni del Mezzogiorno, 10.
Table 3. Censis measurements of mafias’ presence Province and region
Affected municipalities Population in affected municipalities (% of the total)
Surface area of the affected municipalities (% of the total) Absolute values % Avellino 19 16 38.2 13.4 Benevento 28 35.9 56.2 31.1 Caserta 49 47.1 77.9 50.2 Napoli 73 79.3 95 86.4 Salerno 34 21.5 69.5 24.9 Totale Campania 203 36.8 81.3 33.7 Bari 27 56.3 79.8 66.9 Brindisi 12 60 80.2 79.9 Foggia 15 23.4 70 50.9 Lecce 26 26.8 52.2 46.6 Taranto 17 58.6 78.5 71.5 Total Apulia 97 37.6 72.5 59.9 Catanzaro 20 25 65.3 32.2 Cosenza 18 11.6 41.7 16.2 Crotone 11 40.7 72.6 55.8 Reggio Calabria 51 52.6 85.3 58.7 Vibo Valentia 15 30 59.7 32.3 Total Calabria 115 28.1 62.5 33.4 Agrigento 37 86 95.9 93.8 Caltanissetta 17 77.3 95.2 91.4 Catania 32 55.2 79.7 56.7 Enna 12 60 73.8 59.4 Messina 16 14.8 57.1 21.8 Palermo 46 56.1 90.9 55.9 Ragusa 6 50 57.5 47.5 Siracusa 13 61.9 88.7 77.1 Trapani 16 66..7 91 81..8 Total Sicily 195 50 82 63..2 Totale 4 regioni 610 37.9 77.2 50.8 Source: Censis 2009
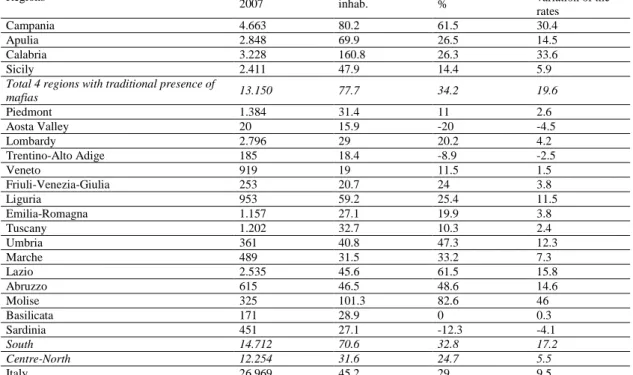
The second analysis (see Table 4) by Censis measured the presence of offences ‘directly attributable to organised crime’18
in the Italian regions and in the provinces of the four Italian regions with a traditional presence of mafia-type
groups.19 The analysis covered the time period 2004-2007 and calculated the sum of the offences and the rates per 100,000 inhabitants. Moreover, for each offence, the analysis calculated the provincial rates per 100,000 inhabitants, comparing the 2007 data with the 2004 or 1998 data.20
18
-type associations, money-laundering, arson, smuggling, association for drug production and trafficking, association for drug dealing.
19
Censis, Il condizionamento delle mafie sull’economia, sulla società e sulle istituzioni del Mezzogiorno, 13.
20
Table 4. Organised crime offences by Censis
Regions Absolute values
2007 Rates per 100.000 inhab. Trend 2004-2007 % variation of the rates Campania 4.663 80.2 61.5 30.4 Apulia 2.848 69.9 26.5 14.5 Calabria 3.228 160.8 26.3 33.6 Sicily 2.411 47.9 14.4 5.9
Total 4 regions with traditional presence of
mafias 13.150 77.7 34.2 19.6 Piedmont 1.384 31.4 11 2.6 Aosta Valley 20 15.9 -20 -4.5 Lombardy 2.796 29 20.2 4.2 Trentino-Alto Adige 185 18.4 -8.9 -2.5 Veneto 919 19 11.5 1.5 Friuli-Venezia-Giulia 253 20.7 24 3.8 Liguria 953 59.2 25.4 11.5 Emilia-Romagna 1.157 27.1 19.9 3.8 Tuscany 1.202 32.7 10.3 2.4 Umbria 361 40.8 47.3 12.3 Marche 489 31.5 33.2 7.3 Lazio 2.535 45.6 61.5 15.8 Abruzzo 615 46.5 48.6 14.6 Molise 325 101.3 82.6 46 Basilicata 171 28.9 0 0.3 Sardinia 451 27.1 -12.3 -4.1 South 14.712 70.6 32.8 17.2 Centre-North 12.254 31.6 24.7 5.5 Italy 26.969 45.2 29 9.5 Source: Censis 2009
Other contributions in the literature
Some contributions in the literature have sought to measure the presence of mafias in Italy. There follows a rapid review of the most recent studies, focusing exclusively on their attempts to create indexes measuring the presence of mafias and/or organised crime.
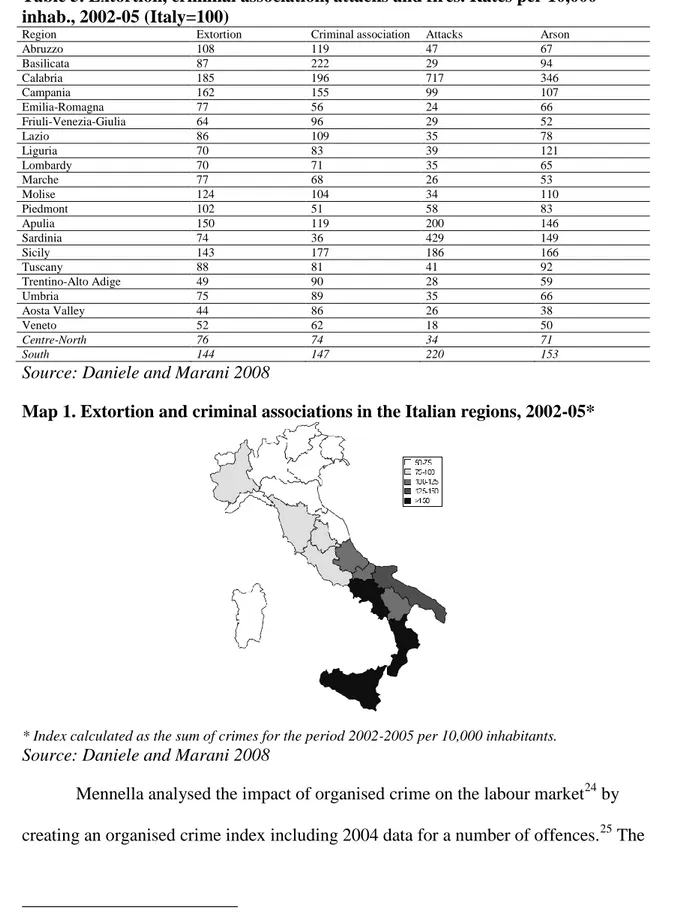
Daniele and Marani analysed the relation between organised crime and foreign direct investments (FDI).21 Used as indicators by the study were criminal associations and mafia-type associations, fire or bomb attacks, arsons and extortions at the
provincial and regional level for the period 2002-2005.22 However the bulk of the analysis of the relation between FDI and organised crime used 2002-2004 data for all four crimes (see Table 5) and created an organised crime index representing the ‘the
21
Daniele and Marani, “Organized crime, the quality of local institutions and FDI in Italy.”
22
sum of extortion and mafia-type association crimes per 10,000 inhabitants’ (see Table 5. Extortion, criminal association, attacks and fires. Rates per 10,000 inhab., 2002-05 (Italy=100)
Region Extortion Criminal association Attacks Arson
Abruzzo 108 119 47 67 Basilicata 87 222 29 94 Calabria 185 196 717 346 Campania 162 155 99 107 Emilia-Romagna 77 56 24 66 Friuli-Venezia-Giulia 64 96 29 52 Lazio 86 109 35 78 Liguria 70 83 39 121 Lombardy 70 71 35 65 Marche 77 68 26 53 Molise 124 104 34 110 Piedmont 102 51 58 83 Apulia 150 119 200 146 Sardinia 74 36 429 149 Sicily 143 177 186 166 Tuscany 88 81 41 92 Trentino-Alto Adige 49 90 28 59 Umbria 75 89 35 66 Aosta Valley 44 86 26 38 Veneto 52 62 18 50 Centre-North 76 74 34 71 South 144 147 220 153
Source: Daniele and Marani 2008
).23
23
Table 5. Extortion, criminal association, attacks and fires. Rates per 10,000 inhab., 2002-05 (Italy=100)
Region Extortion Criminal association Attacks Arson
Abruzzo 108 119 47 67 Basilicata 87 222 29 94 Calabria 185 196 717 346 Campania 162 155 99 107 Emilia-Romagna 77 56 24 66 Friuli-Venezia-Giulia 64 96 29 52 Lazio 86 109 35 78 Liguria 70 83 39 121 Lombardy 70 71 35 65 Marche 77 68 26 53 Molise 124 104 34 110 Piedmont 102 51 58 83 Apulia 150 119 200 146 Sardinia 74 36 429 149 Sicily 143 177 186 166 Tuscany 88 81 41 92 Trentino-Alto Adige 49 90 28 59 Umbria 75 89 35 66 Aosta Valley 44 86 26 38 Veneto 52 62 18 50 Centre-North 76 74 34 71 South 144 147 220 153
Source: Daniele and Marani 2008
Map 1. Extortion and criminal associations in the Italian regions, 2002-05*
* Index calculated as the sum of crimes for the period 2002-2005 per 10,000 inhabitants.
Source: Daniele and Marani 2008
Mennella analysed the impact of organised crime on the labour market24 by creating an organised crime index including 2004 data for a number of offences.25 The
24
Mennella, “Reti sociali, criminalità organizzata e mercati locali del lavoro.”
25
Criminal association, mafia-type association, slaughter, bomb and fire attacks, mafia murders, extortions, arsons, handling stolen goods, usury, drug crimes, exploitation and facilitation of prostitution.
index summed the crimes and then calculated the provincial rates per 1,000 inhabitants.
Lavezzi analysed the structure of the Sicilian economy compared to those of other Italian regions in order to highlight the importance of factors favourable to organised crime (large size of the construction sector, large number of small firms, low level of technology, and a large public sector).26 Lavezzi acknowledged the limits of his study in estimating the presence of the mafia, which was measured with a dummy for Sicily.27
Caruso focused on the relation between organised crime and economic life in Italian regions.28 His study adopted the OCI compiled by ISTAT.
Centorrino and Ofria analysed the relation between organised crime and labour productivity in Italian regions.29 For each region, the proxy measure for organised crime was mafia murders from 1983 to 2005 on the total population.
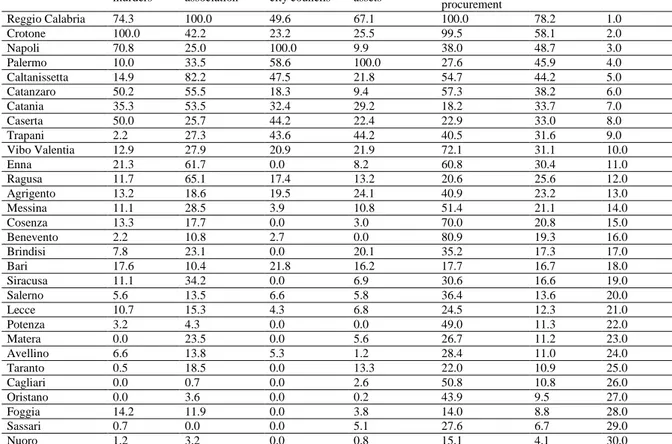
Calderoni and Caneppele sought to measure the extent of infiltration by mafia in public procurement in the provinces of Southern Italy.30 The study created a criminal context index (indice di contesto criminale or ICC) consisting of five indicators intended to yield multiple information on mafia infiltration of public
26
Lavezzi, “Economic structure and vulnerability to organised crime.”
27
The dummy should help explain the greater relevance of specific economic sectors in areas with a presence of organised crime.
28
Caruso, Spesa pubblica e criminalità organizzata in Italia: evidenza empirica su dati panel nel periodo 1997-2003.
29
Centorrino and Ofria, “Criminalità organizzata e produttività del lavoro nel Mezzogiorno.”
30
procurement.31 For each indicator, the province with the highest rate received a score of 100. The other provinces were scored proportionally.32 The ICC was the mean of the scores of the five indicators (Table 6).
Table 6. Calderoni and Caneppele’s ICC
Provinces Mafia murders Mafia-type association Dissolution of city councils Confiscated assets Offences relating to public procurement ICC Rank Reggio Calabria 74.3 100.0 49.6 67.1 100.0 78.2 1.0 Crotone 100.0 42.2 23.2 25.5 99.5 58.1 2.0 Napoli 70.8 25.0 100.0 9.9 38.0 48.7 3.0 Palermo 10.0 33.5 58.6 100.0 27.6 45.9 4.0 Caltanissetta 14.9 82.2 47.5 21.8 54.7 44.2 5.0 Catanzaro 50.2 55.5 18.3 9.4 57.3 38.2 6.0 Catania 35.3 53.5 32.4 29.2 18.2 33.7 7.0 Caserta 50.0 25.7 44.2 22.4 22.9 33.0 8.0 Trapani 2.2 27.3 43.6 44.2 40.5 31.6 9.0 Vibo Valentia 12.9 27.9 20.9 21.9 72.1 31.1 10.0 Enna 21.3 61.7 0.0 8.2 60.8 30.4 11.0 Ragusa 11.7 65.1 17.4 13.2 20.6 25.6 12.0 Agrigento 13.2 18.6 19.5 24.1 40.9 23.2 13.0 Messina 11.1 28.5 3.9 10.8 51.4 21.1 14.0 Cosenza 13.3 17.7 0.0 3.0 70.0 20.8 15.0 Benevento 2.2 10.8 2.7 0.0 80.9 19.3 16.0 Brindisi 7.8 23.1 0.0 20.1 35.2 17.3 17.0 Bari 17.6 10.4 21.8 16.2 17.7 16.7 18.0 Siracusa 11.1 34.2 0.0 6.9 30.6 16.6 19.0 Salerno 5.6 13.5 6.6 5.8 36.4 13.6 20.0 Lecce 10.7 15.3 4.3 6.8 24.5 12.3 21.0 Potenza 3.2 4.3 0.0 0.0 49.0 11.3 22.0 Matera 0.0 23.5 0.0 5.6 26.7 11.2 23.0 Avellino 6.6 13.8 5.3 1.2 28.4 11.0 24.0 Taranto 0.5 18.5 0.0 13.3 22.0 10.9 25.0 Cagliari 0.0 0.7 0.0 2.6 50.8 10.8 26.0 Oristano 0.0 3.6 0.0 0.2 43.9 9.5 27.0 Foggia 14.2 11.9 0.0 3.8 14.0 8.8 28.0 Sassari 0.7 0.0 0.0 5.1 27.6 6.7 29.0 Nuoro 1.2 3.2 0.0 0.8 15.1 4.1 30.0
Source: Calderoni and Caneppele 2009
1.2. Analysis of existing attempts to measure the mafia in Italy
Based on the foregoing brief review of existing attempts to measure the presence of mafia in Italy, this subsection analyses the current state of the art and identifies the problems with such research.
31
Rates of mafia murder 1996-2004; rates of mafia-type associations 1995-2004; rates of city councils dissolved for mafia infiltration 1991-2007; rates of assets confiscated from organised crime 1998-2007; rates of offences connected with public procurement (corresponding to the offences envisaged by Article 640-bis, 316-bis, 316-ter, 353 of the Italian Criminal Code and Article 53-bis of Legislative Decree 22/1997). All rates are per 100,000 inhabitants, except city councils (rate per 100 councils in the province).
32
In some cases, in order to reduce the impact of outlier values for some indicators, provinces with outlier values were assigned the same rate as the province with the second higher rate.
Some of the measurements considered do not allow comparison among different areas. This is the case of the OCI compiled by ISTAT, which measures regional trends compared to their level in 1995. The OCI cannot be used to assess whether there is more organised crime in Sicily than, for example, in Calabria or Veneto.33 Surprisingly, Caruso seemed unaware of the nature of the OCI and compared the trends of the OCI among Italian regions, analysing its relation with certain socio-economic variables.34.
The measurements reviewed are frequently made at the regional level or do not include all Italian provinces. In the former case, the analysis is limited to regions, which are relatively large areas and may comprise very different socio-economic and criminal contexts. Most of the measurements reviewed above were at regional level. Some studies conducted analysis at the provincial level (IPM, Censis, Mennella, Daniele and Marani, Calderoni and Caneppele) but only the studies by Mennella and Daniele and Marani analysed all the Italian provinces.
Most of the studies reviewed used data covering a limited time span. This may significantly affect the perception and measurement of the mafia. The latter, in fact, is an enduring and complex system which can hardly be measured with data relative to one or two years. Constructing an index with data limited to only a few years may prove problematic, given that the presence of the mafia lasts and changes over time periods longer than a calendar year. This problem affects most of the studies and
33
For example, the OCI for Sicily in 2006 is 48.3 while for Umbria (a small central region) is 304.3.
34
Since the OCI measures the regional trend compared to 1995 (1995=100), its use for a statistical analysis across Italian regions appears unclear and potentially misleading. Indeed, the OCI measures whether the presence of organised crime has increased compared to 1995 in a given region and does not allow to compare to regional trends.
indexes cited above. The ISTAT OCI, the Eurispes IPM, Centorrino and Ofria, Mennella and Lavezzi used yearly data from one year to construct their indexes. Daniele and Marani, Censis used data covering three or four years.
In some cases, the geographical scope and the variables used have changed among different editions of the measurements. This applies especially to the IPM, and it affects the possibility of comparing the IPM 2004 with the other editions (2005, 2007, 2008, 2010) in order to analyse the trends of the provinces.35
The variable selection is frequently problematic, and there is a significant variety among the measurements reviewed. First, the variables selected do not always directly concern organised crime. For example, data on bomb or fire attacks, usury or money-laundering include crimes not committed by the mafias. Although it may be assumed that the mafia commits a proportion of these offences, the current data comprise crimes committed by single individuals as well as by mafia organisations. There is no information about the actual share of mafia-related offences for each selected crime. Furthermore, the share of mafia-related arsons may be different from the share of mafia-related usury or robbery. For this reason the use of such data to measure the presence of the mafia may provide unreliable information. In some cases, moreover, the measurements include indirect crimes and exclude offences more directly related with the mafia. For example, the ISTAT OCI includes arsons and serious robberies, but it excludes mafia-type associations. Second, some specific types of crime suffer from a very high ‘dark figure’ (i.e. unreported crimes), so that the
official statistics are not likely to reflect the actual distribution of crimes, but rather
35
For example, in the ranking of the IPM 2004 Crotone was the last province of Calabria. In 2005 the IPM 2005 Eurispes included mafia murders in the index. Crotone ranked first in IPM 2005.
the population’s propensity to report them. For this reason these data are extremely
unreliable and should be analysed with great caution. Extortion is a typical example. The threat of retaliation for reporting extortion to the police is very serious when it involves a mafia group, because it is relatively certain, immediate and may imply serious damage, including death. It is consequently likely that, in areas where
organised crime exerts strong control over the territory, data on extortion are severely underestimated.36 For these reasons, the official data on extortion are probably
distorted, underestimating the distribution of the offence in provinces under the close control of mafia-type associations. Other provinces may have higher rates, although this may be due to a higher propensity to report among victims, perhaps encouraged by less pervasive control of the area by criminal organizations. Despite the
importance of extortion in the dynamics of the mafia, data on extortion should be analysed with extreme care and not be considered as furnishing direct measures of mafia presence. The above-reviewed attempts to measure the presence of mafia frequently overlooked the difficulties involved in the use of official crime statistics, and they did not verify whether the variables selected were directly and reliably related to the mafia. There is no discussion on the selection of the variables and no analysis of the possible problems relative to the use of these data.37
The procedures for calculating the measurements exhibit various problems. The IPM by Eurispes included data in absolute values for the number of phone interceptions in the provinces. This severely affected comparability among the
36
Daniele, “Organized crime and regional development. A review of the Italian case,” 227; Asmundo and Lisciandra, “Un tentativo di stima del costo delle estorsioni sulle imprese a livello regionale: il caso Sicilia,” 117; Caneppele and Calderoni, “Extortion Rackets in Europe: An Exploratory Comparative Study.”
37
In another study, Daniele examines the problems of measuring extortion and mafia in Italy. See Daniele, “Organized crime and regional development. A review of the Italian case,” 227.
provinces, because larger and more densely populated provinces are likely to have more interceptions than smaller ones. It is not surprising that the biggest cities, such as Napoli, Palermo and Reggio Calabria, appear at the top of the IPM. It is widely acknowledged that comparison among variables whose distribution is affected by the size of the population studied is achieved by calculating rates. In this case, the rate per 100,000 inhabitants, or better per phone lines, would have yielded comparable
information. Moreover, the ISTAT calculates the OCI by summing the absolute values for the crimes selected and weighting them for the average statutory penalty. This is an attempt to consider the severity of different crimes. However, the average statutory penalty does not seem to be the most appropriate criterion in this case. In the absence of reliable statistics enabling calculation of the averages of the actual
penalties inflicted for each offence, probably the maximum statutory penalty would have been a better (and simpler) alternative. For example, if crime A is punished with up to 10 years of imprisonment and crime B is punished with between 4 and 8 years, the ISTAT procedure would give weighting factors of 5 and 6 respectively, implying that crime A should be considered less serious than crime B. Probably, most people would judge the matter in reverse, arguing that crime A is more serious than crime B.38 Moreover, this procedure does not seem preferable to alternative weighting systems.39
38
In any case, the letter of the law as an estimate of the seriousness of a crime is an extreme simplification which does not consider that criminal law has elements allowing
parameterization of the penalty to the actual seriousness of a crime (e.g. aggravating or attenuating circumstances, discretionary powers of the court). Therefore the statutory penalty is merely a starting point and the final applicable penalty may significantly differ from it.
39
For example, a 1-3 seriousness scale where the researchers would assess the seriousness of each offences according to various factors (possibly including the penalties provided by the law).
Other measurements sum the different variables and subsequently calculate the rates. This procedure is inevitably affected by the overall values of the summed crimes. For example, in 2008 the police reported to the judicial authorities 104 mafia murders, 6646 extortions, 10728 cases of damage followed by arson, and 34082 drug offences.40 It is clear that the sum of the provincial values will be most influenced by drug and damage followed by arson offences. This implies that very frequent and generic (not directly mafia-connected) offences are mixed with crimes which are direct signals of mafia presence, such as mafia-type murder. The indexes by Mennella, Daniele and Marani and ISTAT (with the above-criticized weighting system) adopted this mechanism. In practice, these indexes reflect the distribution of the most numerous crimes, which are frequently the ones more indirectly (if ever) related to the mafia.
Analysis of the existing attempts to measure the presence of the mafia in Italy highlights several problems and issues. These relate to the selection of the variables most directly related to the mafia, to the geographical and chronological scope of the data analysed, and to the procedures used to calculate the index. All the measurements reviewed exhibit one or more problems relating to these points. Surprisingly, the current literature does not provide a measurement of the presence of the mafia in Italy, notwithstanding the wealth of studies examining the mafia from multiple
perspectives. The studies reviewed confirm this lack of knowledge: they acknowledge dissatisfaction with the current measurements and argue that ‘the measurement of organised crime would therefore require a specific study’.41
40
Data are available on the ISTAT website “Justice in Figures”: giustiziaincifre.istat.it
41
The present study aims to fill this gap by creating the Mafia Index (MI), which is designed in particular to:
accurately select the most directly mafia-related variables
cover a prolonged time span
provide scores at the provincial level
use a clear calculation procedure accounting for the different values and distributions of the selected variables.
2. The creation of the Mafia Index
A methodology based on three steps was used to create the MI. The first step defined the concept of mafia and devised an operational definition comprising multiple dimensions (2.1). The second step identified possible indicators for each dimension and operationalized them (2.2). The third step created the MI by combining the variables selected (0).
2.1. The different dimensions of the mafia
The concept of mafia is an extremely complex one, and the literature has offered a number of definitions from different epistemological perspectives. However, defining the mafia would fall outside the scope of this study, which relies for its purposes on two main definitions of ‘mafia’. The first is the well-known legal definition of ‘mafia-type association’ provided by Article 416-bis of the Italian Criminal Code. Paragraph 3 of the provision defines the ‘metodo mafioso’ (mafia method) and the goals of the
mafia as follows:
‘An association is of mafia-type when its members exploit the potential for intimidation which their membership gives them, and the consequent
subjection and omertà to commit offences, or to assume, directly or indirectly, the management or control of financial activities, concessions, permissions, enterprises and public services, or for the purpose of deriving profit or wrongful advantages for themselves or others, or to hamper or to prevent during public elections the free exercise of the right to vote or to obtain votes for themselves or for others (author’s translation)’.
The second definition is the ‘paradigm of complexity’. This is a sociological definition which describes the mafia as ‘a system of violence and illegality that aims
to accumulate wealth and to obtain positions of power; which also uses a cultural code and which enjoys a certain popular support’.42
Some other scholars in Italy and abroad have adopted or aligned with the paradigm of complexity,43 which among its various implications postulates that ‘mafia’ is a complex, multifaceted concept. 44
Based on these two definitions, both of which highlight the complexity of the mafia and the variety of its activities and functions, this study adopts the following operational definition of mafia: a criminal system characterised by the presence of
criminal groups providing illicit goods and services, using violence, threat or intimidation, and infiltrating the political and the economic system. This definition
includes elements present in both Article 416-bis and the paradigm of complexity: the provision of illicit goods and services recalls the aim of ‘deriving profit or wrongful
advantages’ from the criminal offence, and the accumulation of wealth recalls the paradigm of complexity. The use of violence, threat or intimidation is mentioned both in the Criminal Code (‘potential for intimidation’) and by the paradigm of complexity (‘a system of violence and illegality’). The relation with the political system is
implicit in one the mafia-type association’s goals, that of interfering with elections, and in the aim ‘of obtaining positions of power’ highlighted by the paradigm of
complexity. Infiltration of the economic system is listed by Article 416-bis among the objectives of a mafia-type association (the management of economic activities), and it
42
Santino, “Mafia and Mafia-type organizations in Italy,” 87; Santino, Dalla Mafia Alle Mafie.
43
Armao, Il Sistema Mafia; Paoli and Fijnaut, “Introduction to Part I: The History of the Concept,” 31; Allum and Siebert, “Organized crime: a threat to democracy?,” 17; Scalia, “From the octopus to the spider?,” 6.
44
can be considered a consequence of the definition of the paradigm of complexity, which points up the objectives of power and profit and the enjoyment of ‘a certain popular support’.
According to this operational definition, the mafia has four main dimensions:
presence of criminal groups providing illicit goods and services
use of violence, threat or intimidation
infiltration of the political system
infiltration of the economic system.
2.2. The selection of the variables
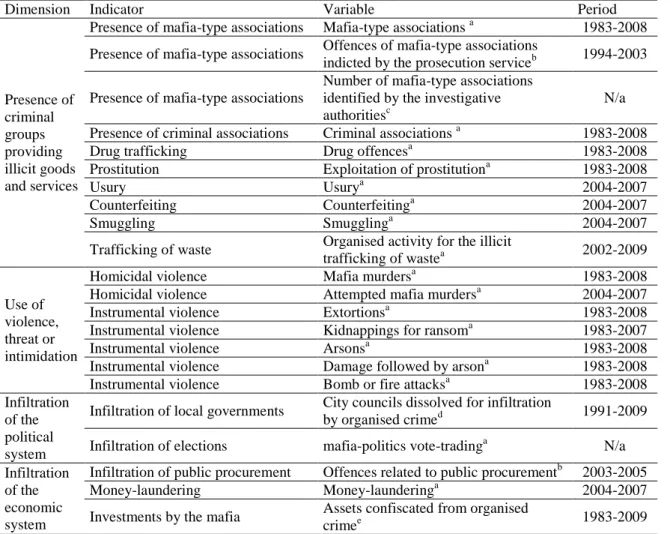
On the basis of a systematic review of the literature of existing attempts to measure the presence of mafia in Italy, and of available data sources, selection was made of a number of possible indicators and related variables with which to measure the above four dimensions.45
Table 7 lists the four dimensions, the indicators identified within each dimension, the variables measuring each indicator and the available years. Two variables (“Number of mafia-type associations identified by the investigative
authorities” and “Offence of mafia-politics vote-trading reported by the police to the prosecution service”) were not available.
45
In Italy, there are no victimization surveys or other periodic surveys measuring the presence or the perception of mafias (like, for example, the Transparency International’s Corruption Perceptions Index). Such surveys would provide important information with which to complement existing data (See Caneppele and Calderoni, “Extortion Rackets in Europe: An Exploratory Comparative Study.”). Although these sources have problems (sampling, memories of the respondents, costs), they have been used for the analysis of organised crime (see van Dijk, “Mafia Markers: Assessing Organized Crime and its Impact upon Societies.”). The only existing survey is the Italian Business Crime Survey conducted by the Italian Ministry of Interior and Transcrime in 2008 (see Mugellini, “Measuring crime against business in the EU: the problem of comparability,” 89. This survey has also covered offences related to organised crime (e.g. corruption, extortion), but results are available only at
regional level and have not yet been officially published (see Mugellini, “The Victimization of Businesses in Italy: key results.”
Table 7. Dimensions, indicators and variables for the Mafia Index
Dimension Indicator Variable Period
Presence of criminal groups providing illicit goods and services
Presence of mafia-type associations Mafia-type associations a 1983-2008 Presence of mafia-type associations Offences of mafia-type associations
indicted by the prosecution serviceb 1994-2003 Presence of mafia-type associations
Number of mafia-type associations identified by the investigative authoritiesc
N/a Presence of criminal associations Criminal associations a 1983-2008
Drug trafficking Drug offencesa 1983-2008
Prostitution Exploitation of prostitutiona 1983-2008
Usury Usurya 2004-2007
Counterfeiting Counterfeitinga 2004-2007
Smuggling Smugglinga 2004-2007
Trafficking of waste Organised activity for the illicit
trafficking of wastea 2002-2009
Use of violence, threat or intimidation
Homicidal violence Mafia murdersa 1983-2008 Homicidal violence Attempted mafia murdersa 2004-2007 Instrumental violence Extortionsa 1983-2008 Instrumental violence Kidnappings for ransoma 1983-2007
Instrumental violence Arsonsa 1983-2008
Instrumental violence Damage followed by arsona 1983-2008 Instrumental violence Bomb or fire attacksa 1983-2008 Infiltration
of the political system
Infiltration of local governments City councils dissolved for infiltration
by organised crimed 1991-2009 Infiltration of elections mafia-politics vote-tradinga N/a Infiltration
of the economic system
Infiltration of public procurement Offences related to public procurementb 2003-2005 Money-laundering Money-launderinga 2004-2007 Investments by the mafia Assets confiscated from organised
crimee 1983-2009
a Offences reported by the police to the prosecution service. Operational database for Italian law
enforcement agencies. Until 2003 this database was known as ‘modello 165’, while since 2004 a new system (‘SDI’ acronym for Sistema di Indagine) has replaced the previous one.
b
Territorial Information System on Justice database compiled by ISTAT and Ministry of Justice.
c- d Ministry of Interior data e Agenzia del Demanio data
f data from Legambiente, Rapporto Ecomafia
Source: author’s compilation
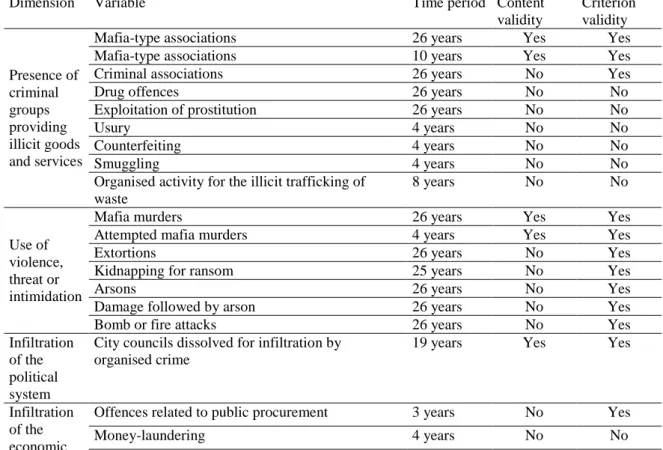
Subsequently, the selected and available variables were analysed according to three criteria. Table 8 presents the variables selected according to these criteria.
The first selection criterion was the availability of data for a sufficiently long period of time. This criterion may appear trivial, but it has important implications. As argued above, a mafia is an established and long lasting criminal system. To measure its presence in the Italian territory it is necessary to take account of this persistent and continuous nature. Therefore, the selection of data for a limited time period may affect the analysis of the phenomenon and distort perception of it. The data collected
for the study had different time spans. Long time series were available for 12
variables (at least 19 years available). For 8 variables, data were available for shorter periods (between 3 and 10 years).
The second selection criteria was content validity.46 Each identified variable was checked for its content validity, i.e. how it reflected one or more dimensions of the operational definition of mafia. This criterion paid particular attention to how the variable directly reflected mafia activities. Some variables were directly and
univocally related to the mafia. This was the case, for example, of mafia-type associations or mafia murders. Clearly, these variables measured phenomena which were directly related to the concept of mafia. By contrast, some of the variables identified were not directly and univocally related to the mafia: for example, statistics on drug offences, money-laundering and extortion. It was impossible to know from the data available whether the suspects/perpetrators of these offences were related to the mafia (e.g. as members or other partners) or isolated single criminals. It is legitimate to hypothesize that these offences are frequently committed by criminal organizations, and even by the mafias. Indeed, most of the studies reviewed earlier did so. However, it is impossible to establish the share of the total offences actually committed within mafia groups and not by single individuals. Further, the ‘mafia share’ may vary from offence to offence. For this reason, variables not directly and univocally related to the mafia did not pass the test for content validity. The reason for their exclusion was to avoid the use of data whose connection with the mafia was only partial and unclear. Among the available variables, only six were directly related to
46 Content validity refers to how “the measure covers the full range of the concept’s meaning”.
the mafia.47 The other variables (n. 14) were not directly and univocally related to the mafia.
The third selection criterion consisted in criterion validity.48 Each identified variable was analysed, verifying its statistical correlation with the other variables (see Annex I. Table 11. Correlation matrix for the correlation matrix). Among the
identified variables, 13 variables had a positive (Pearson’s r > 0.3) and statistically significant correlation with at least half of the other variables.49 Seven variables were not correlated to any other variables (exploitation of prostitution, drug crimes and waste trafficking) or were correlated to between one and four variables
(counterfeiting, money-laundering, smuggling and usury).
47
Mafia type associations (reported by the police), Assets confiscated from organised crime, Mafia murders, City councils dissolved for infiltration by organised crime, Mafia type associations (indicted by the prosecution) and attempted mafia murders.
48
Criterion validity refers to how “the scores obtained on one measure can be compared to those obtained with a more direct or already validated measure of the phenomenon (the criterion)”. Bachman and Schutt, The Practice of Research in Criminology and Criminal Justice, 95.
49
Criminal association correlated to 16 other variables; extortion and city councils dissolved for organised crime infiltration to 13; mafia-type association (police reported), mafia murders, assets confiscated to organised crime, mafia type association (indicted), attempted mafia murders, damage followed by arson, bomb or fire attacks, arsons and offences related to public procurement to 12; and kidnapping for ransom to 11.
Table 8. Selection of the variables for the MI
Dimension Variable Time period Content
validity Criterion validity Presence of criminal groups providing illicit goods and services
Mafia-type associations 26 years Yes Yes
Mafia-type associations 10 years Yes Yes
Criminal associations 26 years No Yes
Drug offences 26 years No No
Exploitation of prostitution 26 years No No
Usury 4 years No No
Counterfeiting 4 years No No
Smuggling 4 years No No
Organised activity for the illicit trafficking of waste 8 years No No Use of violence, threat or intimidation
Mafia murders 26 years Yes Yes
Attempted mafia murders 4 years Yes Yes
Extortions 26 years No Yes
Kidnapping for ransom 25 years No Yes
Arsons 26 years No Yes
Damage followed by arson 26 years No Yes
Bomb or fire attacks 26 years No Yes
Infiltration of the political system
City councils dissolved for infiltration by organised crime
19 years Yes Yes
Infiltration of the economic system
Offences related to public procurement 3 years No Yes
Money-laundering 4 years No No
Assets confiscated from organised crime 27 years Yes Yes Source: author’s compilation
2.3. The creation of the Mafia Index
Based on the above-described selection procedure, only four variables that
successfully passed the three selection criteria were included in the Mafia Index. They were:
mafia-type associations
mafia murders
city councils dissolved for mafia infiltration
assets confiscated from organised crime.
Each of the variables selected covered a different dimension of the operational concept of mafia identified in 2.1. Consequently, the MI measures all four dimensions of the mafia.
The literature has frequently adopted one or more of the variables selected as a reliable proxy for the presence of mafias.50 Indeed, the presence of a mafia-type association (reported by the police to the prosecution service) reflects the actual presence of a criminal group operating in a given province. The commission of a mafia murder shows that the mafias have some form of control, or at least are able to reach their targets with relative ease. The dissolution of a city council and the
presence of assets confiscated from organised crime are reliable proxies for infiltration of the political and economic systems. Although the four variables satisfied the three selection criteria and are frequently used in studies on the Italian mafias, they cannot be considered immune to problems. Indeed, it is widely
acknowledged that official/administrative crime statistics should be used with great caution, especially for non-conventional crimes such as mafia-related ones.51 These, in fact, sources may reflect the efforts and performance of the criminal justice system rather than the actual trends of the crimes. The variables included in the MI are no exception. However, some elements suggest that these variables are sufficiently reliable. For example, mafia murders should have a limited dark figure. In some cases mafias may conceal the murders that they commit, for example by resorting to the so called ‘lupara bianca’, which consists in concealment of the victim’s corpse, thus
impeding the detection and investigation of the murder. More frequently, however, mafias do not conceal their murders. Indeed, the exercise of homicidal violence emits
50
Most of the indexes and studies reviewed in 1.1 used one or more of the selected variables to measure the presence of mafias in Italy. Other publications have focused on one specific indicator among those selected. See Chinnici and Santino, La violenza programmata : omicidi e guerre di mafia a Palermo dagli anni ’60 ad oggi; Chinnici, “L'omicidio a Palermo”; Mete, Fuori dal comune; Trocchia, Federalismo Criminale: Viaggio nei comuni sciolti per mafia; Talamo, “Appendice: Alcuni dati sui patrimoni mafiosi.”
51
Caneppele and Calderoni, “Extortion Rackets in Europe: An Exploratory Comparative Study.”
a very strong signal of the power and control exerted by the mafias. Once the decision to murder has been taken, mafias may want to maximize its effects, making it
generally known that they are capable of killing their enemies. Therefore, this variable does not appear to be excessively influenced by the performance of the criminal justice system; rather, it is likely to reflect the actual distribution of mafia murders across the national territory. The other variables show an extremely strong correlation with mafia murders and among them (see below and Table 11 in Annex). This very probably confirms that provinces with high values on one variable also have high values on the other three variables. Furthermore, the variables of the MI cover a time span of nearly thirty years (except for city councils dissolved for mafia infiltration, a variable which covers the 1991-2009 period). In such a (relatively) long time period, it appears difficult to argue that the highest values of a province are due to a
systematic outperformance (or underperformance) of the criminal justice system in that province. Obviously, these elements do not completely dispel the risk that the variables depict the performance of the criminal justice system, at least in part. However, it appears justifiable to assume that the values of the variables selected primarily reflect the distribution of mafia-related phenomena and only marginally the performance of the Italian criminal justice system. The scores of the MI substantially confirm this assumption (see below, Section 3).
Two different procedures were adopted to calculate the MI. The first of them (MI (rate)) calculated the average of the annual rates for each variable and for each province.52 It then normalized the rates, attributing the score of 100 to the province
52
Rates for mafia-type associations, murders and for confiscated assets are per 100,000 inhabitants in the province; rates for city councils dissolved for mafia infiltration are per 100 city councils in the province.
with the highest average rate. The average of the scores for each indicator provided the final score for each province (third column in Table 9, ‘Mafia index (rate)’).
The Mafia Index (rate) measures the presence of mafia in the Italian provinces, but it is greatly affected by the unequal distribution of the variables
analysed. Indeed, all four indicators were extremely concentrated in a limited number of provinces, with the highest rates very distant from the average and median rates (see Annex I, Figure 1 to Figure 4).
The concentrated distribution of the selected variables may jeopardise a satisfactory estimation of the actual presence of the mafia on the Italian territory. In particular, it may overestimate the presence of the mafia in a few provinces of Southern Italy. These are the original areas of mafia-type organisations, and it is therefore not surprising that they show high rates on the indicators selected. For this reason, crimes and data may overestimate the presence of the mafia, while for other provinces it may be more difficult to attribute a crime to a mafia-type group.
Moreover, given the traditional presence of mafia-type groups, these areas are also the target of extremely intensive law enforcement operations. Consequently, the figures reflecting police reports and other data may be higher owing to better performance by and/or more numerous law enforcement personnel. In general, the variables selected have very low values, since the crimes are relatively rare and complex (compared, for example, with robbery or theft). Hence even a very low rate (compared with other crimes) may still be an important signal of mafia presence in a given province. To measure the presence of mafia in Italy better, it may be more useful to focus on each province’s rank among all Italian provinces. This approach makes it possible to
For these reasons, a second calculation procedure was developed. This was the MI (rank), which was based on the rank of each province among all the Italian provinces for each indicator, instead of the average of the annual rates. For each indicator, the MI (rank) calculated the average of the annual rates for each province. It then ranked all the Italian provinces in decreasing order. It attributed the score of 100 to the province with the highest rank, and proportionally lower scores to the other provinces, according to their rank. The average score for each indicator provided the MI for each province (fourth column in Table 9, ‘MI (rank)’).
The two procedures yielded very closely correlated provincial scores.53 The provinces with the highest rate (first procedure) ranked high also in the second procedure. However, the impact of the outliers was reduced and the overall distribution of the provinces was less concentrated.
53
Table 9. The Mafia Index MI Rank Province MI (rate)a MI (rank)b MI Rank Province MI (rate)a MI (rank)b 1 Reggio Calabria 80.58 98.32 53 Genova 1.13 12.67 2 Napoli 47.28 87.03 54 L'aquila 0.88 12.52 3 Caserta 35.33 84.73 55 Bologna 0.91 12.43 4 Caltanissetta 42.20 84.50 56 Lucca 0.96 12.43 5 Palermo 50.37 83.22 57 Trento 0.78 11.66 6 Catania 32.12 82.50 58 Pavia 0.75 11.54 7 Crotone 34.11 81.22 59 Macerata 0.90 10.81 8 Trapani 29.42 77.86 60 Asti 0.88 10.70 9 Catanzaro 32.83 76.97 61 Belluno 0.80 10.48 10 Vibo Valentia 26.08 74.13 62 Ferrara 0.62 10.14 11 Agrigento 23.52 71.75 63 Arezzo 0.86 9.63 12 Ragusa 17.83 61.82 64 Bergamo 0.70 9.18 13 Messina 15.44 60.82 65 Trieste 0.66 9.18 14 Enna 17.21 57.74 66 Pesaro Urbino 0.52 9.16 15 Salerno 12.02 57.65 67 Pistoia 0.58 8.53 16 Bari 12.83 55.72 68 Lodi 0.58 8.21 17 Siracusa 12.74 50.71 69 Nuoro 0.55 7.35 18 Lecce 7.50 48.76 70 Padova 0.70 7.25 19 Brindisi 11.85 47.11 71 Modena 0.92 7.16 20 Avellino 8.06 46.29 72 Udine 0.57 7.03 21 Cosenza 7.22 44.10 73 Livorno 0.86 6.95 22 Matera 6.99 39.75 74 Ravenna 0.59 6.92 23 Foggia 4.56 36.64 75 Cremona 0.61 6.71 24 Taranto 5.91 35.25 76 Pescara 0.62 6.39 25 Benevento 5.16 34.80 77 Parma 0.53 6.17 26 Latina 4.30 34.16 78 Viterbo 0.54 6.17
27 Roma 2.92 27.89 79 Reggio Emilia 0.67 6.07 28 Novara 4.53 25.24 80 Alessandria 0.43 5.94
29 Milano 2.53 24.93 81 Mantova 0.45 5.94
30 Como 2.16 24.10 82 Grosseto 0.41 5.62
31 Torino 1.71 23.68 83 Isernia 0.49 5.62
32 Sassari 1.54 21.68 84 Sondrio 0.38 5.40 33 Verbano Cusio Oss. 2.05 21.53 85 Ascoli Piceno 0.50 4.87
34 Teramo 1.89 21.08 86 Rovigo 0.43 4.87
35 Lecco 4.05 20.69 87 Ancona 0.54 4.67
36 Brescia 1.92 20.50 88 Massa Carrara 0.56 4.35 37 Potenza 1.98 20.35 89 Vercelli 0.22 4.31 38 Rimini 1.67 19.79 90 Cuneo 0.28 4.10 39 Frosinone 1.74 19.58 91 Siena 0.26 4.10 40 Imperia 1.64 19.04 92 Pisa 0.38 3.90 41 Varese 1.55 18.07 93 Perugia 0.47 3.69 42 Venezia 1.47 17.84 94 Oristano 0.34 3.67 43 Savona 1.44 16.66 95 Vicenza 0.39 3.15 44 Piacenza 1.26 14.60 96 Treviso 0.35 3.04 45 Gorizia 2.37 14.54 97 Rieti 0.39 2.72 46 La Spezia 1.30 14.39 98 Chieti 0.32 2.60 47 Firenze 1.58 14.21 99 Prato 0.15 2.59 48 Cagliari 0.98 13.72 100 Bolzano 0.25 1.63 49 Verona 1.02 13.72 101 Terni 0.25 1.63 50 Aosta 1.26 13.64 102 Pordenone 0.10 0.54 51 Forli' 0.83 13.59 103 Biella 0.00 0.00 52 Campobasso 1.44 12.80
b
Average of the scores on the four indicators (for each indicator, the highest rank=100)
Source: author’s calculations
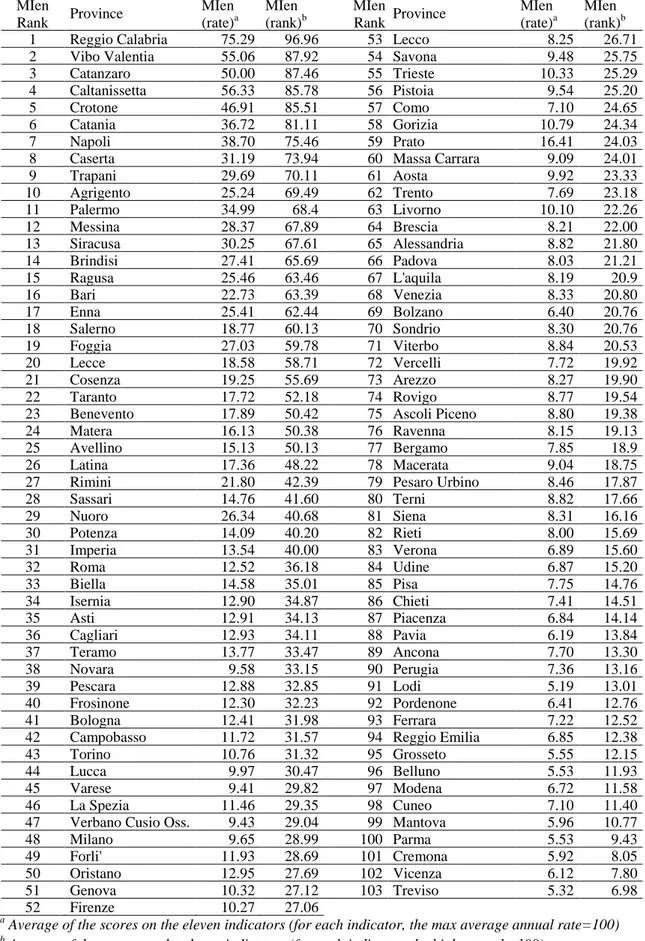
To verify the overall quality and reliability of the MI, another measurement, including other variables in the index, was performed. This index (Mafia Index Enlarged, or MIen) included all the variables which had satisfied at least two of the three selection criteria (availability for a long period, content validity, and criterion validity). The selection of the variables for the MIen was more flexible and included variables which presented some issues relating to their availability, their direct relation with the mafia, and their statistical correlation with the other variables(see above Table 8). The variables composing the MIen were:
mafia-type associations
mafia murders
city councils dissolved for mafia infiltration
assets confiscated from organised crime
criminal associations
attempted mafia murders
extortions
kidnapping for ransom
arsons
damage followed by arson
bomb or fire attacks.
The same calculation procedures were used to create the MIen (rate) and the MIen (rank) (See Table 10). Once again the two procedures yielded provincial scores with high correlations.54
54
Table 10. Mafia Index Enlarged (MIen) MIen Rank Province MIen (rate)a MIen (rank)b MIen Rank Province MIen (rate)a MIen (rank)b 1 Reggio Calabria 75.29 96.96 53 Lecco 8.25 26.71 2 Vibo Valentia 55.06 87.92 54 Savona 9.48 25.75 3 Catanzaro 50.00 87.46 55 Trieste 10.33 25.29 4 Caltanissetta 56.33 85.78 56 Pistoia 9.54 25.20
5 Crotone 46.91 85.51 57 Como 7.10 24.65
6 Catania 36.72 81.11 58 Gorizia 10.79 24.34
7 Napoli 38.70 75.46 59 Prato 16.41 24.03
8 Caserta 31.19 73.94 60 Massa Carrara 9.09 24.01
9 Trapani 29.69 70.11 61 Aosta 9.92 23.33 10 Agrigento 25.24 69.49 62 Trento 7.69 23.18 11 Palermo 34.99 68.4 63 Livorno 10.10 22.26 12 Messina 28.37 67.89 64 Brescia 8.21 22.00 13 Siracusa 30.25 67.61 65 Alessandria 8.82 21.80 14 Brindisi 27.41 65.69 66 Padova 8.03 21.21 15 Ragusa 25.46 63.46 67 L'aquila 8.19 20.9 16 Bari 22.73 63.39 68 Venezia 8.33 20.80 17 Enna 25.41 62.44 69 Bolzano 6.40 20.76 18 Salerno 18.77 60.13 70 Sondrio 8.30 20.76 19 Foggia 27.03 59.78 71 Viterbo 8.84 20.53 20 Lecce 18.58 58.71 72 Vercelli 7.72 19.92 21 Cosenza 19.25 55.69 73 Arezzo 8.27 19.90 22 Taranto 17.72 52.18 74 Rovigo 8.77 19.54 23 Benevento 17.89 50.42 75 Ascoli Piceno 8.80 19.38 24 Matera 16.13 50.38 76 Ravenna 8.15 19.13 25 Avellino 15.13 50.13 77 Bergamo 7.85 18.9 26 Latina 17.36 48.22 78 Macerata 9.04 18.75 27 Rimini 21.80 42.39 79 Pesaro Urbino 8.46 17.87
28 Sassari 14.76 41.60 80 Terni 8.82 17.66 29 Nuoro 26.34 40.68 81 Siena 8.31 16.16 30 Potenza 14.09 40.20 82 Rieti 8.00 15.69 31 Imperia 13.54 40.00 83 Verona 6.89 15.60 32 Roma 12.52 36.18 84 Udine 6.87 15.20 33 Biella 14.58 35.01 85 Pisa 7.75 14.76 34 Isernia 12.90 34.87 86 Chieti 7.41 14.51 35 Asti 12.91 34.13 87 Piacenza 6.84 14.14 36 Cagliari 12.93 34.11 88 Pavia 6.19 13.84 37 Teramo 13.77 33.47 89 Ancona 7.70 13.30 38 Novara 9.58 33.15 90 Perugia 7.36 13.16 39 Pescara 12.88 32.85 91 Lodi 5.19 13.01 40 Frosinone 12.30 32.23 92 Pordenone 6.41 12.76 41 Bologna 12.41 31.98 93 Ferrara 7.22 12.52 42 Campobasso 11.72 31.57 94 Reggio Emilia 6.85 12.38 43 Torino 10.76 31.32 95 Grosseto 5.55 12.15
44 Lucca 9.97 30.47 96 Belluno 5.53 11.93
45 Varese 9.41 29.82 97 Modena 6.72 11.58
46 La Spezia 11.46 29.35 98 Cuneo 7.10 11.40 47 Verbano Cusio Oss. 9.43 29.04 99 Mantova 5.96 10.77
48 Milano 9.65 28.99 100 Parma 5.53 9.43
49 Forli' 11.93 28.69 101 Cremona 5.92 8.05 50 Oristano 12.95 27.69 102 Vicenza 6.12 7.80 51 Genova 10.32 27.12 103 Treviso 5.32 6.98 52 Firenze 10.27 27.06
a Average of the scores on the eleven indicators (for each indicator, the max average annual rate=100) b Average of the scores on the eleven indicators (for each indicator, the highest rank=100)
3. Analysis of the Mafia Index
The MI and the MIen yielded very similar results (Maps 2 to 4), with closely correlated scores.55 This may be due to the fact that the MIen included variables which were present in the MI. However, the correlation was confirmed, albeit at a slightly lower level, also if the MI was compared with the set of variables included only in the MIen.56 This shows that both indexes converged in measuring the same phenomenon. The MI and the MIen did not differ significantly. The more rigorous selection of the variables of the MI did not exclude from the MI important patterns of mafia presence that may have been included through other variables.
Map 2. Mafia Index (rate) – Map 3 Mafia Index (rank)*
*Classes created through Jenks Natural Breaks Classification
Source: author’s calculations
The MI thus appears to be a reliable index measuring the presence of mafia at the provincial level. The inclusion of other variables, as tested in the MIen, does not affect the provincial scores and their distribution in a significant way. Furthermore, the MI is a relatively simple index, in that it is composed of only four variables. This makes it easier to calculate and update. However, the variables selected satisfy all
55
Pearson’s r was 0.903 for the MI (rate) and MIen (rate) and 0.941 for the MI (rank) and MIen (rank). Both correlations were statistically significant at 0.01 level.
56
Pearson’s r was 0.788 for the rate procedure and 0.856 rank procedure. Both correlations were statistically significant at 0.01 level.
three selection criteria, namely availability for a prolonged period, direct relation with the mafia, and criterion validity. The four variables of the MI are strongly correlated with each other (see Annex I Table 11 for the correlations; for the MI, Cronbach’s alpha= 0.908).57
Map 4. Mafia Index Enlarged (rate) – Map 5. Mafia Index Enlarged (rank)*
*Classes created through Jenks Natural Breaks Classification
Source: author’s calculations
For the above reasons, and for the purpose of this study, it seems appropriate to adopt the MI and discard the MIen. Indeed, the MIen consists of more variables, available for shorter periods and less directly related to the mafia.
Maps 2 and 3 show the distribution of the MI across Italian provinces. The presence of the mafia appears to be concentrated in some Southern Italian provinces: in particular, the provinces of Naples and Caserta (Campania), Southern Calabria (Reggio Calabria, Vibo Valentia, Crotone and Catanzaro) and Western Sicily (Palermo, Trapani, Agrigento, Caltanissetta) and Catania have high values in the index. These results confirm the extensive literature (both scientific studies and public reports) identifying those areas as most affected by the presence of mafia-type
57
organisations.58 Indeed, the Camorra concentrates particularly in the provinces of Naples and Caserta (in which is situated the town of Casal di Principe, hometown of the Casalesi clan described in Roberto Saviano’s Gomorrah59).60 The ‘ndrangheta is historically based in Southern Calabria.61 Similarly, the Sicilian Mafia originated in the Western Sicilian provinces.62
Notwithstanding the concentration in their original areas of mafia-type
associations, many other Southern provinces record high values in the MI (rate). This is the case of some provinces of Apulia (Bari, Brindisi and Lecce) where the “fourth mafia”, the Sacra Corona Unita, arose in the 1980s.63
The analysis of the MI (rate) in Map 2 highlights only 3 provinces with low-medium values outside the Southern regions. These are the provinces of Novara (Piedmont), Lecco (Lombardy) and Latina (Lazio). However, when focusing on the MI (rank) in Map 3, new and more interesting patterns emerge. In particular, some large provinces in Central and Northern Italy, such as Rome, Milan, Turin and Brescia, present medium-level scores. Alongside these, some minor provinces in the Centre-North emerge, such as Verbano-Cusio-Ossola, Novara (Piedmont), Imperia (Liguria), Lecco and Como (Lombardy), Rimini (Emilia-Romagna), Latina and Frosinone (Lazio), Teramo (Abruzzo) and Sassari (Sardinia). Several other central and northern provinces record values higher than that of the lowest class in Map 3. Although these provinces do not reach the scores of those mentioned above, they
58
Sciarrone, Mafie vecchie, mafie nuove, 155.
59
Saviano, Gomorra.
60
Behan, The Camorra; Allum, Camorristi, Politicians, and Businessmen.
61
Varese, “How Mafias Migrate,” 422; Ciconte, 'Ndrangheta, 22-33.
62
Gambetta, The Sicilian Mafia, 81-85; Paoli, “Italian Organised Crime,” 22.
63