ALMA MATER STUDIORUM - UNIVERSITÀ DI BOLOGNA
PhD COURSE: ELECTRONICS, COMPUTER SCIENCE AND TELECOMMUNICATIONS XXIII CYCLE - SCIENTIFIC DISCIPLINARY SECTOR: ING-INF/01
Analysis and Modeling
Techniques for Ultrasonic
Tissue Characterization
Simona Maggio
SUPERVISOR
Professor Guido Masetti
COORDINATOR
Professor Paola Mello
DEIS - DEPARTMENT OF ELECTRONICS, COMPUTER SCIENCE AND SYSTEMS JANUARY 2008 - DECEMBER 2010
ABSTRACT i
Abstract
This thesis introduces new processing techniques for computer-aided interpretation of ultrasound images with the purpose of supporting medical diagnostic. In terms of practical application, the goal of this work is the improve-ment of current prostate biopsy protocols by providing physi-cians with a visual map overlaid over ultrasound images marking regions potentially affected by disease. As far as analysis techniques are concerned, the main contributions of this work to the state-of-the-art is the introduction of de-convolution as a pre-processing step in the standard ultra-sonic tissue characterization procedure to improve the di-agnostic significance of ultrasonic features.
This thesis also includes some innovations in ultrasound modeling, in particular the employment of a continuous-time autoregressive moving-average (CARMA) model for ul-trasound signals, a new maximum-likelihood CARMA esti-mator based on exponential splines and the definition of CARMA parameters as new ultrasonic features able to cap-ture scatterers concentration.
Finally, concerning the clinical usefulness of the devel-oped techniques, the main contribution of this research is showing, through a study based on medical ground truth, that a reduction in the number of sampled cores in standard prostate biopsy is possible, preserving the same diagnostic power of the current clinical protocol.
Keywords: ultrasound, tissue characterization,
deconvolu-tion, prostate biopsy, continuous-time autoregressive mov-ing average, exponential splines.
Résumé
Cette thèse introduit de nouvelles techniques de traite-ment pour l’interprétation guidée d’images ultrasons, dans le but de soutenir le diagnostic médical. L’objectif pratique de ce travail est l’amélioration du protocole standard pour la biopsie de la prostate, en fournissant au médecin une carte visuelle sur l’écographie qui marque les régions potentielle-ment malignes. En ce qui concerne les techniques d’analyse, la contribution principale de cette thèse est l’introduction de la déconvolution comme étape de pré-traitement dans la procédure standard de caractérisation des tissus par ultra-sons, afin d’améliorer la valeur diagnostique des caractéris-tiques du signal.
Cette thèse présente, en outre, des innovations dans la modélisation du signal ultrason, en particulier la proposi-tion d’un modèle autorégressif à moyenne glissante en temps continu (CARMA), le développement d’un nouvel estimateur au maximum de vraisemblance de paramètres CARMA fondé sur les splines exponentielles et la définition des paramètres CARMA comme des nouvelles caractéristiques du signal ul-trason capables de capturer l’information sur la concentra-tion de scatterers.
Enfin, concernant l’utilité clinique des techniques déve-loppées, la contribution principale de cette recherche est dans la démonstration, au travers d’une étude médicale, de la possibilité de réduire concrètement le nombre d’ échan-tillons prélevés pendant la biopsie de la prostate standard, en préservant le même pouvoir diagnostique du protocole biopsique standard.
SOMMARIO iii
Sommario
Questa tesi introduce nuove tecniche di elaborazione per l’interpretazione guidata di immagini ultrasoniche, allo scopo di supportare la diagnosi medica. Dal punto di vista applicativo, l’obiettivo di questo lavoro è il miglioramento del protocollo standard per la biopsia prostatica,fornendo al radiologo una mappa visiva di regioni potenzialmente ma-late. Per quan-to riguarda le tecniche di analisi, il contri-buto principale di questa tesi è l’introduzione della decon-voluzione come passo di pre-processing nella procedura standard di tissue characterization basata su ultrasuoni, al fine di migliorare il potere diagnostico di alcune caratteristi-che estratte dal segnale.
Questa tesi include, inoltre, delle innovazioni nel mod-eling del segnale ultrasonico, in particolare la proposta di un modello tempo-continuo autoregressive moving-average (CARMA), lo sviluppo di un nuovo stimatore maximum-likeli-hood di parametri CARMA basato su exponential spline e la definizione dei parametri CARMA come nuove caratteri-stiche del segnale ultrasonico capaci di catturare l’informa-zione sulla concentral’informa-zione di scatterer.
Infine, per quanto riguarda l’utilità applicativa delle tec-niche sviluppate, il contributo principale di questa ricerca sta nel mostrare attraverso uno studio su ground-truth medi-co che è possibile ridurre effettivamente il numero di cam-pioni prelevati durante la biopsia prostatica standard,preser-vando le stesse capacità diagnostiche del protocollo clinico standard.
C
ONTENTS
Abstract i Résumé ii Sommario iii Introduction 1 1 Background 5 1.1 Diagnostic ultrasound . . . 6 1.2 Tissue characterization . . . 101.3 Application: prostate TRUS . . . 19
2 Ultrasound image analysis and interpretation 27 2.1 Dimensionality reduction . . . 29
2.2 Feature-based segmentation . . . 32
2.3 Deconvolution as pre-processing step . . . 36
2.4 Feature-based classification . . . 39
2.5 Ground truth database . . . 40
2.6 Experimental results . . . 43
2.7 Conclusion . . . 51
3 A CARMA model for ultrasound signals 53 3.1 CAR and CARMA models . . . 55
3.2 CARMA processes and exponential splines . . . 58
3.3 Insights on the exponential spline framework . . . . 68
3.4 A new approach to CARMA model identification . . 70
3.5 CARMA estimation algorithm . . . 79
3.6 Simulation results . . . 86
3.7 CARMA for ultrasound tissue characterization . . . 92
3.8 Comparative study on phantom images . . . 95
3.9 Conclusion . . . 99
4 Improving standard prostate biopsy protocol 101
4.1 Database collection . . . 102
4.2 Processing and learning scheme . . . 106
4.3 Classification results . . . 111
4.4 The future . . . 111
4.5 Conclusion . . . 113
Conclusions 115
A Features for ultrasonic tissue typing 119
B State of the art in tissue characterization 123
C Initial conditions in CARMA estimation 125
D Non symmetric exponential B-splines 127
Notations 131
Publications 137
I
NTRODUCTION
Research is what I’m doing when I don’t know what I’m doing.
Wernher von Braun (1912-1977)
U
LTRASOUNDimaging is one of the most used technologies for non invasive medical diagnostic. Resolution limits and speckle noise affecting ultrasonography prevent the employment of stan-dard image processing techniques to perform tissue characteriza-tion supported by computer. On the contrary the interpretacharacteriza-tion of ultrasound image requires an approach based on features specific of the echo signal, able to capture the state of the imaged tissue.The realization of computer-aided tissue characterization sche-mes in ultrasound imaging is constrained to the analysis of charac-teristics of the ultrasound signal and their correlation to the patho-logical state of tissues. In addition, the study of new parametric models for the ultrasonic echo allows the definition of new image attributes which may be likewise correlated to the state of the in-vestigated tissue and useful for characterization. Finally, the de-sign of a medical ground truth and a learning scheme to recognize pathological tissues is essential for an unbiased approach to tissue characterization.
In this thesis all the fundamental steps for the realization of ultrasonic tissue characterization schemes are taken into account and dealt with through the development of new processing meth-ods. Although the developed techniques are applicable to the in-vestigation of any biological tissue, the final goal of this work is the design of a computer-aided detection scheme to support physi-cians in the diagnosis of prostate cancer.
This thesis is subdivided in three stages. First, a preliminary study of the existing ultrasonic features is performed to select the most significant attributes for tissue representation. The ground truth used in this first stage is a collection of ultrasound images
of the prostate gland, where the pathological region is outlined by pathologists. Then, a non linear learning approach is validated on the collected medical ground truth. Within the first stage the novel contribution of this thesis is the introduction of shift-variant de-convolution as a pre-processing step in the traditional tissue cha-racterization scheme. In this context deconvolution breaks away from its traditional goal of improving the visual quality of ultra-sound images and is used to enhance the diagnostic power of ul-trasonic features. Experimental results show that performing de-convolution before feature extraction yields to significantly increase the ability of some ultrasonic features to recognize pathological tissues.
In the second stage, a new model is proposed for the ultra-sound echo signal, in order to enable the definition of novel at-tributes useful for tissue characterization. The ultrasound signal is modelled as a sampled continuous-time autoregressive moving average (CARMA) process. Two new algorithms are proposed for the estimation of continuous-time domain parameters of a CARMA process from its sampled data. The first is a maximum-likelihood estimator based on exponential splines suitable for any sampling condition, even when some aliasing is present. Simulations results show that this estimator outperforms current estimation methods based on polynomial splines, which are appropriate only in high sampling frequency conditions.
Additionally, another estimator is designed to provide good es-timates with a lower computational cost when high sampling fre-quency is employed: this is usually the case in ultrasound images. Although not maximum-likelihood, this estimator is still based on exponential splines and can be used to compute the CARMA pa-rameters of the ultrasound signals composing an image. CARMA parameters are considered as new ultrasonic features and their abil-ity in tissue representation are analysed on a phantom ground-truth and compared to traditional ARMA parameters, often used to model the discrete ultrasound echo. The results of this study show that CARMA parameters are able to capture the changes in scatterers concentration better than traditional ARMA parameters. In the second stage the main contributions of this thesis are (a) the proposal of a new model for ultrasound signal, (b) the design of a CARMA estimator providing correct estimates also in aliasing conditions and (c) the definition of new features correlated to the scatterers concentration in ultrasound images.
INTRODUCTION 3 studied techniques to the improvement of the current prostate bio-psy protocol. A large ground truth database of imaged biobio-psy cores and the corresponding histo-pathological analysis are collected to validate the accuracy of processing and classification techniques. Improved statistical and textural features are used here in a spe-cific learning scheme, able to use both completely known data and uncertain biopsy cores, where pathology covers just a percentage of the sample.
The developed algorithm for real-time computer-aided biopsy (rtCAB) includes feature extraction and learning techniques and is implemented exploiting CUDA™parallel processing in order to enable real-time support to physicians during biopsy sessions. This technique is able to reduce the biopsy core number from 8-12 to 7, preserving the same diagnostic power of a standard protocol and working in real-time.
The structure of this thesis is formed by 5 chapters. The first chapter develops the background resuming the basic information about ultrasound imaging and tissue characterization. Chapter 2 describes the proposed characterization scheme with introduc-tion of deconvoluintroduc-tion as pre-processing step. Chapter 3 contains the description of the new continuous-time domain model for ul-trasound signals; the derivation of CARMA parameters estimators and the application of CARMA parameters to the characterization of ultrasound scatterers concentration. The fourth chapter reports the realization of the ground truth and the developed learning al-gorithm for the improvement of the current prostate biopsy pro-tocol. The conclusive chapter summarizes the main contributions of this thesis and provides some clues about future research in ul-trasonic tissue characterization.
One
B
ACKGROUND
The essential is invisible to the eyes. Antoine de Saint-Exupéry (1900-1944)
T
HEmain goal of biomedical image analysis is monitoring inner physiological systems to early diagnose potential diseases. A pathological process affecting the investigated system reflects on measured signals that, because of the disease, present characte-ristics different from the corresponding normal pattern. The es-sence of image analysis is to capture these characteristics, which are often not visible to human eye, and to describe the state of the imaged physiological system. Image modeling can also serve this purpose, providing some mathematical descriptors of the mea-sured signals that result to be modified by the state of the imaged tissues and, thus, useful for their characterization.The interpretation of biomedical images, traditionally perfor-med by physicians, can be supported by automatic image analysis tools, making a quantitative study of physiological systems pos-sible. This process is called Computer-aided Diagnosis (CAD) [1] and it is aimed at improving the reliability of physician judgement by reducing subjectivity, inter- and intra-observer variability and potential human errors due to fatigue, boredom or environmental factors.
CAD tools have always been thought as a support and not a re-placement of medical specialists, who integrate their experience and intuition with objective clinical signs to realize the final di-agnosis. Biomedical image analysis and enhancement techniques constitute the core of CAD systems and can be crucial in health-care quality.
Although the main target of medical image analysis and im-provement techniques is early detection of potential diseases, these
post-processing steps are also important to boost the performance of cost-effective imaging devices. In fact the software enhance-ment of medical imagery is necessary both to compensate for qual-ity reduction in video acquisitions of portable devices and to an-swer to the recent needs of world healthcare market, interested in producing affordable medical equipments for developing coun-tries.
Among all imaging modalities, ultrasound presents some in-teresting advantages: ultrasound devices are cheap, they provide real-time feedbacks, they don’t use ionizing radiations, they are a well established technology present in all health institutions. On the other hand, ultrasound video sequences are affected by low resolution and are characterised by speckle noise, preventing the employment of traditional image processing algorithms to perform computer-based analysis and enhancement.
Indeed, while some CAD tools are already clinically used in more expensive imaging modalities, like CT and MRI, the realiza-tion of effective image analysis techniques in ultrasound, match-ing the clinical standards and possibly real-time, is still a challenge.
1.1 Diagnostic ultrasound
Ultrasound echo imaging [2] is the fastest and simplest medical imaging technique, based on recording the reflected echo of ultra-sound pulses. The main information provided by ultrasonography is the echo intensity value associated to some spatial coordinates. Unlike CT and MRI, ultrasound does not provide directly any information about some tissue parameters, in fact the echo inten-sity depends in a complex way both on the imaged tissue and on the acquisition system. For this reason ultrasound are used with the only purpose of imaging the anatomy, or guiding some clinical operations, but not to characterize tissues.
Nevertheless the echo intensity is just a small part of the infor-mation the reflected pulse can provide. The raw radio-frequency (RF) signal returned by reflection is neglected by the traditional B-scan imaging modality, which directly computes its envelope (fig-ure 1.1). Nevertheless the study of this signal can lead to the defini-tion of significant features of the imaged tissues, as well as provide a way to reduce system dependent effects. The RF signal is, thus, the key to perform ultrasonic tissue characterization.
1.1. DIAGNOSTIC ULTRASOUND 7
Figure 1.1: Exemple of an RF signal and its envelope shown as a scan line in a phantom ultrasound image.
line in ultrasound image along the propagation direction, called axial direction. The resolution along this direction depends on both the length of the ultrasonic pulse and its wavelength, still it can only be increased within strict limits, since ultrasound absorp-tion in tissues is linearly proporabsorp-tional to frequency. The poor qual-ity of ultrasound image is due to the intrinsic resolution limits of this technology.
The lateral resolution depends on the geometry of the probe generating the ultrasound beam. The beam divergence angle is smaller for larger diameters of the probe, making small transducer suitable for near focusing and large probes suitable for grater depth focusing. A curved probe surface, an acoustic lens or a delayed stimulation of the transducer elements gives the possibility to tune the beam divergence and radial direction.
The geometrical arrangement of several acquisition lines along different directions produces 2D and 3D ultrasound data. For this reason most algorithms in ultrasound imaging are developed as 1D processing techniques, and then applied to each image or vo-lume scan line.
The fan scan is one of the most used ultrasound rays configu-rations and it is advantageous when the organ to be investigated is protected by structures unpenetrable by ultrasound and requires a small interface area of the transducer. A fan scan transducer is used, for example, to image the prostate by trans-rectal ultrasound (TRUS). The main disadvantage of the fan scan probe is the reduc-tion of lateral resolureduc-tion along the axial depth. Furthermore the echo data are recorded in polar (r,θ)-coordinates and need a con-version into Cartesian coordinates and interpolation before
dis-playing on monitors.
From the point of view of image analysis, the fan scan configu-ration does not constitute an additional difficulty, because the line signals are processed directly in the (r,θ)-space, where they ap-pear as a standard rectangular image. The (r,θ)-space is always the reference, unless the processing algorithms require the knowl-edge of the real anatomical shapes of the imaged scene or in case the processing results are forwarded to physicians as a map on the anatomical image.
The three phenomena contributing to the realization of an ultra-sound echo are (a) the pure reflection from a smooth surface, (b) the diffuse reflection from a rough surface and (c) the refraction, this latter causing artefacts during image formation which consid-ers possible only line transmission. A fourth factor characterizing the echo is (d) the diffusion caused by interaction with many rough surfaces smaller than the ultrasound wavelength. In this case the pulse is diffused in all directions, determining a random compo-nent of the ultrasound signal, called scattering. The presence of scattering in the recorded echo makes the signal non-stationary.
Nevertheless the RF signal can be considered stationary in a homogeneous area, where it is characterised by a slowly varying amplitude and a stationary random component. The RF signal can, thus, be decomposed into its local mean value, representing the echogenicity of the area, and a variable component represent-ing the speckle noise, a complex type of disturbance usually mod-elled as multiplicative.
Although the speckle noise is dependent on the acquisition sys-tem properties, it also contains some information about the im-aged area, intuitively linked to the texture appearance in ultrasound images. While image processing, aimed at improving the visual quality of ultrasonographies, are focused on suppressing speckle noise, image analysis techniques are often interested in captur-ing as much information as possible from this random component which can be useful for tissue characterization.
One more important characteristic of the RF signal is the fre-quency shift: as signal attenuation increases with frefre-quency, dur-ing propagation the high frequency components of the echo signal are more attenuated than the low frequency ones, globally reduc-ing the value of the central frequency of the received signal. The frequency shift may also deteriorate the radial resolution, but the estimation of these changes are useful to study the attenuation of different types of materials and thus perform tissue
characteriza-1.1. DIAGNOSTIC ULTRASOUND 9
Figure 1.2: Standard signal processing chain in medical ultrasound acquisition systems. The signal recorded by the probe is the raw RF echo signal, while the final output displayed on monitor is the envelope of the base-band signal.
tion. The knowledge about the frequency shift can also be used to compensate the attenuation independently for each ray during time-gain compensation (TGC) procedures and restore the origi-nal echo spectrum.
Since the dynamic range of the RF signal is very large because of the different amplitude of strong reflection components and weak scattering, a logarithmic transform is employed to reduce echo dynamics before digitalization. The final digital raw signal is obtained by sampling the recorded signal, amplified and pro-cessed by TGC and logarithmic transform. The sampling frequency is chosen in the range of 20-60 MHz and the number of bits used for quantization is between 16 to 24.
In medical ultrasound imaging the standard signal processing chain performs a demodulation of the RF signal by Hilbert Trans-form, providing the in phase-quadrature signal (IQ), and computes the envelope as the module of the IQ analytic signal. Dealing with the envelope allows a decimation of the signal according to the re-duction of its band and provides a better visualization of the sound image. A scheme of the standard processing chain in ultra-sound imaging is shown in figure 1.2.
The base-band signal or B-mode signal is the standard output of an ultrasound acquisition system, while the original RF signal is the unprocessed information acquired by the probe. The basic principle of most tissue characterization techniques in ultrasound is extracting as much information as possible from both the base-band signal and the RF signal.
(a) (b)
Figure 1.3:Rectangular ROI segmentation inside the prostate region is illustrated in figure 1.3(b), while figure 1.3(b) shows irregularly shaped ROIs.
1.2 Tissue characterization
The final purpose of biomedical image analysis is tissue characte-rization. In practice the analysis consists in segmenting the image into several regions of interest (ROIs), computing some characteri-stics, features or measures related to each ROI and classifying them into one of few known categories. Any category represents a par-ticular state of the tissue outlined in a ROI; the simplest case is bi-nary classification, aimed at discriminating a normal and patholo-gical tissue, neglecting the presence of benignant abnormalities.
ROIs can be defined as irregular shaped areas in the image, fol-lowing some anatomical characteristics of the imaged tissues; al-ternatively they can be chosen as rectangular regions covering the whole image, with or without overlapping (figure 1.3). While rect-angular tessellation can be easily performed by computers, seg-mentation of ultrasound images into irregular regions requires ei-ther a manual procedure or a complex automatic algorithm sub-ject to high degree human supervision.
Ultrasound image segmentation presents some characteristic artefacts that make the segmentation task complicated, and al-most impossible by means of standard image segmentation tech-niques. In fact, while in other areas of medical imaging (CT, MRI) the application of standard image processing methods is sufficient to obtain good segmentations, in ultrasound satisfactory results can only be achieved by specific methods. A review of segmen-tation techniques in medical imaging is provided by [3] and [4].
The ROIs consist of a two-dimensional arrangement of recorded RF signals, which are used to compute some features useful to
clas-1.2. TISSUE CHARACTERIZATION 11 sify the state of the outlined tissue. Let us consider the extrac-tion of N different features from each ROI: they can then be rep-resented as a point x = x1,··· , xNf in an Nf-dimensional feature space. ROIs with similar characteristics will form clusters in the feature space.
The first step in tissue characterization is the selection of sig-nificant features which are able to capture the discriminant cha-racteristics of normal and pathological tissues, ideally providing a representation of different tissues in the feature space as separate clusters. In the end, a pattern classification step in image analysis is aimed at defining the optimal decision boundary in the feature space to separate normal and pathological tissues.
The construction of the optimal decision boundary for tissue characterization is possible thanks to supervised pattern classifi-cation techniques based on an accurate medical ground truth. The collection of a large number of ultrasound images from biological tissues and their corresponding histological examination is essen-tial to create a ground truth, which is used in the design of a clas-sification algorithm and its validation.
Ground truth data are divided into a training set and a test-ing set. The traintest-ing set consists of a set of ROI-label pairs, al-ready classified by a chosen gold standard like histological anysis, which are used to perform the learning of a classification al-gorithm. The testing set instead is used to validate the alal-gorithm. Test ROIs labels are used only to compute the performance crite-ria and do not provide any further information to the classifier. In some cases also a validation set is extracted from the ground truth in order to tune some parameters of the classification algorithm.
The main problem in ultrasonic tissue characterization is the absence of a public standard database, also for very common and highly diagnosed diseases, as prostate carcinoma or breast tumour. One fundamental contribution of this research is the realization of a large ground truth database for prostate cancer, collected in collaboration with the department of Urology of the University of Bologna.
In ultrasound imaging, system effects and tissue micro struc-tures affect in a complex way the signal and the speckle noise, thus any conclusion about tissue characterization is valid under the same conditions and equipment settings. Nevertheless algorithms designed to make the signal less dependent on acquisition system adjustments can be employed to provide more efficient tissue cha-racterization.
Reducing system effects
Ultrasound imaging acquisition systems can affect and deteriorate tissue response. In order to reduce these undesirable effects and, hopefully, obtain a higher quality and more significant image, sev-eral processing techniques based on image formation linear mod-els were developed.
The most common two-dimensional linear image formation model is defined through a convolution operator:
x = H(w) +µ
x[n, m] = P
kPlh[n − k, m − l ]w[k, l ] +µ[n, m] (1.1) where x is the image, w is the tissue response to be recovered, H is the linear operator accounting for system effects which defines the point spread function (PSF) h, and µ is some additive term accounting for both experimental and model noises. The inverse problem of recovering w is also named as deconvolution [5]. In medical ultrasound imaging the PSF is usually not known and is estimated together with the true image w. In this case the prob-lem is referred to as blind deconvolution [6].
The problem with model (1.1) is that the presence of tissues be-tween the transducer and the target changes locally the PSF which cannot be considered shift-invariant in the whole in vivo image. The presence of phase aberration and dispersive attenuation in ul-trasound imaging lead necessarily to a spatially variant model for the PSF, which requires a non stationary deconvolution.
The most used technique to deal with shift-variant convolution kernel is to segment the image in several areas where the signal can be considered stationary and the local PSF shift-invariant. An alternative to this approach is the employment of adaptive algo-rithms based on models able to change their characteristics along with the signal.
Furthermore, although the image formation model is expressed in 2D, ultrasound imaging deconvolution algorithms are often de-veloped in 1D and separately applied along the lateral and axial direction. Anyway it is common practice to perform deconvolu-tion along the axial direcdeconvolu-tion only, as the PSF is wider. In this case the convolutional model becomes:
x[n] =X k
h[n − k]w[k] +µ[n] (1.2) The separability of the PSF allows one to reduce the problem of a 2D deconvolution to a sequence of 1D deconvolution problems,
1.2. TISSUE CHARACTERIZATION 13 applied along each direction independently. Specifically, it is as-sumed that the 2D convolution kernel can be expressed as product of two one dimensional convolution kernels along the two direc-tions: the axial PSF includes the blurring effects due to the finite bandwidth of the transducer and the dispersive attenuation of the acoustical pressure pulse in tissue, the lateral PSF represents the convolutional components of lateral blurring due to the complex beam pattern.
One of the classical methods of blind deconvolution used in medical ultrasound imaging originates from the theory of system identification and is based on statistical modeling. An efficient statistical method for deconvolution assumes the RF signal to be an autoregressive moving average (ARMA) process and estimates model parameters to recover the tissue response. Hence, in this interpretation, the RF-signal x[n] is considered to be the output sequence of a causal filter h[n], while the tissue response or reflec-tivity function, w[n], is thereby considered to be an input driving sequence. The latter is commonly assumed to be a realization of an independent and identically distributed process of zero mean and fixed variance.
ARMA models present highly flexible modeling capability, be-cause they integrate properties of AR models, useful for modeling random signals that possess peaky power spectral densities, and properties of MA models, more appropriate for signals that have broad peaks or sharp nulls in their spectra.
For the case of ultrasound imaging the choice of an ARMA model is well justified. This is because the spectra of the RF lines are nor-mally wide-peaked, and, since the requirement of stationarity im-poses limitations on the range of sampling intervals, stationary RF signals are usually short in duration. ARMA modeling is appropri-ate in this context, since it provides a well-posed estimation prob-lem with fewer parameters than observations and is characterized by excellent modeling capability for relatively low orders and for short data segments.
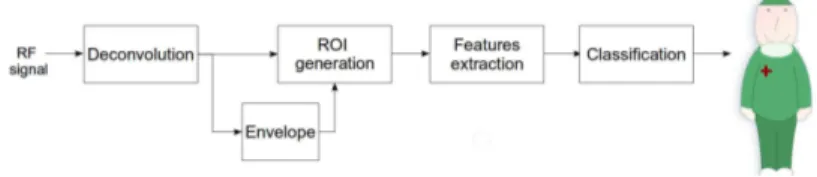
While deconvolution techniques are generally used to improve the visual quality of ultrasound image, in this work it is introduced as a preprocessing step in the standard tissue characterization pro-cedure, in order to enhance the diagnostic significance of ultra-sound features. A scheme of the proposed tissue characterization protocol is shown in figure 1.4.
Figure 1.4:Proposed characterization procedure with the addition of deconvo-lution to improve diagnostic performance.
Feature extraction and selection
A large number of features were designed to extract interesting in-formation from the ultrasound RF signal. The B-mode signal enve-lope itself can be considered as a feature containing all the visual information available to the physician.
The features derived from the RF signal developed for tissue characterization usually belong to one of these three classes:
• Spectral: these features gather information about the spec-tral behaviour of the RF signal. This may include the study of the frequency shift and the related attenuation; the spec-tral decomposition of the coherent and random component of the signal; multi-resolution analysis by wavelets or the es-timation of any mathematical model for the spectrum. • Statistical: the RF image can be modeled as random samples
from some statistical distribution. The parameters of such a distribution can be estimated locally and provide statistical features.
• Textural: these characteristics give information about the ar-rangement of grey levels and are computed from the B-mode signal. Textural features represent the closest attributes to what is processed by human brain when analysing an image. The number of features can increase rapidly as new models for the RF signal or new attributes are proposed. The rise in dimen-sionality can only apparently make the discrimination task easier. In practice not all the features extracted are interesting for tissue characterization. Furthermore high dimensionality causes more complex classification models which tend more likely to overfit the
1.2. TISSUE CHARACTERIZATION 15 training data. For this reason it is essential to select few significant and non-redundant features.
Feature selection algorithms [7] focus on the realization of the optimal feature subset for a certain problem, according to a dataset containing feature values for any sample and the corresponding category. In the context of image feature selection, the dataset is constituted by feature values from any ROI and the information about the pathological state of the tissue imaged by the region. The selection approaches can be roughly divided into three categories: filters, wrappers and hybrid methods.
Filters sort features according to a score measure that sum-marizes the importance of a feature with respect to the state of the tissue. Typically, the ranking criterion can measure either dis-tance, information, dependency, or consistency between features extracted from each ROI and the respective class. Filters measures are independent on any classification algorithm.
On the contrary, wrappers sort attributes from a feature set ac-cording to the performance of a classifier trained on that feature set; they are thus classifier-dependent and require a larger com-putational cost.
Hybrid methods take advantage both of filter and wrapper meth-ods. The filter measure is used to decide the best subset for a given cardinality, while the wrapper mining algorithm selects the final best subset among the best subsets across different cardinalities.
In general a complete search procedure is never adopted in feature selection because of its huge computational cost; on the contrary, although they cannot guarantee that the actual best fea-ture subset is selected, forward and backward sequential search or random search techniques are preferred because of their lower computational cost.
The above methods are obviously supervised since they take advantage of the information about tissue state, but also unsuper-vised methods such as principal component analysis (PCA) can be useful, above all in order to reduce redundancy in subsets where features have similar informative value. An unsupervised method can thus be used as a first step to discard redundant attributes and a second step of supervised feature selection can subsequently be applied to further reduce the feature set, eliminating attributes ir-relevant for the particular classification problem.
A complete feature selection scheme can be tested by intro-ducing artificially designed irrelevant and redundant attributes in a benchmark feature set; an efficient feature selection algorithm
must be able to detect and discard these test attributes.
ROI classification
The goal of image tissue characterization is employing the feature set to build a classifier able to discriminate between different cat-egories of imaged tissues. Among the several approaches to classi-fication existing in literature [8], non linear discriminant analysis through kernels is used in this thesis to take advantage of the non linear mapping of the feature space and ease the classification task for real data.
In supervised machine learning the data set (xk,ck) composed of ROI feature vector and label pairs is used to determine the pre-dictive model representing the relationship c = f (x) between the input variables x and the output variable c. It is the knowledge about class labels ckto make the learning problem supervised.
The found predictive model is then used to separate in the fea-ture space and normal and pathological ROIs. In this case the clas-sification problem is binary and the label index ckcan only assume two values, for example 1 for benignant tissue and 2 for pathologi-cal tissue.
A linear model f (x) employs a predictive function represented by an hyperplane in the feature space, whose parameters w and
b are determined using classical criteria such as least squares or
maximum likelihood:
f (x) =< w, x > +b (1.3) In this case the predictive model is also called discriminant func-tion. Traditional linear methods give the same importance to all samples in the dataset and this can easily provide non efficient lin-ear separation, because of the excessive influence due to samples very far from the separation boundary.
A way to overcome this problem is focusing on those training examples which lie close to the class they do not belong and, thus, close to the boundary. These samples are called support vectors and in this approach they are the only data that explicitly define the model. A linear model in terms of support vector, sv, is ex-pressed as in the following:
f (x) = X
i∈sv
1.2. TISSUE CHARACTERIZATION 17 where the summation includes only the training examples xi that are support vectors, and αiare coefficients determined as Lagrange multipliers in the optimization procedure.
An advantage of this approach is that the classifier concen-trates directly on examples sv that are difficult to classify and its computation scales with the number of support vectors rather than the dimension of the space which can be very large. In addition this approach is shown to balance training classification error and model complexity, thereby avoiding overfitting, a situation in which the model is too finely tune to the training examples and fails to perform well on new data.
When real ultrasound data are analysed, linear separation is generally not possible in the feature space, even if a large number of features is employed. In this condition it is important to exploit techniques providing a simple way to obtain a non linear model from any linear model based on inner products. Even classical techniques can be turned easily into flexible non linear techniques via the so called kernel trick.
According to this technique, a non linear function φ mapping the data into a different higher dimensional feature space can be applied. After this transformation separability will be enhanced thanks to the higher dimension of the mapped space, which can also be infinite. The kernel trick recognises that the classification in this new space can be obtained without actually performing the transformation, because the transformation φ applied to samples in predictive function only appears in the form of an inner prod-uct. Therefore non linear approaches can be performed efficiently by using kernel functions K(.,.) which act like dot products in the re-mapped feature space [9].
It is never actually necessary to compute φ or to define it ex-plicitly. Instead it is sufficient to define the kernel function K(.,.), and it can be shown that any symmetric positive semidefinite func-tion suffices.
For each ROI sample, x, the kernel approach provides its pro-jection onto a vector in F , expressed as an optimized linear combi-nation of the inner products of the mapped sample and a sequence of mapped support vectors:
X i∈sv ai<φ(xi),φ(x) >= X i∈sv aiK(xi,x). (1.5)
The combination weights aiare tuned to maximize the inter-class variance and minimize the intra-class variance of data in the mapped
space. Intuitively, the effect of the kernel is to measure the simi-larity between a test vector x and each of the support vectors. In fact vectors belonging to one of the classes are presumably most similar to the support vectors belonging to that class, hence these similarity values provide us with the information to build the pre-dictive function.
In non linear data transformations an appropriate kernel for representing the similarity of a mapped sample to the support vec-tors is the radial basis function (RBF) kernel:
K(xi,x) = exp à −kxi−xk2 2σ2 r b f ! . (1.6)
The kernel variance σ2
r b f is tuned by cross-validation on a valida-tion data set. In particular, a part of the dataset is reserved to per-form several tests varying the value of σ2
r b f, in order to find the optimal value for this parameter, which provides the best classifi-cation performances.
Cross-validation is one of the techniques for statistical resam-pling used to evaluate performance and improve robustness of ma-chine learning models and to estimate statistical significance lev-els. These techniques are as important as the predictive model it-self.
After non linear transformation, a linear classifier can be used in the mapped space to find the discrimination hyperplane de-fined by the following predictive function:
f (x) = X
i∈sv
aiK(xi,x) + b. (1.7)
Linear classifiers are suitable to classify kernel transformed data, which are characterized by a better separation in the new feature space. For example, the Fisher Linear Discriminant (FLD) approach tunes the parameters of the linear model in (1.3), w and
b, by maximizing the Mahalanobis distance and in such a way that
different clusters have the same distance from the hyperplane. The Mahalanobis distance J between two clusters belonging to differ-ent classes is expressed through the intra class mean value µi and covariance matrix Σi of class i :
J = (µ1− µ2)T(Σ1+ Σ2)−1(µ1− µ2) (1.8) The performance indicators computed on the testing set of-fer a way to assess the diagnostic validity of a CAD scheme. In a
1.3. APPLICATION:PROSTATETRUS 19 binary tissue characterization problem, where the two categories benignant/malignant tissue are available, it is common to define True Positives (T P) the pathological samples classified as malig-nant, False Positives (F P) the misclassified normal regions, True Negatives (T N ) the normal samples classified as benignant, False Negatives (F N ) the misclassified pathological regions.
According to these definitions, besides accuracy (ACC), the stan-dard performance criteria are sensitivity (SE) and specificity (SP), giving information about the ability in recognizing pathological and normal tissue respectively. The prediction capability of the method is also expressed by the probability that a malignant clas-sified sample is actually pathological. This information is provided by the positive predictive value (PPV ). The performance indica-tors are resumed in the following:
ACC = T P +T N+F P +F NT P +T N SE = T P +F NT P SP = T N T N+F P P PV = T P +F PT P (1.9)
The above definitions of performance criteria consider a re-gion as a sample of the dataset, but according to the focused scale of the problem, also pixel-based, core-based and patient-based performances can be defined, considering as sample of the dataset respectively the pixel, the core or the patient.
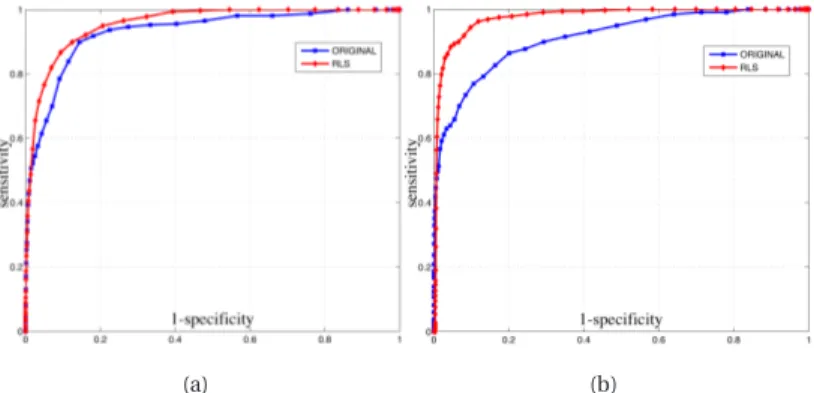
The variation of the threshold in a linear classification method allows the complete description of the classifier performances, which can be visualized in a receiver operating characteristic (ROC) curve plotting the (SE ,1−SP) graph. The area under the ROC curve is also specific of the method diagnostic accuracy which increases as the area approaches the unit value.
1.3 Application: prostate TRUS
One of the applications where Computer-Aided Detection (CAD) tools would be extremely valuable is the recognition of prostate cancer in trans-rectal ultrasound (TRUS) images. Some informa-tion about the physiology and pathology of prostate gland will be presented in the following paragraphs.
The main function of the prostate is to store and secrete a clear, slightly alkaline (pH 7.29) fluid that constitutes 10− 30% of the vo-lume of the seminal fluid that, along with spermatozoa,
consti-Figure 1.5:Schematic representation of the prostate gland.
tutes semen. The rest of the seminal fluid is produced by the two seminal vesicles.
A healthy adult human prostate is a chestnut shaped gland en-veloped in a fibrous capsule. Its base is attached below the urinary bladder neck and the apex is fixed to the urogenital diaphragm. It borders on the posterior side with the rectum and on the an-terior side with the fibromuscolar stroma connected to the pubis through the puboprostatic ligaments. On the superior posterior side it is attached to the seminal vesicles, a pair of simple tubular glands that secrete a significant proportion of the fluid that ulti-mately becomes semen. The excretory ducts of seminal vesicles open into the vas deferens, as they enter the prostate gland, and they are lined with the epithelium of the transition zone. Within the prostate, the urethra coming from the bladder is called the static urethra and merges with the two ejaculatory ducts. The pro-state is finally sheathed in the muscles of the pelvic floor, which contract during the ejaculatory process.
The prostate gland is divided in three different zones: the tran-sition zone (TZ), the central zone (CZ), and the peripheral zone (PZ) (figure 1.5). The transition zone surrounds the urethra and ex-tends from the ejaculatory ducts proximally. The peripheral zone encompasses the urethra from the base to the apex. The central zone is composed of tissue immediately surrounding the ejacula-tory ducts and it expands inferiorly. The significance of this archi-tecture is based upon the relationship of these three zones to pro-static disease [10]. In the young males the peripheral zone com-prises 75% of prostate volume, the transition zone 20% and the
1.3. APPLICATION:PROSTATETRUS 21 central zone 5%. These ratios change and after the age of 40 years the transition zone may enlarge ad occupy most of the gland as benign hyperplasia is almost inevitable.
The prostate gland is the male organ most often smitten by ei-ther benign or malignant lesions and the second leading cause of cancer death for men [11]. Prostate diseases can be distinguished in three main categories: prostatitis, benignant hyperplasia and prostate cancer.
Prostatitis is an inflammation of the prostate gland. It is a be-nign pathology and in its acute case it is mainly treated with an-tibiotics.
Benign hyperplasia (BPH) consists in a prostate enlargement. It is fairly common among ageing men and it occurs mainly in the transition zone. BPH can be treated with medication, a minimally invasive procedure or, in extreme cases, with a surgery procedure that removes the prostate.
Prostate cancer, often referred as prostate carcinoma (or ade-nocarcinoma), is a malignant pathology and, as all cancers, it is characterized by an abnormal and uncontrolled cells mutation and replication. Like BPH, prostate cancer might cause pain, difficulty in urinating, problems during sexual intercourse, erectile dysfunc-tion and other symptoms. If not detected on early stages and in presence of more aggressive forms, the disease can advance to stages characterized by local invasion of the surrounding tissues (seminal vesicles, bones, rectum), usually resulting in lethality.
The heterogeneous and multifocal nature of prostate cancer le-sions poses significant difficulties in its detection. With regards to heterogeneity, prostate cancer tissue typically reveals a juxtaposi-tion on benign cells, preneoplastic lesions and neoplastic lesions of varying severity [10].
The current clinical procedure to detect cancer is based on a combination of different diagnostic tools, because none of these tools is accurate enough to be used alone. Digital Rectal Exam-ination (DRE), Prostate-Specific Antigen (PSA) evaluation, TRUS image analysis and biopsy are all part of the medical procedure for prostate analysis. Each of these tools presents important lim-itations that make accurate prostate cancer detection still an un-solved problem.
Historically, DRE has been the principal method of prostate analysis, but it is accurate only at detecting large and superficial lesions and it is strongly operator dependent.
mea-Figure 1.6: The picture on the left gives a schematic representation of prostate axial section with orientation inverted respect to its real anatomy. On the right a TRUS image shows the prostate gland in the same orientation.
surement of the blood PSA level, a glycoprotein produced almost exclusively in the epithelium of the prostate gland. Unfortunately, PSA is specific for prostate but not for cancer, since other factors such as BPH, prostate infection, urethral instrumentation and irri-tation can cause an increase in the PSA value.
At TRUS, the normal prostate gland has a homogeneous, uni-form echo pattern. The appearance of carcinoma on ultrasound is variable and in its early stages a tumour can appear anechoic, hypoechoic or isoechoic with respect to the surrounding normal tissues. Potential hypoechoic regions could also include BPH or even normal biological structure, thus the specificity of the TRUS images visual inspection is low.
Standard TRUS images show the axial or the lateral section of the prostatic gland. The gland anatomical shape is inverted in the image due to the acquisition setting, as shown in Fig. 1.6, where the superior hyperechoic boundary marks the interface between the rectum and the peripheral zone of the prostate. The transition zone is visible as a darker region below the peripheral zone. The gland contours are generally well defined and visible in the images. The histopathological analysis of biopsy samples is the stan-dard for cancer detection confirmation.
The dominant and most reliable method for prostate carcinoma diagnosis and aggressiveness assessment, in research as well as in clinical procedure, is the Gleason grading [12]. This method is based entirely on the histological evaluation of carcinomas cells arrangement patterns in contrast agents stained prostatic tissue sections. Specifically, the method is a categorization of glandular differentiation and pattern of growth of the tumour, at relatively low magnification (×10 - ×40) in five basic grades patterns [12].
1.3. APPLICATION:PROSTATETRUS 23 Due to the heterogeneous nature of prostate cancer lesions, histopathological inspection of prostate tissues often reveal an en-semble of benign lesions, prenoplastic lesions and neoplastic le-sions with different aggressiveness. To take into account this het-erogeneity, the five basic grade patterns are used to generate an histological score, which can range from 2 to 10, by adding the pri-mary grade pattern and the secondary grade pattern. The pripri-mary pattern is the one that is predominant in area, by simple visual in-spection. The secondary is the second most common pattern.
The Gleason grading score is therefore and indicator of can-cer stage: the higher the grade is, the more advanced the cancan-cer is. Typically, cancers with Gleason scores lower than 6 are con-sidered well differentiated and associated with a good prognosis. Those with a Gleason score of 8-10 have the worst prognosis and the highest risk of recurrence. Gleason score is often combined with PSA level and clinical stage for risk assessment. The primary goal of staging is to distinguish patients with organ-confined, lo-cally invasive, or metastatic diseases.
Ultrasounds are used for biopsy guidance, to enable the sam-pling of all relevant areas of the prostate by means of systematic sampling protocols [13]. However, the main limitations in this pro-cedure are due to the multifocal nature of cancer and to the sam-pling process.
In fact, uniquely among image-guided biopsies, prostate bio-psy is not lesion-directed but rather based on a systematic sam-pling of those areas where cancer incidence is higher. As the dis-ease is often multi-focal, different areas throughout the whole gland are sampled. In particular, since most of the cancers arises in the peripheral zone, most of the protocols aim to maximize its sam-pling. The motivation behind this, as discussed before, is the weak diagnostic significance of imaging inspection techniques due to the high variability of prostate cancer patterns.
Ultrasound imaging is thus used to guide and monitor the bio-psy needles insertions in the different areas of the prostate gland. Since metal, if compared to soft tissues, has an high acoustic impe-dance, biopsy needles appears as hyperechoic lines in TRUS scans, as shown in figure 1.7.
The first landmark sampling technique was the sextant proto-col reported in 1989 [14]. As originally described, six biopsies were obtained in a parasagittal line drawn halfway between the lateral border and midlines bilaterally, from the base, midgland and apex, as shown on the left side of figure 1.7.
Figure 1.7: The picture on the left gives a schematic representation of double sextant biopsy protocol. On the right a TRUS image shows the insertion of biopsy needle in the prostate.
Although sextant biopsy protocol was a major advance, with a 20-25% of positive biopsy rate, with a wider experience it was found also inaccurate, principally because it under-samples the peripheral zone [13].
Modifications of the sextant protocol were introduced from the mid 1990s onwards. For example, in the modified sextant biopsy protocol a better sampling of the peripheral zone around the lat-eral margins is obtained moving latlat-erally and angling anterolater-ally the biopsy trajectories. This improved in some cases the de-tection rate from 80 to 89 % [13].
However, even the modified sextant protocol was found to miss some tumours with time and many alternatives where explored. Therefore, several extended protocols using more cores (8 or 10) directed to the peripheral zone were introduced. Although the available results show that the extended protocols can improve di-agnosis accuracy it is still a matter of debate whether extended protocols are substantially better than the modified sextant pro-tocol.
As regards patients perception of this examination, it was doc-umented that 55% of men report physical discomfort during bio-psy. Moreover, this procedure is not completely safe, since it car-ries the risk of bleeding infection or even urosepsis [15].
Research to improve the efficiency of the standard prostate bio-psy protocol is proceeding both from an image processing point of view and from a purely clinical perspective. In fact, as discussed before, the positive predictive value ppv0of this protocol, that is the probability of sampling a pathological core given a
pathologi-1.3. APPLICATION:PROSTATETRUS 25 cal patient, is quite low, between 20 and 25%. As the probability to detect the disease in a pathological patient increases with the number of samples N0, according to 1−(1−ppv0)N0, the detection rate of the protocol is about 89%. The inefficiency of this protocol stems from the fact that most of the sampled tissue is benignant and, thus, represents an unnecessary biopsy.
In order to improve the efficiency of the prostate biopsy proto-col it is essential to increase the PPV , in such a way that the clini-cal procedure can preserve the same detection rate of the standard protocol with a reduced number of cores.
Since the processing of TRUS images highlights important cha-racteristics of the investigated tissues, tissue characterization tech-niques can be employed to increase the PPV , providing the radi-ologist with a malignancy map to perform lesion-directed biopsy. In this new scenario the number of unnecessary biopsies would be reduced, while preserving the same diagnostic power as the stan-dard protocol.
Two
U
LTRASOUND IMAGE ANALYSIS
AND INTERPRETATION
I imagine this is because Nature wants to ensure that the evils of wisdom shall not spread further throughout mankind. Desiderius Erasmus of Rotterdam (1466 - 1536)
C
OMPUTER-AIDEDdetection schemes are decision making sup-port tools, useful to overcome limitations of problematic clin-ical procedures. The topic treated in this thesis is the study and the realization of CAD techniques based on trans-rectal ultrasound im-ages, which may be extremely important to support prostate can-cer diagnosis.First works on TRUS-based CAD schemes for detection of pro-state cancer consisted on biopsy ground truth and analysis of rect-angular regions around needle insertion points. The main charac-teristic of these studies is the use of textural features extracted from TRUS images to discriminate different tissues. Basset et al. [16], Huynen et al. [17] and Houston et al. [18] realized clinical studies based on the extraction of first and second order statistics textural parameters and used simple decision trees to perform classifica-tion.
After these works, the main trend shifted to a multi-feature ap-proach, extracting features of different nature from TRUS images and combining them to obtain higher classification performance. Schmitz et al. [19] and Scheipers et al. [20] employed textural fea-tures and spectral parameters extracted from RF data, while Feleppa et al. [21] introduced clinical data like PSA value and pa-tient’s age in the feature vector besides spectral parameters.
The classifiers used for these works (self organizing Kohonen map, neuro-fuzzy systems, Artificial Neural Network) are more
complex with respect to decision trees and define a new direction in this research field. Furthermore in these works the ground truth comes not from biopsy but from prostatectomy and histological analysis of prostate slices.
The work of Mohamed and Salama[22] represents an exception since the gold standard is based on radiology visual inspection. The proposed scheme utilizes a pure textural feature vector with a Support Vector Machine (SVM) classifier. In this case the values of sensitivity, specificity and area under ROC curve are high, but they are obtained on a small ground truth.
Similar performance was obtained in latest studies like the ex-tension of Mohamed’s work [23] which includes spectral features and the study performed by Han et al. [24], where morpholog-ical features and multi-resolution textural features are employed and SVM is used as classifier. In the latter work notable values of sensibility and specificity are reported, but the proposed method was only tested on malignant images, thus there is no information about its behaviour in completely healthy cases.
This chapter presents an effective approach to realize a CAD scheme for prostate cancer detection, employing a multi-feature nonlinear classification model and the predictive deconvolution of the acquired RF signals to reduce system-dependent effects.
The mutual information of feature values and tissue pathologi-cal state is used to select, among several analysed ultrasonic cha-racteristics, the features essential for tissue characterization.
A clinical study, performed on ground truth images from bio-psy findings, provides a comparison of the classification model ap-plied before and after deconvolution, showing in the latter case a significant gain in accuracy and area under the ROC curve.
Here the aim is to investigate the ability of the features extracted from deconvolved US images at discriminating pathological tis-sues. This issue is analysed in terms of performance comparison of a nonlinear classification model trained on features extracted from US images, with and without deconvolution preprocessing.
In addition, while rectangular ROIs are usually employed in ultrasonic tissue characterization literature, we propose an algo-rithm for irregular shaped ROIs segmentation and perform analy-sis to test the usefulness of this segmentation for tissue characteri-zation purposes, without including the deconvolution step.
A large number of features is extracted from US RF signal to characterize different aspects of biological tissues. The combined use of features of different nature results in more accurate tissue
2.1. DIMENSIONALITY REDUCTION 29 characterization, but requires a critical operation of feature selec-tion to identify features highly correlated to the pathological state of the tissue.
In our approach a hybrid feature selection algorithm based on the mutual information of feature set and ground truth class is used to prune unimportant features and achieve fast computation. The ground truth used in this clinical study is based on biopsy findings and histological analysis of some regions in the images considered suspicious at visual inspection by expert radiologist.
The proposed CAD scheme was tested on a ground truth con-taining both benignant and malignant cases.
The analysis of the CAD scheme employing irregular shaped ROIs shows that non linear classification ensures in this case a sen-sitivity always greater than 80%, but provides a limited specificity.
Furthermore, the addition of predictive deconvolution in the proposed CAD scheme increases classification performances, pro-viding a sensitivity of 90%, specificity of 93% and area under the ROC curve of 95%.
2.1 Dimensionality reduction
Results of recent studies show that combining features extracted from RF analysis of ultrasound signals and image-based texture parameters results in more effective classification procedures [25]. Literature about tissue characterization in ultrasound analysis pro-vides a large amount of features of different nature which can be subdivided according to their contribution in highlighting some properties of the tissue.
Parameters of statistical distributions, such as Nakagami model [26], give information about scatterer density, regularity and am-plitude.
Spectral features [27] describe fluctuations of physical prop-erties as acoustic impedance, viscosity and elasticity resulting in backscattering signals. Typical spectral parameters capture the shifting of RF signal central frequency due to attenuation. Also the wavelet coefficients of RF signal, their polynomial fitting [28] and the coherent and diffuse components obtained by signal de-composition [29] belong to the spectral features group and provide important properties to type tissues.
Features extraction from B-mode images aims mainly at the detection of textural properties of speckle which represents the
macroscopic appearance of the scattering generated by tissue mi-crostructures. Different kind of textural parameters are available in literature. Haralick [30] and Unser features [31] are both based on the gray levels distribution statistics, while Fractal features [32] rely on modeling and computation of fractal dimension. In our ap-proach, the characteristic skills of different features are combined to define a feature set endowed with a high discriminating power between healthy and cancerous tissues.
A complete feature set of all parameters mentioned before would have a huge dimensionality of about 140 attributes and is described in appendix A. For this reason, a first selection step is performed keeping for each group of features only those correlated
to the
ground truth class, and discarding the other ones.
The feature set is built from the ground truth dataset that will be described in section 2.5, computing features on rectangular over-lapping ROIs selected from the images. The feature data matrix is represented as S = [f1| · · · |fNf], where fi is the i -th feature vector with a value for each ROI, such that S is a matrix of size NRO I×Nf: number of ROI × number of features. The ground-truth class vec-tor, containing the index representing the pathological state of the tissue outlined by a ROI, is expressed by c of length NRO I.
By selecting feature through correlation analysis, the dimen-sionality is reduced, but synergies between different features are saved. The defined feature set is constituted by 54 features, as shown in table 2.1.
Table 2.1:Feature Set
Feature Origin/Type # Wavelet Transform (WT) RF/Spectral 2 Polynomial Fit of WT RF/Spectral 1 Wavelet Decomposition RF/Spectral 1 Central Frequency RF/Spectral 1 Attenuation RF/Spectral 13 B-mode B-mode/Envelope 1 Nakagami RF/Statistic 4 Statistic RF/Statistic 2 Haralick B-mode/Textural 4 Unser B-mode/Textural 9 Fractal B-mode/Textural 16
The importance of CAD in diagnostic ultrasound imaging de-pends on its ability to perform nearly real-time classification in
2.1. DIMENSIONALITY REDUCTION 31 order to give a second opinion to the physician. A large feature set dimensionality prevents the use of ultrasound images auto-matic characterization as a diagnostic decision support tool, be-cause feature computation would be too demanding in computa-tional terms. For this reason a further classification-oriented Fea-ture Selection (FS) step is essential.
In particular, in our approach a Mutual Information Hybrid FS (MIHFS) algorithm is used to rank and prune the whole feature set. Ranking measures based on distance and dependency [33] were also tested and, although most of them succeed in discard-ing irrelevant features, only information based measures are able to recognize and discard redundant features. In the proposed FS technique the chosen classifier-independent measure is the min-Redundant Max-Relevance (mRMR) criterion proposed by Peng et
al. [34]. The mRMR measure is based on mutual information
be-tween the current feature set and ROI class, corrected by the aver-aged mutual information between features in the feature set. Max-imizing this measure allows to define a feature set with maximum relevance D(S,c) and minimum redundancy R(S), by maximizing the mRMR measure: max S D(S, c) D(S, c) = 1 |S| X fi∈S I (fi,c) (2.1) min S R(S) R(S) = 1 |S|2 X fi,fj∈S I (fi,fj) (2.2) S = argmax Φ(D,R) Φ(D,R) = D − R (2.3) where I(X ,Y ) is the mutual information of two discrete random variables X and Y , representing two features or a feature and the ROI class: I (X , Y ) =X x∈X X y ∈Y p(x, y) log µ p(x, y) p1(x)p2(y) ¶ (2.4) The joint and marginal probability density functions, p(x, y), p1(x) and p2(y), can be estimated through the ROI-based histograms of feature values.
MIHFS is an algorithm in two steps. The filter step consists in ranking all features according to the mRMR measure, shown in (2.3), following a sequential forward selection as search technique. MIHFS wrapper step exploits a Fisher Linear Discriminant (FLD) [35] as classifier and evaluates the mining performance of the ranked
feature set at increasing set size. For different cardinalities, the subset which maximizes the mRMR measure is selected and the performances of FLD trained on this subset are computed. The best cardinality and consequently the best subset is chosen as the one performing the minimum FLD misclassification error. Typi-cally the best cardinality is smaller than the maximum number of features because the classifier over-fits on training data given by a large number of features.
Since hybrid FS algorithms require both a time-consuming search for ranking and several training iterations, FLD was selected to speed up selection experiments. For the selected subset the MI-HFS algorithm produces a ranked list of features which highlights their predictive skill. A previous analysis performed on ground truth samples has shown the reliability of MIHFS technique in dis-carding both irrelevant and redundant features. Obviously, any kind of preprocessing of ultrasound images (such as deconvolu-tion) could modify the features ranking and, in general, can im-prove or worsen the discriminating power of a feature.
2.2 Feature-based segmentation
CAD techniques relaying on imaging are typically based on the segmentation of the given image into ROIs and this task is usually performed by an expert radiologist. In order to make image classi-fication independent of radiologists skills and give them an addi-tional tool for making diagnosis, ROI segmentation may be possi-bly automated.
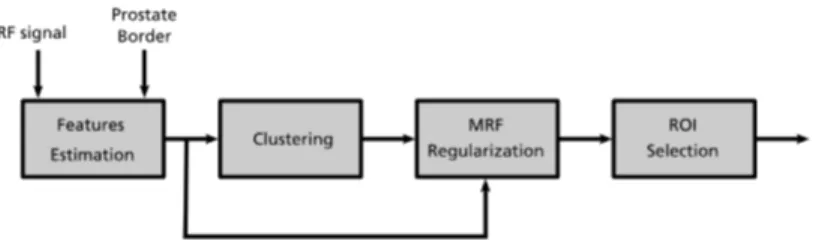
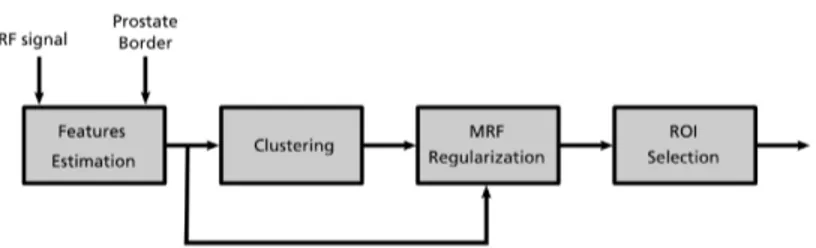
The use of rectangular and possibly overlapping ROIs makes the automation of segmentation very easy. Nevertheless irregu-lar shaped ROIs may be more interesting, since they can outline anatomical regions or abnormal structure present in ultrasound image. Segmentation into irregular shaped ROIs is less easy to au-tomatise, but still some algorithms based on ultrasonic features are able to automatically highlight significant zones.
The ROI segmentation procedure proposed in this work con-sists of two phases: feature calculation and image segmentation. In the feature calculation phase the RF signal is used to compute spectral, statistical and textural features over a rough selection of the prostate gland that can be performed also by non trained per-sonnel. These features are then used in the segmentation proce-dure, based on an unsupervised Bayesian learning technique, to