Alma Mater Studiorum – Università di Bologna
DOTTORATO DI RICERCA IN
MODELLISTICA FISICA PER LA PROTEZIONE DELL'AMBIENTE
Ciclo XXIII
Settore Concorsuale di afferenza: 02/C1 Settore Scientifico disciplinare: FIS/05 - FIS/06
TITOLO TESI
The role of the West African Monsoon in the tropical to
mid-latitudes climate
Presentata da:
Massimiliano Pasqui
Coordinatore Dottorato
Relatore
Prof. Rolando Rizzi
Prof. Rolando Rizzi
Co - Relatore
Dr. Vincenzo Levizzani
A mio figlio Francesco, a mia moglie Pierangela, ai miei genitori Alberto e Roberta.
“Bear in mind that the wonderful things that you learn in your schools are the work of many generations, produced by enthusiastic effort and infinite labour in every country of the world. All this is put into your hands as your inheritance in order that you may receive it, honour it, and add to it, and one day faithfully hand it on to your children. Thus do we mortals achieve immortality in the permanent things which we create in common. If you always keep that in mind you will find meaning in life and work and acquire the right attitude towards other nations and ages”
(Albert Einstein talking to a group of school children. 1934)
“La ragione e il torto non si dividon mai con un taglio così netto,
che ogni parte abbia soltanto dell’uno o dell’altro”.
A. Manzoni, I promessi sposi, I.
“The scientist does not study nature because it is useful;
he studies it because he delights in it, and he delights in it because it is beautiful.”
Abstract
The interaction between atmosphere – land – ocean – biosphere systems plays a prominent role on the atmospheric dynamics and on the convective rainfall distribution over the West Africa monsoon area during the boreal summer. This prominent role has been highlighted in many studies and recently has received a new emphasis due to the release of specialised datasets, both numerical and observational. In particular, the initialization of convective systems in the Sub – Sahelian region has been directly linked to soil moisture heterogeneities identified as the major triggering factors and responsible for the destabilization of the atmospheric boundary layer. Such low level conditions are favourable for convection development and propagation during the extended boreal summer (May to November). These evidences are now supported by modelling and observation study, but a “unified description” of the link between small scale and large scale dynamic behaviour still lacks. A gap thus exists between the dynamics of the single convective systems and the monsoon behaviour at sub - continental scale.
The present study aims at providing a contribution to fill this gap by investigating African monsoon large scale convective dynamics and, in particular, some characteristics of the rainfall diurnal cycle through an exploration of the hypothesis behind the mechanisms of a monsoon phenomenon as an emergence of a collective dynamics of many propagating convective systems. Such hypothesis is based on the existence of an internal self – regulation mechanism among the various components.
To achieve these results a multiple analysis was performed based on remotely sensed rainfall dataset, and global and regional modelling data for a period of 5 June-July-August seasons: 2004 - 2008. Satellite rainfall data and convective occurrence variability were studied for assessing typical spatio – temporal signatures and characteristics with an emphasis to the diurnal cycle footprint over West Africa.
Numerical modelling reanalysis datasets were studied in order to extract evidence of mutual interactions between the different components: soil dynamics, atmospheric variability, and convective occurrence footprint. Two completely different numerical representations of the physical mechanisms are analysed in order to reduce possible purely numerical effects: a global model and regional model simulations specifically developed for this analysis and based on Regional Atmospheric Modelling System – RAMS.
Results from numerical model datasets highlight the evidence of a synchronization between the destabilization of the convective boundary layer and rainfall occurrence due to the solar radiation forcing through the latent heat release. This fact can be considered as a basis of the spatio – temporal coherence, which, in turn, could be associated to the rainfall diurnal cycle. Thus, moisture provision, due to large scale and local latent heat flux, driven by solar radiation, synchronize with the convective rainfall occurrence footprint. This supports the conclusion that the studied interacting systems are associated with a process of mutual adjustment of rhythms.
Furthermore, this rainfall internal coherence was studied in relation to the West African Heat Low pressure system, which has a prominent role in the large scale summer variability over the Mediterranean area since it is acting as one of dynamic link between sub tropical and mid latitudes variability.
ACKNOWLEDGMENTS
This Phd research has been carried out at the Institute of Biometeorology – National Research Council (www.ibimet.cnr.it) and at LaMMA Consortium (www.rete.toscana.it) that I would like to acknowledge for support.
MSG-1 imagery is copyright of EUMETSAT and was made available by EUMETSAT's Unified Meteorological Archive and Retrieval Facility (UMARF). DMSP SSM/I data were obtained from the Comprehensive Large Array-data Stewardship System (CLASS) at NOAA's National Environmental Satellite, Data and Information Service (NESDIS), http://www.class.ngdc.noaa.gov. NCEP/DOE AMIP-II Reanalysis data were provided by the NOAA/OAR/ESRL PSD, Boulder, Colorado, USA, from their Web site at http://www.esrl.noaa.gov/psd/.
MERRA data (http://gmao.gsfc.nasa.gov/research/merra/intro.php) where downloaded from the Modeling
and Assimilation Data and Information Services Center (MDISC)
(http://disc.sci.gsfc.nasa.gov/mdisc/overview ).
I’m grateful to the CDO – Climate data Operators Project (https://code.zmaw.de/projects/cdo) and to Grid Analysis and Display System – GrADS (http://grads.iges.org/grads/grads.html) for providing excellent analysis and displaying tools.
I would like to acknowledge Prof. Rolando Rizzi, for his help during this period as Tutor and Doctoral Coordinator.
Special thanks and grateful go to Vincenzo Levizzani, Samantha Melani and Francesca Guarnieri for their help along this long period and in particular for sharing with me the beauty of this research. Their efforts and work were fundamental for this research.
ABOUT THE AUTHOR
Massimiliano Pasqui è nato a Roma il 5 luglio 1971. Si è laureato in Fisica nel 1996 con votazione finale 110/110 discutendo la tesi dal titolo “Effetti viscosi nella turbolenza sviluppata”, presso il Dipartimento di Fisica dell’Università degli Studi di Roma, Tor Vergata.
Dal 1998 al 2002 ha collaborato con la Fondazione per la Meteorologia Applicata (FMA) e con il Laboratorio per la Meteorologia e la Modellistica Ambientale (LaMMA) a Firenze.
Nel 2002 è diventato ricercatore a contratto all'Istituto di Biometeorologia (IBIMET) del Consiglio Nazionale delle Ricerche (CNR).
Dall'aprile 2008 è diventato ricercatore a tempo indeterminato presso lo stesso istituto.
Si occupa di meteorologia, climatologia e modellistica ambientale. Ha partecipato a numerosi progetti di ricerca Nazionali ed internazionali, tra i quali: RAMSES (E.U., 5th F.P.); DECIDE (Agenzia Spaziale Europea, ESA); EURAINSAT (E.U., 5th F.P.); STORM/ARTU (Autorità di Bacino del fiume Arno); CLIMAGRI (MIPAAF, UCEA); WINDUST (Ministero dell'Ambiente); TEMPIO (MIPAAF), C_FORSAT (MIUR – Futuro in ricerca), AGROSCENARI - Scenari di adattamento dell'agricoltura italiana ai cambiamenti climatici (MIPAAF).
Massimiliano Pasqui was born in Rome on 5 July 1971. He graduated in Physics in 1996 with a final vote 110/110, with a dissertation title: "Viscous effects in fully developed turbulence", at the Department of Physics, University of Rome Tor Vergata.
From 1998 to 2002 he collaborated with the Foundation for Applied Meteorology (FMA) and the Laboratory for Meteorology and Environmental Modelling (LAMMA) in Florence.
In 2002 he became a contract researcher at the Institute of Biometeorology (IBIMET) of the National Research Council (CNR).
Since April 2008 he became permanent researcher at the same institute.
His main research interests are dealing with: eteorology, climatology and environmental modelling. He has participated in numerous national and international research projects, including: RAMSES (EU, 5th FP); DECIDED European Space Agency (ESA); EURAINSAT (EU, 5th FP) STORM / ARTHUR (Arno River Basin Authority ); CLIMAGRI (MIPAAF, UCEA); WINDUST (Ministry of Environment); TEMPLE (MIPAAF), C_FORSAT (MIUR – Futuro in Ricerca), AGROSCENARI - Scenarios of adaptation of Italian agriculture to climate change (MIPAAF).
INDEX OF FIGURES
FIG. 2.1: COMPUTATIONAL DOMAIN FOR RAINFALL ESTIMATES HOVMÖLLER DIAGRAMS, ALSO SHOWING MAIN TOPOGRAPHIC
FEATURES... 15
FIG. 2.2: MAXIMUM SURFACE ELEVATION (M) INSIDE THE DOMAIN ALONG EACH ZONAL STRIP (0.04°) BETWEEN 18°W AND 48°E. ... 16
FIG. 2.3: OVERALL SCHEME FOR HOVMÖLLER DIAGRAM COMPUTATION... 18
FIG. 2.4: AS AN EXAMPLE STREAKS EVENTS IDENTIFIED BY THE METHODOLOGY DESCRIBED ABOVE FOR 4 DIFFERENT MONTHS: A) JULY 2004, B) JULY 2005, C) AUGUST 2004 AND D) AUGUST 2005... 19
FIG. 2.5: MONTHLY ZONAL WIND (CONTOUR) AND ANOMALY (SHADED) CROSS SECTION [M S-‐1] FOR AUGUST: A) 2005 AND B) 2007. THE DATA ARE AVERAGED BETWEEN 0° AND 10°W; CONTOURING ARE EVERY 3 M S-‐1. ANOMALY ARE COMPUTED WITH RESPECT THE 1979-‐2009 CLIMATOLOGY. ... 21
FIG. 2.6: HOVMÖLLER DIAGRAMS (LONGITUDE-‐TIME) FOR ZONAL WIND [M S-‐1] AT 600 HPA FOR AUGUST: A) 2005 AND B) 2007. DATA ARE AVERAGED BETWEEN 0° AND 20°N. INTENSE WESTWARD PROPAGATING STREAKS ARE CLEARLY VISIBLE... 22
FIG. 2.7: HOVMÖLLER DIAGRAMS (LONGITUDE-‐TIME) FOR: A) SURFACE LATENT HEAT FLUX [W M-‐2] AND B) WIND SHEAR [M S-‐1] BETWEEN 600 HPA AND 925 HPA FOR AUGUST 2007. DATA ARE AVERAGED BETWEEN 0° AND 20°N. ... 23
FIG. 2.8: EXTENDED EMPIRICAL ORTHOGONAL FUNCTION (EEOF) ANALYSIS IS APPLIED TO PENTAD 200-‐HPA VELOCITY POTENTIAL (CHI200) ANOMALIES EQUATORWARD OF 30°N DURING ENSO-‐NEUTRAL AND WEAK ENSO WINTERS (NOVEMBER-‐APRIL) IN 1979-‐2000. ANOMALIES ARE BASED ON THE 1979-‐1995 PERIOD, AND EACH INDEX IS NORMALIZED BY ITS STANDARD DEVIATION DURING ENSO-‐NEUTRAL AND WEAK ENSO WINTERS (NOVEMBER-‐APRIL) IN 1979-‐2000.. 24
FIG. 2.9: HOVMÖLLER DIAGRAMS (LONGITUDE-‐TIME) OF INSTANTANEOUS RAINFALL ESTIMATES WITH A THRESHOLD HIGHER THAN 1 MM H-‐1 FOR: A) JUNE 2005, B) JULY 2005, AND C) AUGUST 2005. THE WHITE HORIZONTAL STRIPS ARE DUE TO MISSING DATA. ... 25
FIG. 2.10: SAME AS IN FIG. 2.9, BUT FOR AUGUST 2007 WITH A RAIN RATE THRESHOLD VALUE HIGHER THAN A) 1 MM H-‐1, B) 5 MM H-‐1... 26
FIG. 2.11: MEAN DIURNAL CYCLE OF PIXELS WITH AN INSTANTANEOUS RAINFALL RATE > 1 MM H-‐1 IN THE HOVMÖLLER (LONGITUDE-‐TIME) SPACE FOR JUNE, JULY AND AUGUST 2004-‐2008. THE DIAGRAMS ARE REPEATED TWICE ON TOP OF EACH OTHER FOR MORE CLARITY... 27
FIG. 2.12: SAME AS IN FIG. 2.11, BUT FOR JUNE, JULY, AND AUGUST 2005. ... 28
FIG. 2.13: POWER SPECTRUM OF THE MEAN DIURNAL CYCLE OF THE INSTANTANEOUS RAINFALL RATE GREATER THAN 1 MM H-‐1 IN THE HOVMӦLLER SPACE (FIG. 2.11) FOR: JUNE (TOP), JULY (MIDDLE), AND AUGUST (BOTTOM) 2004-‐2008, PLOTTED AS A FUNCTION OF FREQUENCY (H-‐1) AND LONGITUDE (DEGREE)... 31
FIG. 2.14: GEAGRAPHICAL AREAS IDENTIFIED FROM THE POWER SPECTRUM DISTRIBUTION WHERE MAXIMA ARE LOCATED... 32
FIG. 2.15: HARMONIC DECOMPOSITION (WAVE NUMBERS 0-‐2) OF MEAN DIURNAL CYCLE OF INSTANTANEOUS RAINFALL INTENSITIES GREATER THAN 1 MM H-‐1 IN HOVMӦLLER SPACE IN FIG. 10, FOR THE FOUR LONGITUDINAL BANDS 5° WIDTH: A) 16°W-‐ 11°W; B) 5°E-‐10°E; C) 19°E-‐24°E; D) 33°E-‐38°E, FOR JUNE 2004-‐2008. DOTTED, GREY DASHED, LONG DASHED AND THICK SOLID LINES REPRESENT WAVE NUMBERS 0, 1, 2 AND THEIR SUMMATION, RESPECTIVELY, WHILE STARS DEPICT ORIGINAL DATA BEFORE DECOMPOSITION. ... 33
FIG. 2.16: SAME AS IN FIG. 2.15, BUT FOR JULY 2004-‐2008... 34
FIG. 2.17: SAME AS IN FIG. 2.15, BUT FOR JULY 2004-‐2008... 35
FIG. 2.18: HARMONIC DECOMPOSITION (WAVE NUMBERS 0-‐2) OF MEAN DIURNAL CYCLE OF INSTANTANEOUS RAINFALL INTENSITIES GREATER THAN 1 MM H-‐1 IN HOVMӦLLER SPACE, FOR THE LONGITUDINAL BAND 5° WIDTH 16°W-‐11°W, FOR JUNE 2004-‐ 2008 (LEFT). DOTTED, GREY DASHED, LONG DASHED AND THICK SOLID RED LINES REPRESENT WAVE NUMBERS 0, 1, 2 AND THEIR SUMMATION, RESPECTIVELY, WHILE STARS DEPICT ORIGINAL DATA. GREEN, BLUE AND RED THICK SOLID LINES REPRESENT WAVE NUMBERS 0, 1, 2, 3 SUMMATION, RESPECTIVELY (RIGHT). ... 36
FIG. 2.19: SAME AS IN FIG. 2.18, BUT FOR 5°E-‐10°E BAND. ... 36
FIG. 2.20: SAME AS IN FIG. 2.18, BUT FOR 19°E-‐24°E BAND... 37
FIG. 2.21: SAME AS IN FIG. 2.18, BUT FOR 33°E-‐38°E BAND... 37
FIG. 3.1: OVERALL RAMS SIMULATION SCHEME ADOPTED FOR THE REGIONAL REANALYSIS APPROACH. THE REGIONAL MODEL RAMS IS FORCED BY ATMOSPHERIC AND SEA SURFACE TEMPERATURE BOTH AT THE INITIAL TIME AND DURING THE SIMULATION PERIOD... 44
FIG. 3.2: RAMS MODEL TOPOGRAPHY: THE LOW-‐RES CONFIGURATION (UPPER PANEL) AND HIGH-‐RES CONFIGURATION (LOWER PANEL)... 46
FIG. 3.3: EXAMPLE OF SST FIELDS FORCING THE RAMS MODEL: A) HADSST AT 15TH JUNE 2005, B) MODSST AT 15TH JUNE 2005,
C) HADSST AT 15TH JULY 2005, B) MODSST AT 15TH JULY 2005. DIFFERENT SPATIAL RESOLUTION APPEARS CLEARLY
THROUGH DIFFERENT SST SMOOTHNESS PATTERNS... 47
FIG. 3.4: PRECIPITATION DIURNAL CYCLE (AS IN MELANI ET AL., 2010) COMPUTED WITH SATELLITE MSG RAINFALL ESTIMATES. 48 FIG. 3.5: PRECIPITATION DIURNAL CYCLE COMPUTED USING RAMS LOWRES VERTICAL VELOCITY FIELD AT 300HPA AS FOOTPRINT OF DEEP CONVECTION; HADSST FORCING (LEFT) AND MODISSST FORCING (RIGHT)... 48
FIG. 3.6: COMPARISON AMONG RAMS HORIZONTAL RESOLUTION AND SST FORCINGS FOR JJA – 2005: A) TOTAL CUMULATED PRECIPITATION FOR THE L-‐RAMS FORCED BY HADSST, B) L-‐RAMS FORCED BY MODSST, C) DIFFERENCE BETWEEN HADSST – MODSST CUMULATED PRECIPITATION FOR THE L-‐RAMS SET UP. D) TOTAL CUMULATED PRECIPITATION FOR THE H-‐RAMS FORCED BY HADSST, E) H-‐RAMS FORCED BY MODSST, F) DIFFERENCE BETWEEN HADSST – MODSST CUMULATED PRECIPITATION FOR THE H-‐RAMS SET UP. ... 50
FIG. 3.7: CONTINGENCY TABLE REPRESENTATION OF "HITS" AND "MISS" OCCURRENCE... 51
FIG. 3.8: A EXAMPLE OF PROBABILITY OF DETECTION MAPS FOR THE JJA – 2005. BY COLUMN DIFFERENT SEA SURFACE FORCINGS: MODSST AND HADSST AND DIFFERENT RAMS CONFIGURATIONS: L-‐RAMS, AT 50KM OF HORIZONTAL RESOLUTION, AND H-‐ RAMS, AT 30KM OF HORIZONTAL RESOLUTION. BY ROWS DIFFERENT MONTHS OF THE JJA-‐ 2005 SEASON: JUNE, JULY AND AUGUST. ... 53
FIG. 3.9: A EXAMPLE OF FALSE ALARM RATE MAPS FOR THE JJA – 2005. BY COLUMN DIFFERENT SEA SURFACE FORCINGS: MODSST AND HADSST AND DIFFERENT RAMS CONFIGURATIONS: L-‐RAMS, AT 50KM OF HORIZONTAL RESOLUTION, AND H-‐RAMS, AT 30 KM OF HORIZONTAL RESOLUTION. BY ROWS DIFFERENT MONTHS OF THE JJA-‐ 2005 SEASON: JUNE, JULY AND AUGUST. ... 54
FIG. 3.10: FIRST 3 EOFS FOR TRMM PRECIPITATION DIURNAL CYCLE FOR JJA, 2004-‐2008 PERIOD. ... 55
FIG. 3.11: FIRST 3 EOFS FOR MSG RAIN RATE ESTIMATES DIURNAL CYCLE FOR JJA, 2004-‐2008 PERIOD. ... 55
FIG. 3.12: FIRST 3 EOFS FOR MERRA PRECIPITATION DIURNAL CYCLE FOR JJA, 2004-‐2008 PERIOD. ... 55
FIG. 3.13: FIRST 3 EOFS FOR L-‐RAMS (MODSST) PRECIPITATION DIURNAL CYCLE FOR JJA, 2004-‐2008 PERIOD. ... 56
FIG. 3.14: FIRST 3 EOFS FOR H-‐RAMS (MODSST) PRECIPITATION DIURNAL CYCLE FOR JJA, 2004-‐2008 PERIOD. ... 56
FIG. 3.15: FIRST EOFS FOR H-‐RAMS PRECIPITATION: MODSST (LEFT) AND HADSST (RIGHT)... 56
FIG. 3.16: SECOND EOFS FOR H-‐RAMS PRECIPITATION: MODSST (LEFT) AND HADSST (RIGHT). ... 56
FIG. 3.17: THIRD EOFS FOR H-‐RAMS PRECIPITATION: MODSST (LEFT) AND HADSST (RIGHT). ... 57
FIG. 3.18: FIRST PCA LOADING TIME SERIES FOR RAMS PRECIPITATION (MODSST-‐L-‐RAMS IN RED, MODSST-‐H-‐RAMS IN LIGHT BLUE, HADSST-‐H-‐RAMS IN VIOLET), MERRA PRECIPITATION (BLUE), RAINFALL FROM TRMM (GREEN) AND MSG-‐ RAINFALL RATE (LIGHT BROWN). ... 57
FIG. 3.19: SECOND PCA LOADING TIME SERIES FOR RAMS PRECIPITATION (MODSST-‐L-‐RAMS IN RED, MODSST-‐H-‐RAMS IN LIGHT BLUE, HADSST-‐H-‐RAMS IN VIOLET), MERRA PRECIPITATION (BLUE), RAINFALL FROM TRMM (GREEN) AND MSG-‐ RAINFALL RATE (LIGHT BROWN). ... 58
FIG. 3.20: THIRD PCA LOADING TIME SERIES FOR RAMS PRECIPITATION (MODSST-‐L-‐RAMS IN RED, MODSST-‐H-‐RAMS IN LIGHT BLUE, HADSST-‐H-‐RAMS IN VIOLET), MERRA PRECIPITATION (BLUE), RAINFALL FROM TRMM (GREEN) AND MSG-‐ RAINFALL RATE (LIGHT BROWN). ... 58
FIG. 4.1: PHASE DIFFERENCE VARIANCE FROM MERRA DATASET JJA 2004 – 2008 PERIOD: A) PRECIPITATION RATE AND LATENT HEAT FLUX; B) PRECIPITATION RATE AND VERTICAL INTEGRATED MOISTURE TRANSPORT ZONAL COMPONENT (VIMTX); C) PRECIPITATION RATE AND VERTICAL INTEGRATED MOISTURE TRANSPORT MERIDIONAL COMPONENT (VIMTY)... 69
FIG. 4.2: PHASE DIFFERENCE VARIANCE FROM MERRA DATASET JJA 2004 – 2008 PERIOD: A) LATENT HEAT FLUX AND VERTICAL INTEGRATED MOISTURE TRANSPORT ZONAL COMPONENT (VIMTX); B) LATENT HEAT FLUX AND VERTICAL INTEGRATED MOISTURE TRANSPORT MERIDIONAL COMPONENT (VIMTY)... 69
FIG. 4.3: PHASE DIFFERENCE VARIANCE FROM H-‐RAMS (MODSST) DATASET JJA 2004 – 2008 PERIOD: A) PRECIPITATION RATE AND LATENT HEAT FLUX; B) PRECIPITATION RATE AND SENSIBLE HEAT FLUX; C) PRECIPITATION RATE AND VERTICAL INTEGRATED MOISTURE TRANSPORT ZONAL COMPONENT (VIMTX); D) PRECIPITATION RATE AND VERTICAL INTEGRATED MOISTURE TRANSPORT MERIDIONAL COMPONENT (VIMTY)... 70
FIG. 4.4: PHASE DIFFERENCE VARIANCE FROM H-‐RAMS (MODSST) DATASET JJA 2004 – 2008 PERIOD: A) LATENT HEAT FLUX AND VERTICAL INTEGRATED MOISTURE TRANSPORT ZONAL COMPONENT (VIMTX); B) LATENT HEAT FLUX AND VERTICAL INTEGRATED MOISTURE TRANSPORT MERIDIONAL COMPONENT (VIMTY)... 70
FIG. 4.5: AMPLITUDE CORRELATION FROM MERRA DATASET JJA 2004 – 2008 PERIOD: A) PRECIPITATION RATE AND LATENT HEAT FLUX; B) PRECIPITATION RATE AND VERTICAL INTEGRATED MOISTURE TRANSPORT ZONAL COMPONENT (VIMTX); C) PRECIPITATION RATE AND VERTICAL INTEGRATED MOISTURE TRANSPORT MERIDIONAL COMPONENT (VIMTY)... 71
FIG. 4.6: AMPLITUDE CORRELATION FROM MERRA DATASET JJA 2004 – 2008 PERIOD: A) LATENT HEAT FLUX AND VERTICAL INTEGRATED MOISTURE TRANSPORT ZONAL COMPONENT (VIMTX); B) LATENT HEAT FLUX AND VERTICAL INTEGRATED MOISTURE TRANSPORT MERIDIONAL COMPONENT (VIMTY)... 72
FIG. 4.7: AMPLITUDE CORRELATION FROM H-‐RAMS (MODSST) DATASET JJA 2004 – 2008 PERIOD: A) PRECIPITATION RATE AND LATENT HEAT FLUX; B) PRECIPITATION RATE AND SENSIBLE HEAT FLUX; C) PRECIPITATION RATE AND VERTICAL INTEGRATED MOISTURE TRANSPORT ZONAL COMPONENT (VIMTX); D) PRECIPITATION RATE AND VERTICAL INTEGRATED MOISTURE TRANSPORT MERIDIONAL COMPONENT (VIMTY)... 73
FIG. 4.8: AMPLITUDE CORRELATION FROM H-‐RAMS (MODSST) DATASET JJA 2004 – 2008 PERIOD: A) LATENT HEAT FLUX AND VERTICAL INTEGRATED MOISTURE TRANSPORT ZONAL COMPONENT (VIMTX); B) LATENT HEAT FLUX AND VERTICAL
INTEGRATED MOISTURE TRANSPORT MERIDIONAL COMPONENT (VIMTY)... 73 FIG. 4.9: MEAN PSI FROM MERRA DATASET JJA 2004 – 2008 PERIOD: A) PRECIPITATION RATE AND LATENT HEAT FLUX; B)
PRECIPITATION RATE AND VERTICAL INTEGRATED MOISTURE TRANSPORT ZONAL COMPONENT (VIMTX); C) PRECIPITATION RATE AND VERTICAL INTEGRATED MOISTURE TRANSPORT MERIDIONAL COMPONENT (VIMTY)... 75 FIG. 4.10: MEAN PSI FROM MERRA DATASET JJA 2004 – 2008 PERIOD: A) LATENT HEAT FLUX AND VERTICAL INTEGRATED
MOISTURE TRANSPORT ZONAL COMPONENT (VIMTX); B) LATENT HEAT FLUX AND VERTICAL INTEGRATED MOISTURE
TRANSPORT MERIDIONAL COMPONENT (VIMTY)... 76 FIG. 4.11: MEAN PSI FROM H-‐RAMS (MODSST) DATASET JJA 2004 – 2008 PERIOD: A) PRECIPITATION RATE AND LATENT HEAT
FLUX; B) PRECIPITATION RATE AND VERTICAL INTEGRATED MOISTURE TRANSPORT ZONAL COMPONENT (VIMTX); C)
PRECIPITATION RATE AND VERTICAL INTEGRATED MOISTURE TRANSPORT MERIDIONAL COMPONENT (VIMTY)... 76 FIG. 4.12: MEAN PSI FROM H-‐RAMS (MODSST) DATASET JJA 2004 – 2008 PERIOD: A) LATENT HEAT FLUX AND VERTICAL
INTEGRATED MOISTURE TRANSPORT ZONAL COMPONENT (VIMTX); B) LATENT HEAT FLUX AND VERTICAL INTEGRATED MOISTURE TRANSPORT MERIDIONAL COMPONENT (VIMTY)... 78 FIG. 4.13: POTENTIAL TEMPERATURE, AT 850HPA, MEAN FIELD FROM MERRA (A) AND H -‐ RAMS SIMULATIONS: JJA 2004 -‐
2008 ... 79 FIG. 4.14: SYNCHRONIZATION FOOTPRINT FOR MERRA DATASET IN JJA2004 – 2008 PERIOD FOR WAHL INDEX AND LAND
LATENT HEAT FLUX: A) MEAN PSI VALUES, B) PHASE DIFFERENCE VARIANCE, C) AMPLITUDE CORRELATION... 81 FIG. 4.15: SYNCHRONIZATION FOOTPRINT FOR MERRA DATASET IN JJA2004 – 2008 PERIOD FOR WAHL INDEX AND RAINFALL:
A) MEAN PSI VALUES, B) PHASE DIFFERENCE VARIANCE... 82 FIG. 4.16: MEAN PSI FROM H-‐RAMS (MODSST) FIELDS VALUES (JJA 2004 – 2008 PERIOD), COMPUTED AGAINST THE WAHL
Table of Contents
ABSTRACT...3
ACKNOWLEDGMENTS ...4
ABOUT THE AUTHOR ...5
INDEX OF FIGURES ...6
TABLE OF CONTENTS ...9
1 INTRODUCTION ... 10
1.1 WEST AFRICA MONSOON: A PHYSICAL BACKGROUND...10
1.2 OUTLINE OF THE THESIS... 14
2 DATASETS AND METHODS... 15
2.1 SATELLITE RAINFALL ESTIMATES DATA...15
2.1.1 Analysis of Hovmӧller diagrams...17
2.1.2 Large scale atmospheric analysis...20
2.1.3 Analysis of coherent rainfall episodes...24
2.1.4 Rainfall estimate diurnal signal ...26
2.1.5 Harmonic decomposition ...30
2.2 SUMMARY OF REMOTE SENSED RAINFALL DATA... 38
2.3 VERTICAL INTEGRATED MOISTURE TRANSPORT -‐ VIMT...38
2.4 MODERN ERA RETROSPECTIVE-‐ANALYSIS FOR RESEARCH AND APPLICATION -‐ MERRA REANALYSIS... 40
3 REGIONAL MODELLING ... 42
3.1 REGIONAL REANALYSIS CONFIGURATION...42
3.2 MODEL EVALUATION ON THE PRECIPITATION DIURNAL CYCLE... 47
3.3 MODEL EVALUATION ON THE SEASONAL TIME SCALE...50
3.4 HIGH FREQUENCY VARIABILITY... 54
3.5 CONCLUDING REMARKS... 61
4 SYNCHRONIZATION... 62
4.1 INTRODUCTION... 62
4.2 DEFINITION OF THE PHYSICAL SYSTEM...66
4.3 EVIDENCE OF A SYNCHRONIZATION FOOTPRINT... 67
4.3.1 Phase difference dispersion analysis ...68
4.3.2 Phase difference correlation analysis ...71
4.3.3 Mean Phase Synchronization Index analysis ...74
4.4 LONG DISTANCE INTERACTION SYNCHRONIZATION BETWEEN WAHL AND WAM... 78
4.4.1 The West African Heat Low pressure system - WAHL ...78
4.4.2 Interaction between WAM and WAHL measure by synchronization...80
5 CONCLUDING REMARKS... 85
1
INTRODUCTION
1.1
West Africa Monsoon: a physical background
The summer African monsoon is one of the major climatic large-scale phenomena that is thought to impact on atmospheric dynamics at great distances. To date the monsoon complex phenomenology is far from being fully understood in its driving multiple mechanisms, and consequently its spatial and temporal precipitation distribution remains a key research topic. Many general circulation models (GCM) have been tuned for reproducing the African monsoon dynamics but their capability to correctly represent deep convection is still very limited. The synergic use of satellite observations and limited area models (LAM), based on the analysis of systematic satellite rainfall estimates at a very high spatial resolution and regional scale simulations, has a potential for the reconstruction of the monsoon fine dynamics.
The African climate has been recognised as one of the “hot spots” in the Earth climate system (Solomon et al., 2007; Kirtman and Pirani, 2008). A reliable and detailed space/time representation of the rainfall distribution covering a wide range of dynamic scales in Northern Tropical Africa during the monsoon season is thus of primary importance. The main reason is that a better appraisal of the overall mechanisms could notably increase our level of understanding of the physics of the climate system not only in the area, but also at the global scale. In addition an improved capability of modelling and thus predicting the physical behaviour of the system could help managing operational issues, such as the agricultural activities in areas in which the productivity necessarily impacts large segments of the population.
Reproducing the rainfall dynamics through numerical models involves specific challenges in conceiving the right parameterization that are necessary to described the complex precipitation mechanisms, with their load of numerical and physical approximations. In particular, in Africa the diurnal forcing effects have a strong impact on the boundary layer determining its transition between stable and unstable conditions favourable for the onset of convection (Wang et al., 1994; Leroux, 2001; Parker et al., 2005b; Kikuchi and Wang, 2008; Taylor et al. 2011a; Taylor et al., 2011b).
Precipitating systems over Africa have been extensively studied from a variety of points of view over the past two decades. They are mostly associated to large scale convective events such as
Mathon et al., 2002; Jackson et al., 2009), squall lines (Rowell and Milford, 1993), and deep convective systems in general (e.g., Futyan and Del Genio, 2007). The West African Monsoon (WAM) dynamics (Sultan and Janicot, 2003a,b) and the role of synoptic wave perturbations on convective systems (Nguyen and Duvel, 2008) have also been explored though leaving considerable ground for further investigations. These systems result from a strong interaction between the large scale flow and the small scale dynamics, and are thus difficult to be correctly represented by numerical models.
The intraseasonal time – scale monsoon variability during the boreal summer is a result of many different superimposed physical mechanisms, both atmospheric and oceanic. They are characterized by modulating conditions from daily up to 60 days period for developing and maintaining organized convective systems over Africa. The faster rainfall modulation is associated with the synoptic variability of the African Easterly Wave (AEW) (Thorncroft and Hoskins, 1994a,b; Pytharoulis and Thorncroft, 1999; Thorncroft and Hodges, 2001; Mohr and Thorncroft, 2006). These atmospheric transients are characterized by low–mid level wind shear maxima and high convective available potential energy (CAPE) in the vicinity of elevated terrain producing a high probability of generating intense and propagating convective systems in the area (Mohr and Thorncroft, 2006). For this reason AEWs are identified as one of the main factors in modulating the rainfall space– time distribution at regional scale, both of weak and intense convective systems at the daily time scale. Recently, this association between AEWs and rainfall maxima location and occurrence has been revised by Kiladis et al. (2006) and Hall et al. (2006) who have argued that AEWs are better described as a response to coherent and organized convection, revealing that this relationship is far to be purely atmospheric. A second identified high frequency convective modulating mechanism is the soil moisture pattern as noted by Parker et al. (2005b). The soil moisture pattern plays a strong role in sustaining daytime favourable conditions in the convective boundary layer (CBL) to maintain the convection diurnal cycle and in modulating the low level moisture horizontal advection.
Longer time scale rainfall variability was studied by several authors. Seo et al. (2008) have modelled precipitation from AEWs finding that heavy rainfall events, occurring on the 2–6-day time scales associated with the easterly waves, account for a significant fraction (> 60% – 70%) of the simulated variance of precipitation, which implies a considerable alteration of the larger-scale annual mean rainfall due to these heavy rainfall events. Janicot and Sultan (2001) have pointed out large and coherent fluctuations in the rainfall and wind fields at intra-seasonal time scale over West Africa. These enhanced (weakened) phases of the WAM last in average 9 days and are included in a dominant quasi-periodic signal of about 15 days.
A 25 – 90 days modulation, primarily forced by Rossby cyclonic circulation moving westward off the Indian ocean was found by Janicot et al. (2009) and produced by the Madden Julian Oscillation (MJO) anomaly as identified by Lavender and Matthews (2009).
At monthly to seasonal time scale the atmospheric dynamic characterisation of the African Monsoon can be analysed with the African Easterly Jet (AEJ), which is the primarily jet flow developed in response to the inverse latitudinal surface temperature gradient during boreal spring in the sub – Sahelian region (Cook, 1999; Hsieh and Cook, 2005; Parker et al., 2005a; Leroux and Hall, 2009; Wu et al., 2009).
West African Monsoon variability is strongly forced by the sea surface temperatures standardised anomaly (SSTAs) of the Gulf of Guinea. Warm Gulf of Guinea SSTAs generates a rainfall increases along the Guinean coast while the precipitation decreases over the Congo Basin. These features can be understood through the dynamical response of a Kelvin wave along the equator and a Rossby wave to the west of the SSTA. The first is associated with a weakening of the Walker circulation, while the latter tends to strength the West African Monsoon and the upward vertical velocity. The effects of Cold SSTAs are opposite, but weaker (Vizy and Cook, 2001). The monsoon circulation influences the precipitation over the Sahel, in particular southern Sahel (10N-15N), in two main ways. The moisture is transported by the low-level southerly flow. The proximity of the monsoon circulation and circulation over Sahara generates a strong low-level convergence to force air parcels to rise vertically until the level of free convection (Vizy and Cook, 2002). Positive SST anomalies in the Eastern Pacific and in the Indian Ocean, negative in the northern Atlantic and in the Gulf of Guinea are related with droughts conditions over all the West Africa (Fontaine and Janicot, 1996; Eltahir and Gong, 1996).
Droughts limited to Sahel are due to a positive SST anomaly northward in the southern Atlantic and a negative pattern in the northern Atlantic. Floods along the West Africa are associated with positive anomalies in the northern Atlantic, while the floods limited to Sahel are related to different forcing: northward expansion of negative SST anomalies in the southern Atlantic, positive SST departures in the northern Atlantic, and development of negative SST anomalies in the eastern Pacific (Fontaine and Janicot, 1996).
The Principal Components Analysis (PCA) performed on the summer precipitation in the Sahel region, demonstrates that the two leading principal components (PCs) explain almost the half of the variability of the precipitation. Moreover two main patterns are present: the first along the Gulf of Guinea coast, between the equator and 10°N, dominated the interannual variability, the second associated with the continental convergence in the Sahel (between 10°N and 20°N) affected by the interdecadal variability. The decomposition of these two leading PCs into high and low-frequency
components shows the role of the SST of the Southern Atlantic and Indian Ocean for driving the long-term variability, while the interannual variations are driven by the ENSO (Giannini et al. 2003).
The presented analysis is an extended version of Melani et al., (2010) study which started from the findings of Melani et al. (2008) presenting a more detailed analysis of precipitation and of the associated atmospheric dynamics. Satellite rainfall fields are used to investigate the dynamic mechanisms driving the precipitation episodes, their distribution and propagation characteristics for the WAM and more generally for the northern African monsoon, during the core of the rainy season. A five-year climatology (2004 - 2008) of satellite precipitation estimations is presented, as derived from a multi-sensor approach involving geostationary (Meteosat Second Generation, MSG) and polar orbiting (Special Sensor Microwave Imager, SSM/I, onboard the Defense Meteorological Satellite Program, DMSP, spacecrafts) satellite observations. The precipitation fields show precise features and zonal propagation properties as well as the nature of the diurnal cycle by means of statistical analyses of the seasonal Hovmöller diagrams. Even if satellite rainfall estimations are generally affected by large uncertainties (see Chapter 2), the information contained in the precipitation fields in terms of spatial and temporal distribution of the precipitating systems leads to results that are somewhat different with respect to those stemming from similar analyses based on thermal infrared brightness temperature (TB) data (Laing et al., 2008). Recent studies over Northern Tropical African continent (Laing et al., 2004; 2008) and East Asia (Wang et al., 2004, 2005), based on satellite-measured cloud top TBs using thermal infrared imagery, investigated the dynamical monsoonal characteristics through deep cloud system formation. Over the Northern African area there are no radar nor rain gauge networks providing reliable measurements to explore the warm season rainfall variability. Satellite estimations, with their good spatio-temporal sampling, are thus the only viable source of data for characterizing these precipitation phenomena presenting a “phase-locked” behaviour.
Note that other studies were conducted over the area using data from the Tropical Rainfall Measuring Mission (TRMM) Precipitation Radar (PR) such as those by Geerts and Dejene (2005) on the regional and diurnal variability of the vertical structure of precipitation systems, and those by Sealy et al. (2003) on the comparison of the products from various satellite precipitation datasets over West Africa. TRMM data were used also by Schumacher and Houze (2006) to study the stratiform component of precipitation over sub-Saharan Africa and tropical East Atlantic.
Such studies require the appropriate knowledge of the vertical structure, but TRMM data do not ensure the necessary space-time repetition to address problems such as that examined in the present
paper. Precipitation estimations from passive sensors using the geostationary orbits as the necessary backbone maintain a high value for these studies as already pointed out by Levizzani et al. (2001).
1.2 Outline of the Thesis
In order to highlight the presence of an internal dynamical coherence of WAM a series of three data analysis and interpretation phases have been provided: 1) a rainfall distribution analysis by means of satellite remote sensed data; 2) a reanalysis strategy, developed for this study and base on a regional numerical model; 3) a synchronization data analysis of modelled simulation datasets available.
A detailed description of remote sensed satellite data used for describing the rainfall diurnal cycle in West Africa Monsoon area is shown in Chapter 2. Phase locking footprint is analyzed and related to large scale atmospheric forcing acting on that region along with a coherent rainfall episodes study, an estimation of rainfall diurnal cycle and an harmonic analysis. Other modelling datasets used within this work, but not computed directly, are described as well.
A full description of the complex reanalysis strategy, base on a regional modelling system and originally developed for this study, is described in Chapter 3. An evaluation procedure for regional model reliability has been proposed as well. In particular, in order to measure capability to numerically represent rainfall diurnal cycle model and observed rainfall data were analyzed and studied.
Synchronization analysis and its interpretation are then provided in Chapter 4. A brief overview of sync theory is shown at the beginning in order to provide a specific introduction of conceptual framework along with results and discussion.
The final Chapter 5 is a summary of principal results presented in the thesis with conclusion remarks and some perspectives for a future development of this study.
2 Datasets and Methods
2.1
Satellite rainfall estimates data
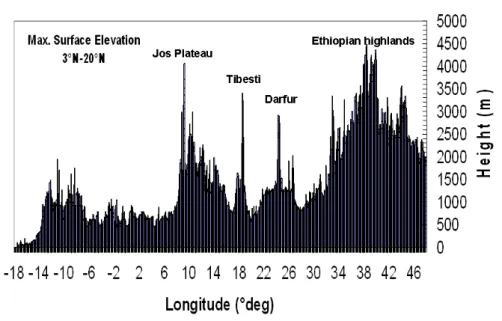
The study domain is centred over Central Africa and extends from 3° to 20°N and 18° to 48°E. The area and the orography of the region are shown in Fig. 2.1. The western boundary of the area is chosen on the basis of the prevailing south-easterly low-level flow insisting on the gulf of Guinea, which is an intense source of heat and humidity, while to the east the limit is dictated by the fact that the Arabic peninsula acts as additional trigger for convective activity. The northern boundary is fixed in order to exclude the Atlantic fronts, thus mainly focusing on the atmospheric features only induced by the African monsoon itself. Cross sections of the maximum surface elevation within each latitude band are shown in Fig. 2.2. Complex orography spans the whole area west to east with a maximum elevation of ~ 5 km in correspondence of the Ethiopian Highlands (east of 34°E) and an average terrain height below 2 km.
Fig. 2.1: Computational domain for rainfall estimates Hovmöller diagrams, also showing main topographic features.
Fig. 2.2: Maximum surface elevation (m) inside the domain along each zonal strip (0.04°) between 18°W and 48°E.
The study period, hereinafter defined as the “warm season”, is June-August over five-years (2004-2008). Precipitation patterns are used as a proxy for inferring the principal dynamic characteristics of the African monsoon.
The rainfall estimates consist of instantaneous rainfall maps produced every 15 minutes at the LAMMA Consortium (Laboratory of Monitoring and Environmental Modelling for the sustainable development, http://www.lamma.rete.toscana.it) with a spatial resolution of 3 × 3 km2 at nadir; no off-line procedure was implemented for backward integration of the passive microwave (PMW) data. The precipitation estimations are derived from an infrared (IR) and PMW “blended” technique (Turk et al., 2000a,b) that dynamically correlates IR TBs as measured by geostationary sensors and instantaneous rain rates as computed from PMW radiometer data (NOAA-NESDIS algorithm; Ferraro and Marks, 1995; Ferraro, 1997). The procedure merges the high refresh time and space resolution of the data of the Spinning Enhanced Visible and InfraRed Imager (SEVIRI) (Schmetz et al., 2002) on board the MSG geostationary satellite, with the sensitivity to the microphysics of precipitating clouds of the SSM/I PMW instrument on board the DMSP polar orbiting spacecrafts (Hollinger et al., 1990).
The LAMMA laboratory is equipped with a receiving station that acquires MSG real time High Rate Information Transmission (HRIT) data every 15 minutes. Data are supplied already rectified in digital format and contain also geolocation and calibration parameters. PMW data are downloaded via ftp connection from the CLASS (Comprehensive Large Array-data Stewardship System) archive (http://www.class.noaa.gov); data are available about 1 hour after the satellite acquisition and are supplied in Sensor Data Record (SDR) format. A calibration procedure is
applied to transform sensor counts in TB, as required by the input procedure of the precipitation estimation algorithm.
Note that satellite rainfall estimations need to be associated with an estimation of the quality of the retrieval. However, not much work has been devoted to date to this crucial task and only recently validation campaigns were started to explore the error characteristics of the available products. In particular, the International Precipitation Working Group (IPWG, http://www.isac.cnr.it/~ipwg/) has launched a program for in situ continental-scale validation of daily rainfall estimates from the operational satellite algorithms providing near-real-time global rainfall products against rain gauges and radars where high-quality networks exist, such as in the United States, Western Europe, Australia, Japan, South America (Ebert et al., 2007). Among others, fundamental work on the evaluation of operational products was conducted by McCollum et al. (2002) over the continental United States and Hossain and Huffman (2008) on the error metrics at relevant hydrological scales. Sapiano and Arkin (2009) have recently evaluated and intercompared datasets at a variety of spatial and temporal resolutions within the IPWG Program to Evaluate High Resolution Precipitation Products (PEHRPP) with the intent of guiding dataset developers and informing the user community regarding the error characteristics of the products. Finally, Turk et al. (2009) have examined over-land validation statistics for the algorithm used in the present study using a high-resolution, nearly-homogeneous, 1-min reporting gauge dataset over Korea across telescoping space and time scales.
The assessment of the uncertainty associated with the estimation in Africa poses additional difficulties due to the data sparsity and quality. Lebel and Amani (1999) propose a procedure for the Sahelian area whose products are charts giving the standard estimation error as a function of the network density, the area, and the rainfall depth in the region. An extension is proposed for larger timescales (decade, month, and season).
2.1.1 Analysis of Hovmӧller diagrams
Propagation characteristics of rainfall systems are determined using a methodology similar to that of Carbone et al. (2002), Wang et al. (2004), Laing et al. (2008), Levizzani et al. (2010), and described in detail by Ahijevych et al. (2001); some modifications (described below) have been introduced on the mechanism for the identification of the convective precipitating episodes.
The instantaneous rainfall maps are projected onto a regular lat/lon grid (~ 0.04° × 0.04°) and constitute the database for generating the Hovmöller diagrams. Only half of the precipitation dataset is used (i.e., a map every 30 minutes) in order to reduce the computational time without critically affecting the information content. The domain of interest (Fig. 2.1), centred on the
prevailing African monsoon flow area (~ 1900 × 7200 km2), is first divided into 1650 zonal narrow strips, each 0.04° wide (~ 4 km), running from 3° to 20° in the N-S direction.
Fig. 2.3: Overall scheme for Hovmöller diagram computation.
Then, for each longitudinal strip, all the convective precipitating sequences are identified along all latitudes and the average values are calculated (Fig. 2.3). A sequence is identified when found at least longer than 15 pixels (~ 60 km) and with a rain rate higher than a given threshold (that will be defined later). Finally, the longitude-time Hovmöller diagrams are produced considering only the highest rain rate sequences.
a) b)
c) d)
Fig. 2.4: As an example streaks events identified by the methodology described above for 4 different months: a) July 2004, b) July 2005, c) August 2004 and d) August 2005.
A quantitative analysis on the longitude-time rainfall streaks is then conducted to quantify their coherence, longevity and span. A two-dimensional (2D) autocorrelation function (see Carbone and Tuttle, 2002), uniform in one direction and cosine weighted in the other, is superimposed to the instantaneous rainfall estimate strips in the Hovmöller space to find their angle, duration and span. The 2D function is stepped through all longitude-time coordinates (0.04°/30 min) and rotated (at 1° angular increments) until the correlation coefficient is maximised (> 0.35). Sequences of contiguous fits in the Hovmöller space define the coherent cloud patterns (rainfall streaks). For computing a span/duration statistics, the cosine weighting dimension of the 2D autocorrelation function is matched to 6 h (12 grid points) rainfall duration at a given longitude, and the rectangular pulse set to 3.2° (80 grid points), i.e. the span/duration characteristics of the African MCSs (Mathon and Laurent, 2001). A deeper analysis on rainfall streaks on variability and characteristics is
presented in Melani et al., 2010, and it is not described here since this study is focused on the precipitation diurnal cycle.
2.1.2 Large scale atmospheric analysis
The analysed 5 year period is characterised by a large variability in terms of monsoon dynamic behaviour and thus rainfall intensity and spatio/temporal distribution over West Africa. The large scale WAM atmospheric dynamics can be summarised through the analysis of the zonal wind characteristics using the identification of its fast and slow variability modes. Fast transients, such as AEWs, can be highlighted through coherent streaks of westward propagating maxima at 600 hPa in a longitude-time Hovmöller diagram by averaging the zonal wind in latitude between 0° – 20°N. These disturbances are present during the whole season with important intraseasonal fluctuation (Sultan and Janicot, 2003; Sultan et. al., 2003). A slow variability at the monthly time scale can be shown through zonal wind latitudinal cross section where AEJ jet stream, along with Tropical Easterly Jet (TEJ) and Subtropical Westerly Jet location and intensity, summarising the main features of the tropical circulation in the area (Chen and Van Loon, 1987; Cook, 1999; Diedhiou et al., 1999; Thorncroft and Blackburn, 1999; Grist and Nicholson, 2001).
The five years study period (2004 – 2008) is analysed using the NCEP/DOE AMIP-II Reanalysis atmospheric dataset (Kanamitsu et al., 2002). In particular, the monthly zonal wind cross sections, averaged between 0° and 10°W, are computed (Fig. 2.5). The month of June 2004 (not shown) presents a very intense AEJ with a core speed > 15 m s-1 instead of the typical values of about 12 m s-1 observed in the following years. This high value is generally associated with a strong latitudinal surface temperature gradient. August 2005 shows a stronger and north – shifted AEJ along with a period of intense westward propagating AEWs (Fig. 2.5.a) over the continent.
a)
b)
Fig. 2.5: Monthly zonal wind (contour) and anomaly (shaded) cross section [m s-1] for August: a) 2005 and b) 2007. The data
are averaged between 0° and 10°W; contouring are every 3 m s-1. Anomaly are computed with respect the 1979-2009
climatology.
During July 2007 (not shown) a strong low level westerly flow is present with wind speed values > 3 m s-1 and reinforcing in August (Fig. 2.6). This flow pattern is associated with the northernmost location of the AEJ among the analysed years. This latter circulation pattern in July – August 2007 determines an intense moist air advection from the Gulf of Guinea feeding convection inland far from the coast in the sub – Sahelian belt. Streaks of zonal wind (see Fig. 2.6) are associated with the westward intensification of AEJ between 20 and 40°E. Among the analysed four boreal summers, summer 2007 was characterised by strong and long lasting streaks in June (not shown), which were drastically reduced and shifted eastward in August (Fig. 2.5).
a)
b)
Fig. 2.6: Hovmöller diagrams (longitude-time) for zonal wind [m s-1] at 600 hPa for August: a) 2005 and b) 2007. Data are
averaged between 0° and 20°N. Intense westward propagating streaks are clearly visible.
A similar behaviour is registered for the wind shear maxima (Fig. 2.7). This suggests a weak AEJ streak with a few synoptic disturbances moving westward, while the surface latent heat longitude - time plot (Fig. 2.7) shows over the continent (between 45°E and 15°W) a synchronous diurnal variability, which plays a fundamental role in sustaining and regenerating convection in propagating systems (Trenberth, 1999; Parker et al., 2005b; Douville et al., 2007).
a)
b)
Fig. 2.7: Hovmöller diagrams (longitude-time) for: a) surface latent heat flux [W m-2] and b) wind shear [m s-1] between 600
hPa and 925 hPa for August 2007. Data are averaged between 0° and 20°N.
The MJO index computed at 20°E (from CPC www.cpc.ncep.noaa.gov, using an Extended Empirical Orthogonal Function analysis applied to pentad velocity potential at 200-hPa, http://www.cpc.ncep.noaa.gov/products/precip/CWlink/daily_mjo_index/details.shtml) reveals a long period of enhanced convection, the blue shading between 20°E and 70°E in June and in the second half both of July and August 2007 (Fig. 2.8).
Fig. 2.8: Extended Empirical Orthogonal Function (EEOF) analysis is applied to pentad 200-hPa velocity potential (CHI200) anomalies equatorward of 30°N during ENSO-neutral and weak ENSO winters (November-April) in 1979-2000. Anomalies are based on the 1979-1995 period, and each index is normalized by its standard deviation during ENSO-neutral and weak ENSO winters (November-April) in 1979-2000.
2.1.3 Analysis of coherent rainfall episodes
The investigation of the inherent coherence of precipitation episodes showing a well-defined phase-locked behaviour is carried out using satellite-based rain rate longitude – time Hovmöller diagrams for the 2004-2008 period of record. This section focuses on the propagation characteristics of the “organized” rainfall episodes and the corresponding statistics of the rainfall streaks.
A few examples of coherent rainfall episodes are presented hereafter with emphasis on a qualitative inspection of intraseasonal and interannual variations of precipitation patterns.
The colour scale of the plates in Fig. 2.6 and Fig. 2.7 represents the latitude-averaged (3 - 20°N) rainfall estimates with a rain rate value higher than a selected threshold. In this domain the well-organized precipitating systems appear as streaks of estimated rainfall rate showing coherent westward propagation characteristics. A number of tests (not shown) were conducted on various rain rate threshold values, to find the most appropriate for capturing the most relevant features. A rain intensity value of 1 and 5 mm h-1 were chosen to reduce spurious signals not due to convective precipitating cells in the first case, and to highlight the core and the strength of the precipitating systems in the second case.
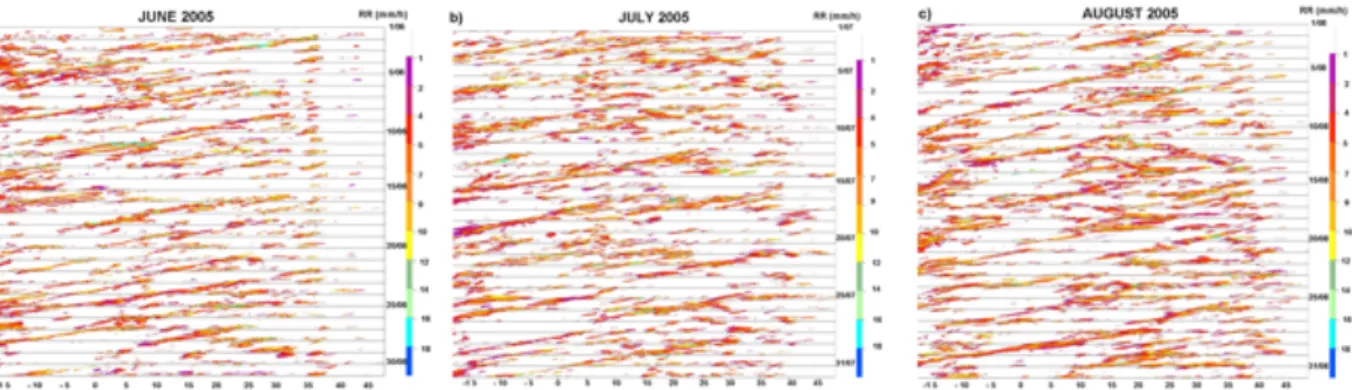
Fig. 2.9: Hovmöller diagrams (longitude-time) of instantaneous rainfall estimates with a threshold higher than 1 mm h-1 for: a) June 2005, b) July 2005, and c) August 2005. The white horizontal strips are due to missing data.
In the first two weeks of June 2005 (Fig. 2.9a) a more widespread distribution of precipitation is noted with respect to the end of the month with a non propagating convection across narrow spans of longitude in the eastern part of domain. Genesis zones are evident in the eastern (west of 30°) and in the western (west of 10°E, 0°, 10°W) parts of the domain, with precipitation episodes that span on the average more than 460 km and last about 10 h. In the last two weeks, a rainfall distribution is detected more representative of the approaching midsummer conditions. The non propagating diurnal convection, in phase with the solar heating, is more pronounced in the eastern part of the domain and spans a larger longitude strip. Convective activity strongly propagates westward and occurs more or less daily while rainfall streaks retain their coherence from the Ethiopian highlands to the Jos Plateu, especially in the second half of June. Several cloud systems span large distances (1000-3000 km) with a propagation speed between 10 and 20 m s-1. Suppression of convection appears in the eastern (3-5; 26-28 June) and in the western (17-19; 27-30 June) part of the domain.
Midsummer conditions are well represented by July 2005 (Fig. 2.9b). The propagating convection occurs daily and frequently originates west of the Ethiopian highlands (west of 35°E). Secondary maxima are also evident influenced by the Darfur mountains (west of 20°E), the Jos Plateau and the Cameroon mountains (west of 10°E), and also from elevated terrain along the western coast of the Sahel (see Fig. 2.2). The non-propagating convection mainly occurs east of 30°E, in phase with the diurnal heating and representing the dominant mode of convection east of the Ethiopian highlands. The development of convection is also linked to the lower levels of the AEJ, which becomes more stable when progressing into the rainy season. The variability of the precipitation patterns is associated with the amount of convection east of 30°E, with the suppression of the precipitating systems in the eastern (e.g., 11-13; 23-25 July) and western (e.g., 11-13; 26-29 July) part of domain. It is also linked to the rate of occurrence of the higher rain intensities west of the Darfur mountains (e.g., 15-30 July).
The first half of August (Fig. 2.9c) presents similarities with July, including the non-propagating convection in the eastern domain, coupled with the diurnal heating. However, while further progressing into the rainy season the westward propagating precipitation structures, although of greater intensity with respect to July, are less coherent and highly intermittent, indicating a regime of more chaotic and less predictable convection as we approach the end of the monsoon season. Moreover, note the suppression of convection west of 0° for the 12-15 August period. The second half of August 2005 exhibits frequent convective events along all the longitudinal domain. However, the coherent rainfall patterns are less organized, with a shorter duration and span with respect to the first part of the month. The suppression of convection in the western and eastern part of the domain becomes more and more evident, approaching the monsoon season end.
Fig. 2.10: Same as in Fig. 2.9, but for August 2007 with a rain rate threshold value higher than a) 1 mm h-1, b) 5 mm h-1.
Fig. 2.10 shows the rainfall streaks for August 2007, this year being chosen for its particular long-lived and strong monsoon characteristics with a rain rate threshold value > 1 mm h-1 (see Fig. 2.10a) and 5 mm h-1 (see Fig. 2.10b). A widespread distribution of rainfall is evident across all the longitudinal domain with a more marked strength of the monsoon in terms of both a higher propagation speed and span of the rainfall streaks, which in the second half of August reach the values of 16.7 m s-1 and 560 km, respectively. When a higher rain rate threshold value (Fig. 2.10b) is used, the cloud structures retain their coherence, especially on the first and last days of August, while in the middle part of the month rainfall events become more intermittent and less coherent. 2.1.4 Rainfall estimate diurnal signal
The mean diurnal cycle of satellite-retrieved rainfall patterns during the warm season (JJA) for the entire period of record (2004-2008) coupled with the zonal displacement of precipitation is
examined to investigate periodicities at time scales of 1 day or less. The number of days during which precipitation intensity was higher than 1 mm h-1 constitutes an event, for each longitude-time coordinate, with a temporal sampling of 30 min and spatial resolution of 0.04°. Fig. 2.11 shows the mean diurnal cycle for the June, July and August averages over the five-years (2004-2008) at a given longitude-time (UTC) coordinate pair. In these diagrams the diurnal cycle is repeated twice for clarity sake.
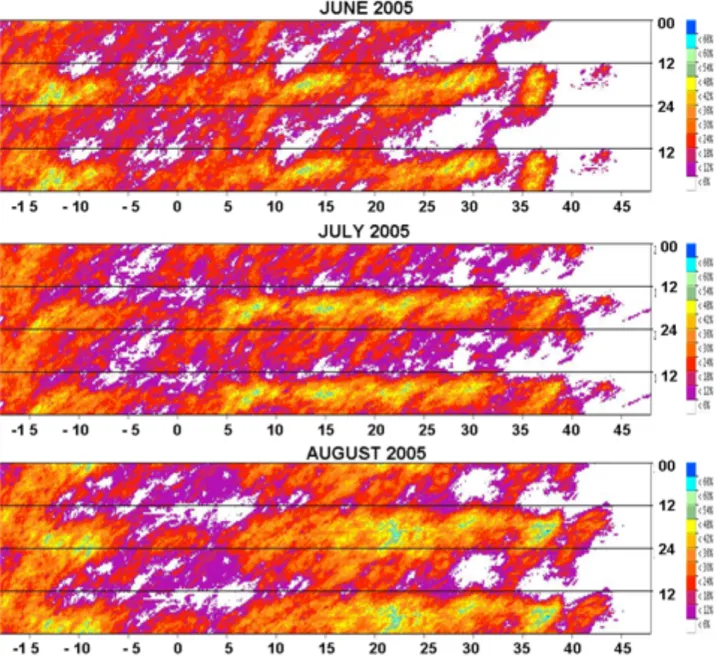
Fig. 2.11: Mean diurnal cycle of pixels with an instantaneous rainfall rate > 1 mm h-1 in the Hovmöller (longitude-time) space for June, July and August 2004-2008. The diagrams are repeated twice on top of each other for more clarity.
Fig. 2.12: Same as in Fig. 2.11, but for June, July, and August 2005.
Over the African continent the interaction between the elevated topography (see Fig. 2.1 and Fig. 2.2) and the strong heating during the day creates the right conditions for the formation of intense convection, as previously evidenced in Fig. 2.6 and Fig. 2.7, forming a highly unstable boundary layer (McGarry and Reed, 1978). Heavy rainfall is more pronounced in the late afternoon and early evening over most of the study domain.
The convection in the eastern part of the domain (west of 30°E) shows a daily oscillation across the continent (maxima near 1300-1600 UTC) and mainly initiates in the lee of steep topography (maxima in correspondence of the Ethiopian highlands), consistently with the thermal heating in close match with the elevated terrain (Tetzlaff and Peters, 1988; Laing and Fritsch, 1993). This
orographycally induced convection propagates westward to a certain extent and contributes to the occurrence of the maxima located east of 25°E.
The Darfur mountains and the Tondou Massif (20-25°E) originate other frequency maxima between 1400 and 1600 UTC in the 5°-15°E longitudinal band where convection is triggered by the Air Mountains, the Jos Plateau and the Cameroon Highlands; the timing of peak convection is between 1500 and 1900 UTC. A frequency minimum occurs in the region 5°E-5°W where the flat terrain provides little trigger for the convection initiation. Farther west, maxima can be found in proximity of late evening or night time, essentially due to the elevated lands near the west coast.
The frequency of the overall convective activity clearly increases as the summer progresses and near the time of maximum solar heating a distinct impact of terrain elevation on the development of convection is noted. By local midnight, land-based convection enters a dissipation phase, which on average ends in the (late) morning. The diurnal cycle climatological mean is shown in Fig. 2.11 where the diurnal signal is averaged over the whole analysed period 2004 – 2008.
The intraseasonal rainfall variability is also analysed and presented hereafter for 2005 (Fig. 2.12), chosen for its particular long-lived and strong monsoon characteristics. June (Fig. 2.12a) shows a diminished diurnal amplitude compared to the seasonal average and the quasi-suppression of diurnal maxima in the 5°-2.5°W longitudinal belt. The convection exhibits diurnal maxima in the afternoon (1400-1800 UTC) with a well-defined propagation from the eastern source of convection inducing the nocturnal/morning maxima in the western part of the domain (15°W-10°W). July (Fig. 2.12b) retains similar major features with a strengthening of the diurnal cycle and a more widespread distribution of precipitation. The convective activity is suppressed at night time, especially around 3°W, 30°E ad 38°E. In August (Fig. 2.12c) the occurrence of precipitation further increases with an evident westward streak frequency; the streaks are longer lived, faster and longer. A sharp diurnal signal linked to topographic features is evident across all longitudes. In correspondence with the maximum solar heating strong convection develops that enters a dissipation phase around midnight to the end of the morning.
2.1.5 Harmonic decomposition
Time series of the diurnal precipitation occurrence, as described in section 2.1.1 and shown in Fig. 2.11, are analysed using Discrete Fourier Transforms (DFT) and the results are presented in Fig. 2.13.
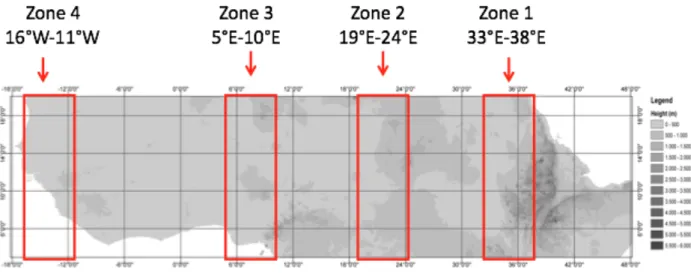
Three strong diurnal maxima located downwind of the Jos Plateau, the Darfur and the Ethiopian Highlands (17°W-10°W; 5°E-10°E; 15°E-25°E) are evident with a diurnal minimum east of 35°E. These findings consistently match the thermal forcing principles in presence of elevated terrain and diurnal frictional variation. In the lee of the principal plateaus the signals at both diurnal and synoptic ranges increase significantly from June to August (Fig. 2.13), showing a more longitudinal widespread distribution of convection along all longitudinal strips. The two weaker semidiurnal signals are located in the eastern part of the domain (25°E-30°E; west of 35°E), where the land-sea contrast may lead to the formation of sea-land breezes, mainly local in nature. The 4 longitudinal bands, where the power spectrum maxima are located, are shown in Fig. 2.14.
The phase and amplitude of the diurnal and semidiurnal signals shown in Fig. 2.13 are illustrated in Fig. 2.15, Fig. 2.17. A harmonic decomposition of wave numbers 0-2 is performed for the four longitudinal bands 5° in width (16°W-11°W; 5°E-10°E; 19°E-24°E; 33°E-38°E), which present maxima in the power spectra described in Fig. 2.13. These harmonics explain more than 90% of the total variance observed within all longitudinal bands. A further analysis has been computed increasing the number of harmonic component in the synthetic signal and compared to the remote sensing data. Increasing the wave number component in the June period increases the explained variance of several units and the synthetic signal is closer to the remote sensed signal.
Fig. 2.13: Power spectrum of the mean diurnal cycle of the instantaneous rainfall rate greater than 1 mm h-1 in the Hovmӧller space (Fig. 2.11) for: June (top), July (middle), and August (bottom) 2004-2008, plotted as a function of frequency


![Fig. 2.5: Monthly zonal wind (contour) and anomaly (shaded) cross section [m s -1 ] for August: a) 2005 and b) 2007](https://thumb-eu.123doks.com/thumbv2/123dokorg/8193780.127693/21.892.278.639.143.700/monthly-zonal-contour-anomaly-shaded-cross-section-august.webp)
![Fig. 2.6: Hovmöller diagrams (longitude-time) for zonal wind [m s -1 ] at 600 hPa for August: a) 2005 and b) 2007](https://thumb-eu.123doks.com/thumbv2/123dokorg/8193780.127693/22.892.203.695.113.852/fig-hovmöller-diagrams-longitude-time-zonal-wind-august.webp)
![Fig. 2.7: Hovmöller diagrams (longitude-time) for: a) surface latent heat flux [W m -2 ] and b) wind shear [m s -1 ] between 600 hPa and 925 hPa for August 2007](https://thumb-eu.123doks.com/thumbv2/123dokorg/8193780.127693/23.892.195.704.121.869/fig-hovmöller-diagrams-longitude-surface-latent-shear-august.webp)