Department of Aerospace Science and Technology (DAER) Master of Science in Space Engineering
Assessment of the humanitarian value of Earth
Observation missions based on the 2030 United
Nations Sustainable Development Goals
Supervisor:
Prof. Camilla Colombo Co-supervisor: Ing. Marco Nugnes
Author:
Alberto Candida De Matteo ID 928704
This content is original, written by the Author, Alberto Candida De Matteo. All the non-original information, taken from previous works, are specified and recorded in the Bibliography.
When referring to this work, full bibliographic details must be given, i.e.
Candida De Matteo Alberto, “Assessment of the humanitarian value of Earth Ob-servation missions based on the 2030 United Nations Sustainable Development Goals”. 2020, Politecnico di Milano, Faculty of Industrial Engineering, Department of Aerospace Science and Technologies, Master in Space Engineering, Supervisor: Camilla Colombo, Co-supervisor: Marco Nugnes
Earth observation satellites are an important asset for humanity, thanks to their unique point of view on human activities. With payloads capable to acquire data on Earth’s ecosphere at an increasing level of quality, space-based remote sensing allows to obtain information of paramount importance for the development of our society in several ways. The relevance of this kind of information requires an evaluation method not only depen-dent on its economical value, which would not be sufficient to assess the improvements brought to humanity. This thesis formulates an index aimed at measuring the value of an Earth observation mission in terms of social benefits that it can help support or achieve. The score for each mission is determined accounting for both satellite and payload speci-fications, based on a statistical analysis of existing missions. In order to obtain this score, a large set of missions’ features are acquired from on-line sources to build a database con-taining information regarding both sensors characteristics and orbital parameters. The code developed is then used to translate information in the database into performance objectives to be achieved by future missions. The performances are defined based on the 2030 United Nations Sustainable Development Goals, thanks to a literature review aimed at translating each goal into mission requirements in the form of payload type, spatial and temporal resolution, and geographical coverage. Selected goals are then considered to determine whether a mission’s characteristics are sufficient to provide improvements to the set of already existing Earth observation data. Finally, the mission score is evaluated based on the number of goals that it helps to achieve. The humanitarian score is then evaluated for several existing and programmed mission, drawing conclusion on the ideal characteristics required by a space mission to maximise the score.
I satelliti per l’osservazione terrestre sono un’importante risorsa per l’umanit`a, grazie al loro peculiare punto di vista sulle attivit`a umane. Con strumenti in grado di acquisire dati sull’ecosfera terrestre ad un crescente livello di qualit`a, l’osservazione terrestre dallo spazio permette di ottenere informazioni di fondamentale importanza per lo sviluppo della nostra societ`a sotto diversi aspetti. L’importanza di questo tipo di informazioni richiede un metodo di valutazione non solo dipendente dal valore puramente economico, il quale non risulterebbe sufficiente per misurare i miglioramenti apportati all’umanit`a. Questa tesi formula un indice che misura il valore di una missione di osservazione terrestre in termini di benefici per la societ`a che `e in grado di supportare o garantire. Il punteggio per ogni missione viene determinato considerando sia le specifiche del satellite che del sensore, basandosi su un’analisi statistica di missioni pre-esistenti. Al fine di ottenere questo risultato numerico, un vasto gruppo di caratteristiche di missioni `e stato acquisito da fonti on-line al fine di costruire un database contenente informazioni riguardanti le caratteristiche dei sensori e i parametri orbitali. Il codice sviluppato `e poi in grado di trasformare le informazioni contenute nel database in obiettivi per le prestazioni che de-vono essere soddisfatti dalle future missioni. Le prestazioni sono state definite basandosi sugli Obiettivi di Sviluppo Sostenibile dell’Organizzazione delle Nazioni Unite, grazie ad una ricerca nella letteratura finalizzata a trasformare ogni obiettivo in specifiche richieste riguardanti il tipo di sensore impiegato, le risoluzioni spaziali e temporali, e la copertura geografica. Specifici obiettivi vengono poi considerati per determinare se le caratteristiche di una missione sono sufficienti per provvedere miglioramenti all’insieme di dati di osser-vazione terrestre che vengono considerati rilevanti. Infine, il punteggio di una missione viene valutato in base al numero di obiettivi che `e in grado di supportare. Il punteggio umanitario viene dunque calcolato per diverse missioni esistenti o programmate, determi-nando le caratteristiche ideali di una missione spaziale richieste al fine di massimizzare il punteggio.
1 Introduction 1
1.1 State of the art . . . 3
1.2 Aim and contributions of the thesis . . . 6
1.3 Thesis outline . . . 6
2 Index formulation 8 2.1 Formulation of a data-driven score: LCA vs KPIs . . . 10
2.1.1 The Life Cycle Assessment . . . 11
2.1.2 The Key Performance Indicators . . . 13
2.1.3 Comparison of the methods . . . 14
2.2 Theoretical overview . . . 15
2.2.1 The shape of EO data . . . 15
2.2.2 Index requirements . . . 17
2.2.3 Performance indicators . . . 18
2.3 Implementation . . . 19
2.3.1 Formulation of the KPI objective . . . 20
2.3.2 Statistical analysis of the trends . . . 22
2.3.3 The final score . . . 23
3 Analysis of the goals 25 3.1 Earth observation sensors . . . 27
3.1.1 Active sensors . . . 28
3.2 Relation between goals and payloads . . . 31
3.2.1 SDG 1: No Poverty . . . 31
3.2.2 SDG 2: Zero Hunger . . . 34
3.2.3 SDG 3: Good Health and Well-being . . . 35
3.2.4 SDG 6: Clean Water and Sanitation . . . 36
3.2.5 SDG 7: Affordable and Clean Energy . . . 37
3.2.6 SDG 8: Decent Work and Economic Growth . . . 39
3.2.7 SDG 9: Industry, Innovation and Infrastructure . . . 40
3.2.8 SDG 11: Sustainable Cities and Communities . . . 42
3.2.9 SDG 14: Life Below Water . . . 43
3.2.10 SDG 15: Life on Land . . . 44
3.2.11 SDG 16: Peace, Justice and Strong Institutions . . . 46
3.3 Relations summary . . . 47
4 Database definition 49 4.1 Creation of the payload specifications database . . . 53
4.2 Creation of the mission specification database . . . 56
4.2.1 Retrieving the COSPAR ID . . . 57
4.2.2 Retrieving the TLE . . . 58
4.3 The final database . . . 59
5 Use simulation and results 61 5.1 Use of the code . . . 62
5.1.1 Phase 1: User input and determination of satisfiable goals . . . 62
5.1.2 Phase 2: Database search . . . 64
5.1.3 Phase 3: Trend evaluation and point attribution . . . 65
5.1.4 Phase 4: Overall index and output . . . 69
5.3.1 Evolution of the same mission . . . 73 5.3.2 Scores for different mission architectures . . . 75
6 Conclusions and further developments 78
A Python codes 82
A.1 Database creation . . . 82 A.2 Score Evaluation . . . 89
1.1 List of all 17 SDGs - Courtesy of the UN website [7]. . . 3 2.1 Overview of the interdependencies between the steps that transform EO
data into humanitarian improvements. . . 9 2.2 Comparison between the qualities of the LCA and KPI methods. . . 15 2.3 Groundtrack for one period of orbits at 40◦ (yellow), 60◦ (blue) and 80◦
(red). . . 17 2.4 Overview of the code structure with the index evaluation section highlighted. 20 2.5 Exponential fitting of some generic values. . . 23 2.6 Extrapolation of the fitted function. . . 23 3.1 Animal paths (yellow) highlighted from the analysis of high definition
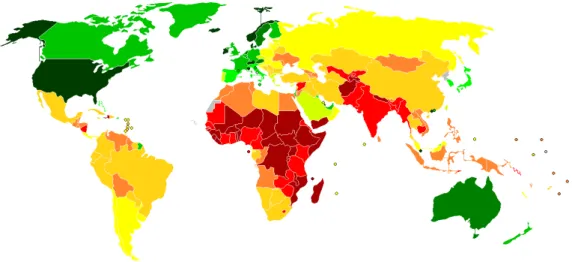
satel-lite imagery - ©GAF AG (map), RapidEye (EO imagery) [41]. . . 32 3.2 Map showing countries’ 2018 GDP per capita (nominal): dark red
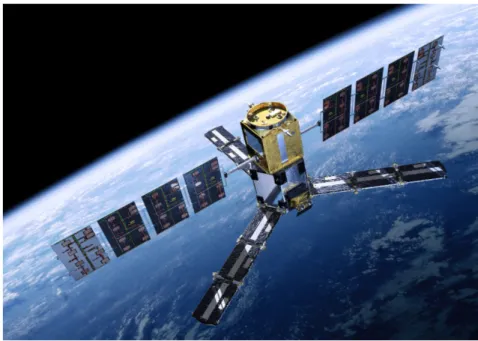
repre-sents values below $ 1,000, dark green values above $ 60,000 - Image by KREOH, CC BY-SA 4.0 via Wikimedia Commons. . . 33 3.3 The SMOS satellite showing the peculiar Y shaped MIRAS sensor -©ESA/AOES
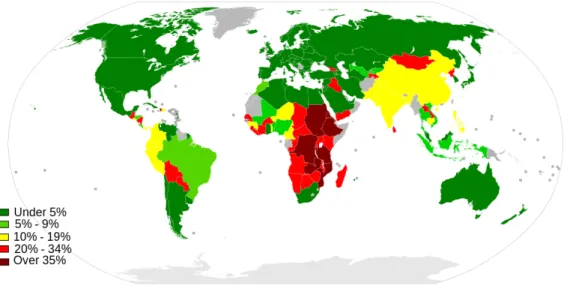
Medialab [45]. . . 35 3.4 Map showing the national percentage of undernourished population in 2012
- Image by Shibo77, CC BY-SA 3.0, via Wikimedia Commons. . . 36 3.5 AOT in March 2020. . . 37 3.6 AOT in May 2020. . . 37
3.8 AOT in September 2020. . . 37 3.9 Map showing the risk attributed to water quality from a World Bank report
[50]. . . 38 3.10 Map showing off-shore wind velocity - information obtained from Global
Wind Atlas 3.0, a free, web-based application developed, owned and op-erated by the Technical University of Denmark (DTU). The Global Wind Atlas 3.0 is released in partnership with the World Bank Group, utiliz-ing data provided by Vortex, usutiliz-ing fundutiliz-ing provided by the Energy Sector Management Assistance Program (ESMAP). For additional information: https://globalwindatlas.info [52]. . . 39 3.11 Map showing city dimensions in 2018 and the expected growth rate by the
year 2030 [54]. . . 40 3.12 Map showing roads distributions around the world -©European
Commis-sion Joint Research Center (JSC). . . 41 3.13 Map showing the incidence of IUU fishing activities [59]. . . 44 3.14 Current and historic satellites with biodiversity-measurement capabilities
- sourced from [60]. . . 45 3.15 Geographical position of the 25 biodiversity hotspots - sourced from [61]. . 46 3.16 Major illicit drug producing and major drug-transit countries according to
the US DOS [64]. . . 47 4.1 Overview of the steps to formulate the database - ovals represent inputs,
rectangles are Python functions and rounded rectangles are outputs. . . 52 4.2 Some entries of the online payload database found at https://www.wmo-sat.
info/oscar/instruments [70]. . . 53 4.3 Example of information table for a payload in the WMO database - from
info/oscar/satellites [69]. . . 56
4.5 First entries of the final joint database. . . 59
5.1 First request posed by the code. . . 62
5.2 Payload requests posed by the code. . . 63
5.3 Mission requests posed by the code. . . 64
5.4 satisfiable matrix for this simulation. . . 64
5.5 First entries (partial view of the columns) of the multi-indexed comparison payload table. . . 65
5.6 Examples of the information contained in the database regarding spatial and temporal resolution. . . 66
5.7 satisfied matrix for this simulation. . . 69
5.8 Text returned by the code detailing the satisfaction or not of the goals. . . 70
5.9 Table provided to the user containing the final score for the mission. . . 70
5.10 Imag-1 spatial resolution comparison with similar sensors for SDG 1. . . . 71
5.11 Imag-1 revisit time comparison with similar sensors for SDG 1. . . 71
5.12 Scat-1 spatial resolution comparison with similar sensors for SDG 2. . . 71
5.13 Hyper-1 spatial resolution comparison with similar sensors for SDG 6. . . . 72
5.14 Hyper-1 revisit time comparison with similar sensors for SDG 6. . . 72
5.15 Spec-1 revisit time comparison with similar sensors for SDG 3. . . 72
5.16 SAR-1 spatial resolution comparison with similar sensors for SDG 7. . . 73
5.17 SAR-1 revisit time comparison with similar sensors for SDG 7. . . 73
1.1 The first two targets for SDG 1 and their indicators. . . 4
3.1 Overview of index requirements and performance indicators for all SDGs considered. . . 48
5.1 Payloads specifications provided as input. . . 63
5.2 Final score for the Sentinel-1A mission. . . 74
5.3 Final score for the Sentinel-2A mission. . . 74
5.4 Final score for the Sentinel-3A mission. . . 75
5.5 Final score for the Sentinel 1 2 and 3 constellation. . . 75
5.6 Specifications comparison between L-SAR and PALSAR-3. . . 76
5.7 Score results for the Tandem-L mission. . . 76
5.8 Score results for the ALOS-4 mission (only considering the PALSAR-3 sensor). . . 76
ALOS Advanced Land Observing Satellite AOT Aerosol Optical Thickness
ASCAT Advanced SCATterometer
CEOS Committee on Earth Observation Satellites DLR Deutsches zentrum f¨ur Luft- und Raumfahrt DQI Design Quality Indicators
ECV Essential Climate Variable EO Earth Observation
EO4SD CR Earth Observation for Sustainable Development - Climate Resilience cluster
EOL End Of Life
ESA European Space Agency
FAO Food and Agriculture Organization GDP Gross Domestic Product
GEO Group on Earth Observations GNSS Global Navigation Satellite System ID International Designator
IFAD International Fund for Agricultural Development ISO International Organization for Standardization IUU Illegal, Unregulated and Unreported
JAXA Japanese Aerospace Exploration Agency
KPI Key Performance Indicator LCA Life Cycle Assessment
LCIA Life Cycle Impact Assessment LCI Life Cycle Inventory
LEO Low Earth Orbit
MIRAS Microwave Imaging Radiometer using Aperture Synthesis MODIS MODerate Resolution Imaging Spectroradiometer
MSI Multi Spectral Imager
OLCI Ocean and Land Colour Imager OMM Orbit Mean-elements Message RADAR RAdio Detection And Ranging ROI Return On Interest
SAR Synthetic Aperture Radar SDG Sustainable Development Goals TLE Two-Line Elements
UCS Union of Concerned Scientist
UNOOSA United Nations Organization for Outer Space Affairs URL Uniform Resource Locator
US DOS United States Department Of State
WEMSAR Wind Energy Mapping using Synthetic Aperture Radar WHO World Health Organization
Introduction
Near-Earth space represents nowadays an essential region which is a valuable asset for humanity. Despite satellites being one of the latest technological developments and proofs of Earth’s existence in the Universe, the total number of operative satellites registered at 31st July 2020 is equal to 2787 [1], and it would not be surprising if, at any given time, many people around the world were closer to a satellite than to their nation’s capital city. Indeed, more than two thirds of the Earth-orbiting satellites are located in the so-called Low Earth Orbits (LEO), characterised by an average altitude below 1,000 km. LEO satellites can actually orbit much lower than the 1,000 km, with the Japanese Aerospace Exploration Agency (JAXA) TSUBAME satellite setting the record in late 2019 with the lowest orbital altitude set at 167.4 km [2], about fourteen times the cruising altitude of commercial airplanes. All these satellites operate as tools to support human activities and development, exploiting the unique and functional point of view that only space can provide. Satellites appear in people’s life every day through navigation and telecommunication capabilities, granting services that it would not be possible to achieve through other infrastructures. Another use of space is remote sensing, that is the monitoring of the Earth’s surface and collection of information about its ecosphere, which contains the parts of the environment habitable by living organisms, providing relevant data to model terrestrial phenomena on a global scale.
Space activities provide humanity with added value both in terms of economical return and humanitarian benefits. As an example, the European Union developed the Copernicus programme, the largest provider of Earth Observation (EO) data in the world, which is projected to generate ¿ 56 billion of socioeconomic benefits over the period 2019-2035 [3]. On the other side, the Copernicus programme supports and helps to monitor the Paris climate change agreement [4] thanks to the climate change service, which provides relevant information and mitigation tools in its support.
The economical value of a space mission is assessed as the profit generated by an investment, and according to the European Space Agency (ESA) for every 1 Euro invested in their science mission 1.6 Euro is generated in the wider European economy [5]. The value in terms of humanitarian benefits is harder to be defined, but a similar estimation would be as important as the economical value in the assessment of the worthiness of the mission. The evaluation of humanitarian improvement can be based on the 2030 agenda for sustainable development, which proposes 17 points of action to achieve peace and prosperity for people and the planet. The Sustainable Development Goals (SDG) [6] face global issues affecting both developing and developed regions of the world, ranging from people living in poverty conditions to climate change. The goals are a useful tool to direct efforts towards specific targets, ensuring that all relevant issues are taken into account.
Adopted by all United Nations member states in 2015, the 2030 agenda for sustainable development is the result of more than 20 years of action plans aimed at improving worldwide living conditions, sparked from the 1992 Agenda 21 adopted at the Rio de Janeiro Earth Summit and signed by 178 nations. The goals selected the year 2030 as the deadline for the achievement of 169 targets subdivided among the 17 goals. Each of the 169 targets is measured by one or more indicators, which enable the possibility of measuring the level of satisfaction for each target. Indicators are subdivided into three tiers based on the level of methodological development and availability. At the time of writing, the classification contains 123 tier I indicators, which possess internationally established measurement methodology and are regularly produced by countries, 106 tier II indicators,
Figure 1.1: List of all 17 SDGs - Courtesy of the UN website [7].
which are measured according to standards but they are not regularly produced, and 2 indicators that have multiple tiers in their components. An example of targets and their indicators is reported in Table 1.1.
The aim of this thesis is to use the SDGs to transform the overall target of improving social conditions into defined points of action, assuming that the actions in the direction of any one of the goals eventually lead to significant humanitarian benefits. Each SDG is indeed linked to specific observation requirements that allow its completion through the use of EO data, so that the value of a space mission can be measured in this context.
1.1
State of the art
The importance of EO data towards the achievement of humanitarian targets is not a new concept. Wiesmann et al. [8] explored the use of Synthetic Aperture Radar (SAR) capabilities to support the implementation of humanitarian aid, highlighting the unique
1.1 By 2030, eradicate extreme poverty for all people everywhere, currently measured as people living on less than $1.25 a day
1.1.1 Proportion of population below the international poverty line, by sex, age, employment status and
geographical location (urban/rural) 1.2 By 2030, reduce at least by half the
proportion of men, women and children of all ages living in poverty in all its
dimensions according to national definitions
1.2.1 Proportion of population living below the national poverty line, by sex and age
1.2.2 Proportion of men, women and children of all ages living
in poverty in all its dimensions according to national definitions Table 1.1: The first two targets for SDG 1 and their indicators.
information about terrain stability and deformation that the spaceborne sensor is capable to provide. A paper by Ghosh et al. [9] published in 2012, 3 years prior to the creation of the 2030 Agenda, already implemented night-time satellite imagery to measure human welfare, considered a fundamental resource for a sustainable future.
With the introduction of the SDGs, humanitarian applications of EO data received more attention. In 2017, the Group on Earth Observations (GEO) published the booklet ”Earth Observations in support of the 2030 Agenda for Sustainable Development” [10], highlighting the potential role of EO in supporting the framework of SDG indicators. The document provided also a list of reference scenarios presenting practical cases of EO in the context of SDGs and eventually addressed national organizations encouraging the application of EO data. In 2018, both the Committee on Earth Observation Satellites (CEOS) [11] and Copernicus [12] (supported by the European Commission) published handbooks presenting use cases and explanations of the importance of Earth observation.
The CEOS Handbook provided insights on the uses of EO for the evaluation of the SDG indicators, also presenting examples for 5 goals. The Copernicus brochure showed instead how its services directly relate to some of the SDGs. Similarly, Caribou Space published a report [13] that presented the impact of EO data in several fields, such as agriculture, urban development and climate resilience. On the topic of practical implementation of EO data, Kavvada et al. [14] collected 17 manuscripts discussing the contributions that Earth science brought to the SDGs. More recent papers studied new methods to transform EO data into information relevant to the achievement of the SDGs. Ferreira et al. [15] performed a bibliographical research of all methods involving machine learning to process EO data in the context of sustainable development. Wood et al. [16] studied the role of small satellites both as a mean to monitor the progress toward SDGs and to work toward achieving the targets of the 2030 Agenda for Sustainable Development.
The value of EO data has been addressed by linking it to the SDG indicators. Anderson et al. [17] investigated the relation between EO and the SDGs, determining several benefits in the use of space-sourced data. Finally, Andries et al. [18] defined an analytical method to translate EO data into SDG indicators. The method is used to measure the relevance of EO data for each indicator based on the evaluation of the possibilities of data processing and the relevance that the processed data have. An updated version of the same framework is presented again by Andries et al. [19], introducing the opinions of a panel of experts and performing a more complete analysis of the EO data, accounting for uncertainties and cost effectiveness. In a similar fashion, Scalera [20] defined indices to quantify the humanitarian value of EO missions according to several services that they can support. These indices evaluate how well a payload performs in a scale from 0 to 100 with respect to each selected service, and are then linked to each SDG to assess how much a payload is capable to support each goal.
1.2
Aim and contributions of the thesis
This thesis formulates a data-driven procedure to assess the value of an EO mission in terms of social benefits, creating a versatile framework for the evaluation of hardly-quantifiable measures such as humanitarian improvements.
Despite the extensive literature that evaluates the value of Earth observation data in the context of sustainable development, no quantitative method has been defined to attribute a humanitarian value to a specific space mission. The aim of this work is then to provide a score, supported by data, that reflects the relevance of a mission in the achievement of the SDGs. This result is obtained based on the statistical analysis of existing missions and their performances, which requires the formulation of a database containing both information on the missions’ payloads and on their orbits. These values allow to quantify the performance of a mission, but an additional step is needed in order to define which are the parameters of interest in the context of each SDG.
This thesis is aimed at delivering a Python code to quantify the value of a mission in terms of number of SDGs that it is helping to achieve. In addition, a useful additional result of this work is the mission database which features a unique coupling of orbital and payload information for most existing EO missions, creating a useful tool for further studies in the context of sustainable development through space activities.
1.3
Thesis outline
This thesis reports all the steps followed to transform data into a final score, detailing the sources of information and their acquisition method, the rationale behind the process used to define the score and some use cases where the final developed work is applied. Chapter 2 introduces the reader to the issue of measuring performances and data quality in the context of humanitarian improvements. Chapter 3 provides an overview of the SDGs considered in the analysis and explains the choices that link them to selected requirements and performance indicators. Chapter 4 is instead focused on the method used to acquire
the data on which the analysis is based, leading to the formulation of a mission database. Chapter 5 guides the reader through a simulation of the score assessment for a generic mission, then discusses the results and application on real missions. Finally, Chapter 6 sums up the process described and the products created, concluding by stating the limitations of this analysis and possible future developments.
Index formulation
The quantitative assessment of a space mission’s humanitarian value is a complex task. Improvements in the quality of everyday life cannot be easily quantified as a number, and the common practice of quantifying benefits in economical terms fails to account for im-provements which do not directly translate into an amount of money [21]. Furthermore, the objective of an Earth observation mission is the acquisition of information, which can then be exploited to formulate informed decisions. The transformation of data into policies is not controllable during the preliminary mission design and operation phases, nevertheless it is assumed that such process can benefit from a large amount of relevant information. Hence, while space-sourced information cannot be turned directly into im-provements in the quality of life, the concept behind this thesis is that the availability of more precise data can support decision-makers in formulating their policies.
The quality of data can be measured by first introducing their intended use, so that their relevance can be contextualised. In accordance with a previous thesis by Scalera [20], the choice of referring to the United Nations SDGs is taken as a direct consequence of this idea, as they provide a complete and reliable guideline to define how EO data can be used to improve living conditions. The existence of 17 well-defined goals is of paramount importance to proceed with the assessment of a mission’s value since they define the problems that can benefit from EO, which in turn drive the selection of the
relevant features for a mission.
The following step towards a precise definition of ”better data” requires familiarity with the field of Earth-orbiting missions, since each goal has to be linked to a set of space-sourced products which ensure improvements in the direction of its achievement. Fortunately, this aspect has already been analysed by accredited institutions such as ESA [22] and the United Nations Organization for Outer Space Affairs (UNOOSA) [23], resulting in a complete series of methods that allow space missions to gather useful data for each goal. Eventually, these guides provide the final link that connects missions and social improvements: based on the previous assumption, better life conditions can be achieved by ensuring that future mission focus on improvements of the correct aspects, specified by each goal.
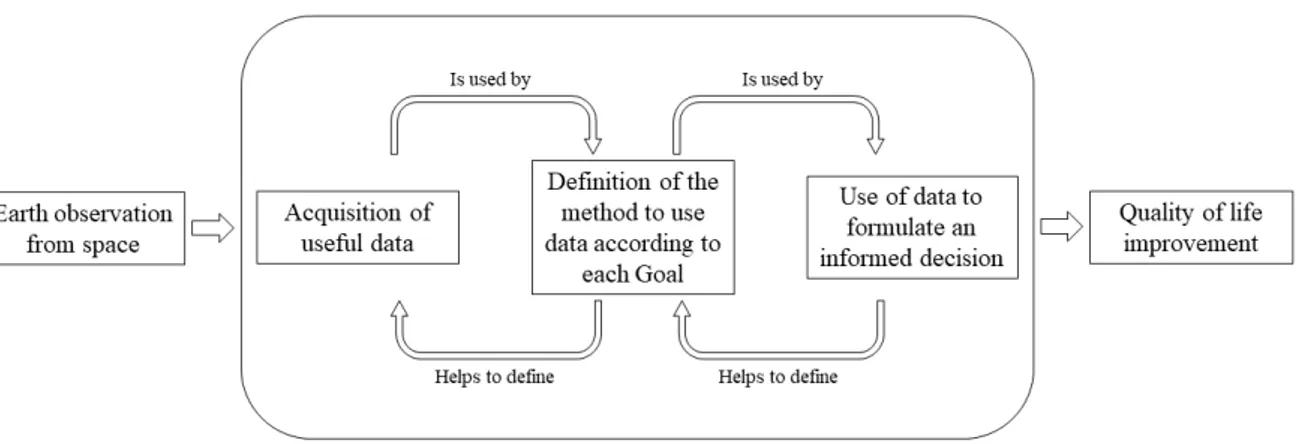
Figure 2.1: Overview of the interdependencies between the steps that transform EO data into humanitarian improvements.
This work provides a numerical method to deal with the first step of this process, that is the definition of what useful data are in the context of the SDGs. The following chapter provides an in-depth look on such process, focusing mainly on the method that has been selected to quantify the quality of data. Chapter 3 will instead focus on each Sustainable
Development Goal and describe specifically the meaning of ”better data” for each goal.
2.1
Formulation of a data-driven score: LCA vs KPIs
This work is focused on the numerical quantification of measurements that are hard to evaluate because they regard the impact on everyday life. Hence, the total work can be divided into two cores:
A collection of data that must be as complete as possible; A robust method to transform data into a measure of quality.
These two components are independent and can therefore be analysed in two different phases of the overall process. Even though it constitutes the second step of the process, the method that measures data quality will be introduced first, to give a clear idea of the assumptions behind the work. This section will assume that a complete set of data is available and contains all the information of interest. The creation of such set is faced in Chapter 4.
The selection of the method to quantify the quality of data was based on the most common theories available, considering also those used outside the space mission field. The first method that is used to formulate a quality index for a process is the Life Cy-cle Assessment (LCA), used commonly to assess the environmental impact of a project considering all of its aspects and effects from the beginning to disposal. Even though the scope of the method is not exactly what is required in the context of this thesis, it provides a well structured process to transform data acquired into a final score that can be customized to the user’s need. Another method that comes from a different field is the formulation of a Key Performance Indicator (KPI), which operates by creating a target to be achieved in a defined amount of time [24].
These two methods can appear hard to be compared or used interchangeably, but it will be shown how some tailoring is capable to adapt them to achieve the same objective.
2.1.1
The Life Cycle Assessment
As descibed in the paper by Hunt and Franklyn [25], the definition of LCA as the assess-ment of the complete environassess-mental impact of a product was first expressed in the 1960s, but a complete definition was only introduced by Harry E. Teasley, manager of the pack-ing function at The Coca-Cola Company, in 1969 [25]. Mr. Teasley’s aim was to quantify the energy and materials needed for a package and its environmental consequences from the extraction of raw materials to disposal. Other companies started to consider the same problem and, from 1972 on, the series of procedures that constituted what shortly after became the LCA started to reach the public. Nowadays, this process is standardised by the International Organization for Standardization (ISO) in its document ISO 14040 which describes the principles and framework to perform the LCA.
According to ISO, the process is divided into four phases: 1. Goal and scope definition
2. Life Cycle Inventory analysis (LCI) 3. Life Cycle Impact Assessment (LCIA) 4. Interpretation phase
The phase interested in the identification of the quality of data is the LCIA, which consists in the quantification of the information obtained during the LCI phase. The result of the LCIA is achieved through the use of indicators that are formulated based on the aspects of interest in the analysis, for example considering the effects on climate change, eutrophication, human and ecological toxicity. Eventually, it is the use of this kind of indicators that allows to quantify the quality of data.
The LCA has already been used in the framework of space activities, even in a some-what tailored form, meaning that the scope of the analysis in some cases was not ex-clusively the assessment of the whole environmental impact of a mission, and the frame-work was used instead to define a score based on some environmentally-related objective.
Maury et al. [26] analysed all the uses of the LCA in the framework of space activities, highlighting 38 documents that adopt the method according to the ISO specifications. ESA represents the main author with 28 documents, highlighting the effort of Euro-pean countries in supporting a sustainable development of space activities. As previously introduced, some of these papers use the LCA to provide a score based on a specific envi-ronmental objective. Colombo et al. [27] used the method’s steps to formulate an index to measure and compare different End Of Life (EOL) options in the context of space debris mitigation. This paper is a clear example of how uncommon indicators such as debris risk and orbit resource, which evaluate the risk associated to collisions and explosions and the value of orbital bins respectively, can be used for an ad-hoc LCA analysis, adapting it to a specific objective while keeping its defined structure.
Following this example, a given number, N , of indicators, Ii, assessing the effects of a mission on the achievement of the SDGs can be formulated and a final mission score, Itot, can be determined considering all the indicators together with normalisation coefficients, ni, and weights, wi.
Itot = N X
i=1
Iiniwi (2.1)
This well-structured method is a great framework to achieve a final value for a score given an objective cost, but the problem of quantifying the aspects of interest for such objective is still contained in the formulation of the specific index Ii. The challenge in the formulation of an index is the requirement of being measurable and relevant to the final goal, which in this case is hard to express in terms of numbers. In addition, once all the specific indices have been formulated, the definition of an overall score requires to evaluate their relative weights, which may consist in coefficients impossible to compare to one another. A series of methods are available to approach the problem as presented in the report by Sala et al. [28], based on the extensive use of the LCA in several applications:
in-dicator is distant from a previously defined objective that each inin-dicator is supposed to achieve;
2. Panel-based: weights are selected by a group of experts expressing their opinions and preferences;
3. Monetary: requires the estimation of the monetary impact of each specific indica-tor.
No specific method is assumed to be more important than the others, and this con-stitutes a problem because the correct formulation of an index is useless if coupled to an incorrect weight when computing the final score.
This brief overview on the LCA shows how a standardised method provides an inter-esting framework for the quantification of data quality, but also highlighting its sensitivity to relevant issues of non-trivial solution.
2.1.2
The Key Performance Indicators
In the early 1900s, the industrial growth brought the attention to the problem of quan-tifying business performances in a complete and reliable way, with the aim of defining strategic decisions based on these measured variables. The first result of such analysis was introduced at the DuPont factory by Donaldson Brown, who introduced a compre-hensive series of financial indicators to evaluate the Return On Investment (ROI) [29]. Nowadays, the world of business metrics is well developed, and for the last 40 years the typical measure of performance has been the KPI. KPIs measure the success of an organisation towards the achievement of a previously defined goal, and are therefore a quantifiable measure of the overall performance of the aforementioned organisation.
KPIs should be adapted to each organization, as each one of them will have different objectives that reflect the current strategic decisions and requirements. In a similar fash-ion, the concept of KPIs can be used in the field of space activities to define an expected behavior and check whether or not the system of interest is behaving according to the
desires. The use of KPIs for space applications has been introduced by Di Fazio et al. [30] defining the indicators of interest for space-based tracking of goods, and by Wokke et al. [31] in which KPIs were used to monitor the performance of the EGNOS and Galileo constellations.
Similarly, but in a completely different context, the versatility of KPIs was appreci-ated also in the field of construction, with the creation of the Design Quality Indicators (DQI), whose scope is the evaluation of building’s design quality. This last example is an interesting proof of how these indicators can be used to evaluate performance not only connected to the corporate world. The DQI is a panel-based indicator which follows the development of a construction project and provides a score assessing the design quality based on the three principia of Function, Build Quality and Impact, which are derived from the classical Vitruvian concepts of Firmitas, Utilitas and Venustas [32].
The example shows that the concept behind this kind of indicator is broad enough to be applied also in the context of data quality assessment, breaking the constraints imposed by the standardized process of the LCA. This new framework opens the door to a different formulation of an index, where data have to be translated into a goal and are not directly used to evaluate the indicator.
2.1.3
Comparison of the methods
The advantages of the two methods presented are summarized in the radar graph shown in Figure 2.2, which graphically highlights how the LCA, while being more structured, fails to compete with the KPI approach in some key parameters which are required for the creation of an index in the context of data quality assessment, with goals that are hard to be numerically quantified.
The KPI approach is selected for this work since it allows to store the complex quan-tification of a goal concerning life quality in an objective to achieve, without additional numerical consideration that hardly adapt to this environment.
Figure 2.2: Comparison between the qualities of the LCA and KPI methods.
2.2
Theoretical overview
The implementation of KPIs for the specific case of EO missions will now be explained. The goal of this section is to explain how data acquired from Earth observation satel-lites can be considered good or not in relation to the achievement of the Sustainable Development Goals, answering the question concerning the definition of ”better data”.
2.2.1
The shape of EO data
To measure the quality of data, a fundamental step is to understand what are the data available. Space-based Earth observation, also called remote sensing, is used to obtain information regarding Earth’s surface and atmosphere without the need for local measure-ments. Information are captured by the sensors mounted on EO satellites which compose its payload and are usually the main reason the whole mission is created. Sensors are mostly based on the reception of an electromagnetic field to acquire data, where the field can be generated by the sensor itself (”active” sensor, as in radars) or by other sources (”passive” sensor, as in optical imagers). These sensors can measure the intensity, phase,
polarity or bandwidth of the signal, and transform such measurements into useful data for the final users, usually in the form of images. A more detailed analysis of available sensor types and specifications is presented in Chapter 3.
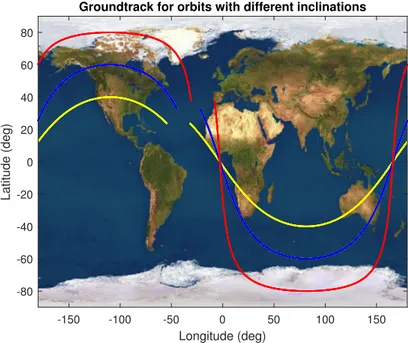
The type of data acquired is dependent on the payload, but the satellite on which payloads are mounted also has an effect on it, as the satellite and its orbit are responsible for the areas that the sensors can cover. Figure 2.3 shows the groundtracks (projection of the satellite position onto Earth’s surface) for one period of a circular orbit at an average altitude of 300 km for different orbital inclinations. It is clear that changing this parameter affects which areas can be sensed by EO missions, meaning that increasing the orbital inclination also increases the maximum latitude that can be observed. For the purpose of this work, it is assumed that the maximum latitude visible coincides with the orbital inclination. It must be noted that this consideration is valid if sensors were only capable to see the area right below the satellite, which is not true as they will capture data from a non infinitesimal area, meaning that, depending on the sensor view angle, the width of the observed path (also called ”swath”, measured as a distance) changes, and the sensor is capable to view areas above the threshold imposed by the orbital inclination. Furthermore, some sensors also feature the possibility of obtaining measurements from areas that are not right below the satellite, in the so called off-nadir sensing. Nevertheless, since the inclination requirements are not strictly defined, the aforementioned assumption allows to simplify the evaluation of geographical coverage.
In addition, the orbital parameters also affect the time passing between two consecutive acquisitions of the same image, defined as ”revisit time”. This value depends on the swath of the sensor mounted on board, and it represents a value commonly measured for each payload in a mission.
After this brief overview on the framework in which EO missions operate and acquire data, it is easier to understand how the information available can be used to formulate a KPI objective. This process can be divided into two steps: the first is aimed at determining which are the conditions required to make a goal satisfiable, while the second step actually
Groundtrack for orbits with different inclinations -150 -100 -50 0 50 100 150 Longitude (deg) -80 -60 -40 -20 0 20 40 60 80 Latitude (deg)
Figure 2.3: Groundtrack for one period of orbits at 40◦ (yellow), 60◦ (blue) and 80◦ (red). determines if the conditions are also capable to satisfy the goal.
2.2.2
Index requirements
The Sustainable Development Goals propose objectives with the aim of solving defined problems around the world. These problem are not always present on a global scale, as they might be specific to some regions. The main takeaway at this point is that to acquire data for the completion of a specific goal, the satellite must be able to cover the area interested by that specific goal. While more refined evaluations might account for a model considering all orbital parameters, a rough representation of the area covered by a mission is given by the inclination of the plane onto which the satellite is orbiting, as presented in the previous pages. While such model does not assess the fraction of the period that the satellite spends above the area of interest, it easily provides another important information, that is the area which for sure will not be covered by the satellite’s groundtrack.
This consideration introduces the first of the Index Requirements that are different for each goal and must be satisfied by the mission considered in order to unlock the
possi-bility of satisfying that specific goal. Once the correct geographical coverage is achieved, another requirement consists in using the correct sensor to obtain relevant information for a specific goal. This requirement is based on the choice of the payload, because while several sensors might provide useful data for the fulfillment of a Goal, there is a single type of sensor that provides the most useful data and is therefore preferred to other kinds.
These two requirements are selected for each Goal based on the literature and on the state-of-the art requirements used in past missions, but these considerations will be further explored in Chapter 3. These two requirements must be first satisfied by the mission analysed before moving to the next step, which consists in the measurement of the interested mission performance and verifying whether they are sufficient to satisfy the KPI objective that has been imposed.
2.2.3
Performance indicators
The two main parameters for the evaluation of the performance of an EO mission are the spatial and temporal resolution. Both values are directly connected to the amount of information that can be acquired in a given amount of time, meaning that an improved spatial resolution is capable to provide more information per ”image” (broadly used as a term to define the result of the activation of any kind of sensor), while improved temporal resolution provides more images per unit of time. Apart from the efficiency of a mission expressed as information per unit of time, improvements in either direction lead to new and interesting ways in which EO data can be used.
Starting from the spatial resolution, improvements, which are associated to a decrease in the value of the image resolution if it is expressed as a distance, in this parameter allow the acquisition of data on smaller scales, meaning that not only what could have already been seen is now more precisely represented, but also that some features of Earth’s biosphere that appear on a small scale can now be studied from space, with all the benefits annexed to the remote sensing.
On the other side, the importance of a sensor’s acquisition frequency is well known and studied, with some famous effects being the aliasing phenomenon and Shannon’s theorem. While this field is generally studied in the unit of Hertz or its multiples, space-sourced data are usually obtained with a time between acquisitions of the same image in the order of days. Nevertheless, these sensors are usually exploited to study dynamical processes with very long characteristic times, that can be sometimes measured in years, so improvements in the temporal resolution allow to better understand some phenomena and also unlock the access to processes occurring on a smaller time frame.
For these reasons, these two values are used to measure the quality of the data that can be captured by a specific sensor, and the definition of quality itself will be dependent on the objectives of each goal.
2.3
Implementation
With the overall framework explained, it is now possible to present how the KPI objectives are formulated and how the satisfaction of such goals leads to improvements towards the SDGs.
The final aim of this work is to obtain an algorithm capable of evaluating numerically the value of an Earth observation mission. Hence the analysis must start with information provided for the analysed mission, which will be referred to as ”user input”. This input consists in a set of information that must be provided to evaluate the final score, as they will allow to determine if the mission is capable of satisfying some input requirements and then if they provide a level of performance sufficient for the satisfaction of a specific goal. The input consists of the number and specifications of sensors mounted on the satellite, other than some mission-related parameters such as inclination of the orbital plane and expected year of launch. With these information, the algorithm automatically identifies which goals are satisfiable and satisfied, formulating a KPI objective and checking if the goal is reached or not. This analysis is performed for all SDGs that can benefit from EO
Figure 2.4: Overview of the code structure with the index evaluation section highlighted. data, with a final score accounting for all goals together. An example of the algorithm use is presented in Chapter 5.
The actual implementation of the algorithm will now be explained in a general overview, without considering a reference example.
2.3.1
Formulation of the KPI objective
One important feature of a KPI objective is the measurability of the quantities that define the index. Based on this concept, for the scope of this work the objective must be set con-sidering what kind of information are available for measuring. Instead of concon-sidering the actual data acquired by the satellites as the data on which the analysis is performed, the input are represented by the mission and payload specifications provided by the satellite’s
owner. This choice works assuming that the specifications provided reflect what the final user can expect to access when taking hold of the data, meaning that the ideal specifica-tions of the payload reflect the real specificaspecifica-tions of the data acquired. This assumption is true only when noise and other disturbances that afflict the real data acquisition can be neglected.
Basing the analysis on the satellite specifications allows to avoid complex and time-consuming analyses about the acquisition data while achieving the same result for what is required in this work. The mission database is then created with these types of informa-tion which are available online. The informainforma-tion contained in the database concerns the aspects needed to evaluate whether a mission satisfies the index requirements and reaches a sufficient score considering the performance indicators. Hence each satellite contained in the database will have the following information reported:
Orbital plane inclination; Year of launch;
For all payloads, the type of sensor mounted;
For all payloads, the lowest spatial resolution achievable, measured as a distance; For all payloads, the lowest revisit time achievable.
These information are sufficient to perform a statistical analysis of past missions’ performances and evaluate a KPI objective. The KPI is chosen in order to ensure a continuous improvement of the performances as it is required by each SDG, meaning that a new mission is considered satisfactory if it brings an improvement to the set of missions already available with a similar scope. To achieve this result, the database is filtered according to the satisfaction requirements for each goal, and the performance indicators are acquired for each entry of the database and coupled to the mission’s year of launch. The KPI goal is then set according to a statistical analysis aiming at improving, over
the launch of several missions, the current available set of missions or sensors that are relevant for each SDG.
2.3.2
Statistical analysis of the trends
This step of the analysis is used to quantify the KPI objective by defining a threshold which must not be overcome in order to satisfy the goal. The threshold is defined by a chronological analysis of previous missions, with the intent of determining an improving trend for the performance indicator of interest. The database information, filtered ac-cording to the requirements for each SDG, are therefore first grouped together. Then, if for example the spatial resolution is a performance indicator for a specific goal, all the best spatial resolutions available for the database entries of interest are acquired and linked to each mission’s year of launch. The intent is to find a trend improving over time, meaning that the resolution decreases, and base the KPI goal on the projection of the trend over the expected year of launch. Whenever an improving trend is not recognized, the objective-setting rule will be different, as it is explained further on.
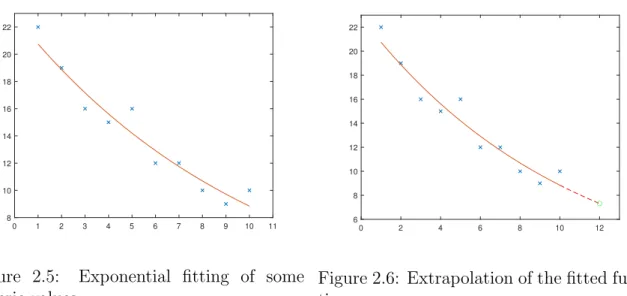
In order to define an improving trend, the algorithm exponentially fits the data avail-able looking for the function in the form y = aebx that minimises the squared error M SE = N1 PNi=1(y − ˆy)2 with ˆy being the values obtained from the filtered database. Then the algorithm checks whether the trend is decreasing by verifying that b < 0 and if this condition is verified, the function is used to extrapolate the desired value based on the mission launch year provided as an input.
An example of this procedure is reported in Figures 2.5 and 2.6, where the acquired information (crosses) is fitted by an exponential function (continuous line) and the same function is used to determine the desired value given a point in the future (circle). This projected value constitutes the threshold that must be surpassed by a mission launched on that year in order to consider the objective satisfied.
This check is performed in all cases, but sometimes the trend of the database informa-tion is not improving over time, and an exponential fitting would lead to an objective that
0 1 2 3 4 5 6 7 8 9 10 11 8 10 12 14 16 18 20 22
Figure 2.5: Exponential fitting of some generic values. 0 2 4 6 8 10 12 6 8 10 12 14 16 18 20 22
Figure 2.6: Extrapolation of the fitted func-tion.
is higher than the performances currently available, therefore leading to no improvements over time. This case is faced by ordering the values in increasing order and choosing the first 25%, then setting a goal equal to their average. As missions that satisfy this require-ment launch and become part of the database, the threshold keeps decreasing, therefore achieving the intended goal of improving performances over time.
One last case is introduced in the algorithm in order to increase its usability. If the launch year is not an information available as an input, which might occur if the user is evaluating the score of an early-development stage mission, the algorithm will set as threshold the best performance available in the database, so that the improvement over time is ensured independently from the expected year of launch.
2.3.3
The final score
The last step in the evaluation consists in defining the overall score for the mission, accounting for all SDGs and payloads available. All the steps presented so far lead to a boolean score for each goal for each sensor, representing whether the payload is capable to satisfy the objective set for each goal. The final score is evaluated by first checking if each of the goals is satisfied by at least one of the payloads so that it can contribute to the determination of the overall score according to its weight. The weights are selected
based on the number of goals considered relevant by the user, so that once all single-goal scores are summed up, the overall score is 100 if all SDGs of interest are satisfied.
Analysis of the goals
The definition of the KPI objective cost is the initial step towards the connection of SDGs and EO data. The previous chapter presented an overview of the methodology used in this thesis with the aim to make simpler the analysis of the following chapters. On the other side, presenting the methodology before the definition of the information available limits the possibility of expressing relevant examples coming from the analysis actually developed, with the risk of resulting too general.
This chapter introduces another fundamental component of the analysis, that is the relation between SDGs and the sensors that generate information useful for their scope. At the end of the chapter, the description of the method connecting EO data to humanitarian objectives will be concluded, leaving as last task only the method to acquire the data on which the analysis is based on. Therefore, this chapter will again consider the missions database as a complete set of data containing all the information required.
As for the evaluation of data quality in the context of the SDGs, there is not a mathematically exact way to make decisions also when linking goals and sensors. Different sensors in orbit exist in order to capture different kinds of information coming from the ecosphere, and it is the combination of different sources of information that allows to obtain the most complete results. This issue is the main challenge in the quantification of an EO mission value in support of the SDGs. The power of space-sourced data is
the availability of information coming from several origins, that are combined to support and validate each other. For simplicity purposes though, each SDG is connected to a single sensor type, which is not to be considered as the only one capable to acquire relevant information for the goal. All the sensor choices are based on opinions expressed by experts on scientific papers and on the relation between the characteristics of a sensor and the ways, proposed by reputable institutions, in which each goal can be achieved through EO data. The choice of connecting each goal to a single type of sensor introduces a limit on the power of this procedure, but the requirement of performing an analysis that is quantified and versatile requires the introduction of some simplifications.
As a final introductory remark, it must be noted that not all SDGs benefit from space-sourced data. Indeed, the following goals hardly gain from Earth Observation, and will not be considered in the analysis:
SDG 4: Quality education; SDG 5: Gender equality; SDG 10: Reduced inequalities; SDG 17: Partnership for the goals.
In addition, two more goals will not be considered in the analysis: SDG 12 - Respon-sible consumption and production, and SDG 13 - Climate action. SDG 12 resulted to be too similar to Goal 2 - Zero Hunger, as in the framework of EO data both objectives can be achieved improving the efficiency in the use of what is available for herding and agriculture and would have resulted in the same requirement originated from the same reasons, meaning that these two goals would have always been both satisfied or both not satisfied. The choice of considering SDG 2 instead of SDG 12 comes from the method used to satisfy the goal, which is closer in nature to the first goal of the two. For what concerns SDG 13, the reason for its exclusion is different. While researching the effects of EO data affecting climate change, it became clear that it was impossible to select a single sensor
type capable of capturing information that are more useful than the others. Guos et al. [33] summarised all the relevant Essential Climate Variables (ECV) and the methods to measure them, which require several different types of sensors to complete the analysis. The paper also states the importance of multi-satellite, multi-sensor, and long-term time series remote sensing data to study the effects of climate change on terrestrial ecosystems. This goal is therefore not considered as most (if not all) sensors would contribute to its completion, affecting the value of the overall score.
These decisions are supported by the absence of the mentioned goals among those that CEOS selected to be the most suitable to benefit from EO data in its CEOS Earth Observation Handbook [34], that are:
SDG 6: Clean water and sanitation;
SDG 11: Sustainable cities and communities; SDG 14: Life below water;
SDG 15: Life on land.
The goals unmentioned so far, while not being part of the most relevant according to CEOS, showed relevant applications of remote sensing data, and a sensor type that allows to acquire data that can be considered more useful than the others.
The chapter begins with an overview of the sensors of interest for this evaluation and their working. Section 3.2 is instead dedicated to the motivation behind the sensor choice for each goal.
3.1
Earth observation sensors
The procedure followed in this thesis focuses more on the EO sensors than the missions in their integrity, since the information available online for the former are sufficient to quantify the differences in the quality of data gathered by different missions. Nevertheless,
as introduced in the previous chapter, one relevant aspect of the missions that is not completely dependent on the sensors is the geographical coverage, which will be considered in this analysis in the form of the orbital inclination. Due to the relevance of the sensors in this work, it was deemed important to offer a brief introduction on the means of operation of the sensors that will be considered.
The rationale behind remote sensing is that measuring the properties of electromag-netic fields that interacted with Earth’s ecosphere allows to obtain information on the features the field interacted with. The electromagnetic field is measured and the signal generated is processed in order to retrieve the information on those features. The ad-vantage of performing these measures from space consists in the collection of continuous information over a very large geographical area without the need of local measures that in some cases might be very complicated or even impossible.
Even if each sensor analyses a different aspect of the electromagnetic field, EO sensors operate in a unique way: active sensors generate a transmission signal that interacts with the feature of interest and measures the parameters associated to the reflected signal, therefore avoiding the dependence on external sources, while passive sensors measure the signal emitted or reflected by the Earth, with substantial improvements in terms of complexity and operational power compared to active sensors.
An overview of the four types of sensors that will be related to the goals is presented in the next section, categorised as active and passive sensors.
3.1.1
Active sensors
Synthetic Aperture Radar (SAR)
A generic RAdio Detection And Ranging sensor (RADAR) uses an active approach to evaluate the range and/or velocity of an object. The emitted signal bandwidth belongs to the radio and microwave spectra, that are frequencies in the order of MHz up to tens of GHz. In the field of remote sensing, radars are used for mapping rather than detection,
meaning that the output of a radar is a monochromatic image representing the distance of all resolution cells (the smallest area that the radar can discern) from the sensor, which can be represented as a map with some processing. Radars are very common payloads on board of Earth observation missions due to their very high spatial resolution that can be achieved thanks to the selection of the signal to transmit and the measurement of the signal phase at reception.
The radar’s spatial resolution is also related to the antenna size, meaning that larger antennas are capable to capture finer images. The synthetic aperture radar was introduced with the aim of greatly increasing resolution without the need for very large antennas that would be impossible to mount on a satellite. A SAR solves this problem by theoretically extending the size of the antenna thanks to its motion while the transmitted signal travels to the target and then back to the antenna [35]. The result is a resolution up to 1 m (SAR-X mounted on TanDEM-(SAR-X and TerraSAR-(SAR-X [36]). Additionally, synthetic aperture radars can acquire information through clouds and vegetation depending on the signal frequency, neglecting what would otherwise be strong limitations for the observation.
Scatterometer
A scatterometer operates with the same configuration of a radar, meaning that the signal measured is transmitted by the sensors itself. The difference with respect to radars is that scatterometers measure the intensity of the received signal with very high resolution, and are therefore capable of determining from this measurement features of the Earth’s surface [37]. A common use of this sensor is for the evaluation of marine wind speeds based on the signal scattered by the waves generated by the wind. Data acquired by scatterometers are of vital importance for studies on the interaction between air and sea and their effects on weather patterns.
3.1.2
Passive sensors
Optical imager
Satellite optical imagery is another very common method to acquire information from Earth’s orbit. This sensor operates like common cameras by capturing the electromagnetic field reflected by the area of interest [38]. In most cases the source of the field is the Sun, but in cases such lightning detection the source may be the feature of interest itself. Imagery is not limited to the visible spectrum: cameras that operate in the infrared spectrum can acquire information on the temperature of the area observed, with important effects on meteorology. Another example are images taken in the so-called ”water-vapor channel” (35.3 THz to 57.6 THz), which allow to detect the atmospherical humidity since these frequencies are particularly sensible to absorption from the water.
In addition to providing very high resolution images (tens of cm), satellite imagery is very useful thanks to the image processing capabilities that are borrowed from the terrestrial use of cameras. These techniques allow to discern features in images thanks to artificial intelligence, introducing an additional set of information to the image. The limitations of satellite imagery consist in the need for the ideal illumination conditions to capture proper images, which ultimately constrains missions with these payloads to Sun-synchronous orbits.
Spectroradiometer
The last sensor of interest actually consists in the combination of two different types of sensors: a spectrometer and a radiometer. Spectrometers are sensible to a wide band of frequencies and are used to measure the spectra contained in a signal [39]. Knowing the spectral content of a reflected signal is useful to understand the nature of the material that reflected the signal, hence a spectrometer in orbit can be used to identify vegetation or minerals on the surface, or to assess the level of contamination of water. Spectrometers are not used to measure the amplitude of the signal since they are generally not calibrated
and the result depends on the sensitivity to each band. Spectroradiometers introduce the capability to measure the signal amplitude also with high radiometric resolution, resulting in a sensor that is very useful to acquire information about the atmosphere and its components.
3.2
Relation between goals and payloads
In the context of EO missions, satellite payloads mainly consist in the sensors used to acquire Earth data. For this reason, the terms ”payload” and ”sensor” are generally used interchangeably throughout the work. The method followed to connect SDGs to a specific relevant payload is based on guidelines provided by ESA [22] and by UNOOSA [23]. These two sources provide a list of projects and guidelines describing how space activities support each SDG through remote sensing, telecommunication infrastructures and GNSS. These references acted as a starting point for the literature research aimed at obtaining expert’s opinions on the ideal way in which useful data are acquired. Each sensor selection is supported by a scientific paper describing its superior performance in a scenario relevant to the goal analyzed, possibly comparing it to other sensor types. Whenever possible, the selection of the performance indicators is also based on the literature, and the source will be explicitly reported. If the importance of spatial or temporal resolution is not explicitly reported in the papers, the selection is clearly motivated by other reasons. The required inclination interval is instead based on the geographical distribution of features of interest for each goal.
3.2.1
SDG 1: No Poverty
The number of people living in extreme poverty conditions (defined as life at or below 1.90 USD per day) reduced from 36% in 1990 to 10% in 2010 [40]. The target for 2030 is to have poverty levels below 3%. This goal can be achieved focusing on worldwide rural areas, where poverty levels are three times higher than in urban ones [40], resulting in a
more effective use of resources.
The ESA proposal for SDG 1 is the support of basic activities such as herding with information from EO satellites. One example comes from the work of the International Fund for Agricultural Development (IFAD) which in 2013 supported the development of herding in the southern Niger’s department of Aguie through satellite imagery for the detection of herding tracks [41]. The resulting maps highlighted paths followed by herds between pastures, water points and grazing areas, which helped in decreasing tensions between farmers and herders for the use of limited resources.
Figure 3.1: Animal paths (yellow) highlighted from the analysis of high definition satellite imagery - ©GAF AG (map), RapidEye (EO imagery) [41].
Satellite optical imagery was selected for this scope compared to other products thanks to the possibility of exploiting advanced feature-recognition algorithms, shown in Figure 3.1, which cannot be applied to other forms of information. This versatility allows to exploit optical images for a wide selection of purposes, which is compliant with the many
methods in which poverty can be measured and monitored. In addition, satellite imagery supports SDG 1 through the help provided to development banks [42] in securing fundings in region that are hard to monitor.
These motivations lead to the choice of connecting SDG 1 to an optical imager sensor. Concerning the orbital inclination interval of interest, the choice is based on the national Gross Domestic Product (GDP) used to asses the wealth of a country. As shown by Figure 3.2, the more interesting area is the sub-saharian region, but in order to ensure coverage over Afghanistan as well, whose GDP ranks 109th worldwide according to an International Monetary Fund 2020 estimate, the acceptable inclination interval is set to [40◦, 140◦]. The performance indicators chosen for this goal are both spatial and temporal resolution, due to common need in obtaining relevant data for herding and investment monitoring. Spatial resolution is needed in order to capture small scale features such as animal tracks and small urban developments, while temporal resolution is required to capture the dynamics of the observed phenomena which occurs in the timeframe of days.
Figure 3.2: Map showing countries’ 2018 GDP per capita (nominal): dark red represents values below $ 1,000, dark green values above $ 60,000 - Image by KREOH, CC BY-SA 4.0 via Wikimedia Commons.
3.2.2
SDG 2: Zero Hunger
According to an article by the United Nations Food and Agriculture Organization (FAO), a main parameter for the analysis of hunger is reliable access to sufficient food at all times, therefore requiring the management of the resources available so that food production can be programmed in advance. According to a 2008 World Bank report, agriculture is twice as effective compared to other sectors at reducing hunger in low-income economies [43], therefore increasing the efficiency of agriculture is the most relevant aspect to achieve goal 2.
Remote sensing allows to evaluate the geographical distribution of soil moisture, which in turn allows for the programming of crop seeding and the estimation of production. A paper by Grings et al. [44] analysed different sources of soil moisture data, focusing the comparison on two payloads: the Advanced SCATterometer (ASCAT) onboard METOP-A and the Microwave Imaging Radiometer using METOP-Aperture Synthesis (MIRMETOP-AS) onboard SMOS. The analysis results in comparable performances of the two sensors, but it must be noticed that MIRAS achieves its results exploiting a synthetic aperture, therefore requiring an inherently more complex design, visible in Figure 3.3. For this reason, as the performance of the two sensors is the same, a scatterometer is to be preferred thanks to its simpler design.
Again the inclination interval is selected based on the worldwide distribution of under-nourished people, reported as Figure 3.4. The map shows that covering Mongolia, where in 2018 21.3% was deemed undernourished (FAO data), would allow to cover all nations with more than 5% of the population suffering from hunger, hence the inclination interval is set to [50◦, 130◦]. Due to the low spatial resolution that scatterometers are capable to provide (in the order of 10 km), high spatial resolution is an important target to achieve for precise geolocation of soil moisture. Time resolution is not considered relevant in this case, as no dynamic process has to be followed.
![Figure 1.1: List of all 17 SDGs - Courtesy of the UN website [7].](https://thumb-eu.123doks.com/thumbv2/123dokorg/7511891.105304/20.892.169.726.171.517/figure-list-sdgs-courtesy-website.webp)


![Figure 3.1: Animal paths (yellow) highlighted from the analysis of high definition satellite imagery - ©GAF AG (map), RapidEye (EO imagery) [41].](https://thumb-eu.123doks.com/thumbv2/123dokorg/7511891.105304/49.892.112.778.440.893/figure-highlighted-analysis-definition-satellite-imagery-rapideye-imagery.webp)