1
Scuola Normale Superiore
Ph.D. Thesis in Methods and Models for Molecular Science
Understanding molecular phenomena and
mechanisms occurring in the lipid membranes
through molecular dynamics simulations
Candidate
Advisor
Muhammad Jan Akhunzada
Prof. Giuseppe Brancato
2 This thesis is dedicated to
My beloved parents
“Prof. Dr. Iftikhar. H. Qari and Fehmidah Iftikhar”
For providing me with everything and for making me who I am today with their continuous affection, backing and guidance
My teachers from my primary education to Ph.D. Who taught me, corrected me and shaped my future
My mentors
Who inspired me and motivated me
My ever supporting and loving siblings Waleed Jan, Faiza Jan, Osman Jan, Wardah Jan
My sweet Nieces and Nephews Malaak, Awatif, Nofal
Ibrahim, Abdul Mannan, Ayaan, Hassan Noah
My Friends
Ishaq Badshah, Farhan Haq, Nabeel Ahmed, Saad Ali, Nabeel Khalid for brightening the dull and mundane moments
and
My amazing and lovely wife “Dr. Amna Farrukh”
For believing in me and for standing by my side
3
Acknowledgement
First of all, I am deeply grateful to Allah Almighty for the ability and strength to complete my research work, publications and this thesis. Working as a Ph.D. student in Scuola Normale Superiore, Pisa, was a magnificent as well as a challenging experience. During these years, many people were instrumental, directly or indirectly, in shaping up my academic career. It was impossible to thrive in my doctoral work without the precious support of these personalities. Here is a small tribute and word of thanks to all those people.
I would like to specially thank my supervisor Professor Giuseppe Brancato for the opportunity he has given me to undertake my doctorate at Scuola Normale Superiore, Pisa, Italy, which is one of the most prestigious institutes in Italy and highly ranked among European universities. I express my gratitude for all the academic support, help and guidance he provided to me throughout my Ph.D. degree. It was only due to his valuable guidance, cheerful enthusiasm and ever friendly nature that I was able to complete my research work in a respectable and timely manner. His confidence, patience and encouragement has paved my way to understanding, planning and executing the undertaken projects and delineate them into a written form. I am really thankful to him for being such a nice teacher, an exemplary mentor and I shall remain indebted to him for life.
My special thanks to my friend and lab colleague Dr. Balasubramaniam Chandramouli without whom I could not have grasped the very concepts of MD simulations and research in general. I am also thankful to him for introducing me to python and his help in formulating many analysis scripts and correcting them for me. He was a source of continuous help and moral support in the starting days of my Ph.D. degree.
I wish to express gratitude to my experimental collaborator at NEST SNS, Francesco Cardarelli. He and his group members provided me with valuable and insightful experimental results and comments which were used as the experimental evidence for the computational studies I conducted and was able to publish later on. I would like to specially thank one of his
4 Ph.D. students late Dr. Carmine Di Rienzo who started Rhodamine work with me and provided initial results related to the study but he unfortunately passed away prematurely and couldn’t see the final published paper.
I express thanks to the Scuola Normale Superiore, Pisa, Italy for all the facilities including food, accommodation, research funding and academic support that assisted working in a congenial environment. I extend my gratitude to respected Prof. Vincenzo Barone for providing me the Ph.D. scholarship at the Scuola Normale Superiore, Pisa. I am thankful to Dr. Giordanno Mancini for providing assistance and submission scripts for Avogadro computing clusters. Appreciation also goes out to the technical support team especially to Alberto Coduti for providing robust computer and technical assistance and simplifying the submission of MD Jobs on the clusters. I am thankful to all the office staff of the Scuola Normale Superiore especially Emanuela Brustolon, Silvia Zappulla, Luca de Francesco and Lucia Monacci who were always there to solve all the non-academic problems and that too on a very short notice and were always happy to help on such issues. Special thanks to all the funding sources including Scuola Normale Superiore and INFN for funding my projects, workshops and conferences. I would also like to thank Cineca,Italy for providing access to different HPC clusters.
I appreciate Dr. Balasubramaniam Chandramouli, Dr. Nuno Barbosa, Dr. Nicolous Bhattacharjee and Dr. Tommaso d’Agostino for giving me such a nice and friendly time, I am thankful to you guys for bucking me up that kept me energized and focused and for valuable advices over a cup of coffee.
I would like to acknowledge my lab colleague especially Dr. Andrea Catte for sharing work space and his valuable knowledge on membranes and Ion channels. I am also thankful to him for having fruitful discussions on the projects related to Ion channels and I acknowledge his contributions in various analysis in the Ion channel studies.
I would like to extend my sincere thanks in advance to the PhD committee and the external examiners who will evaluate my thesis and hopefully will give their constructive comments. I am really thankful to them for investing their precious time in reading and assessing my work.
5 I am thankful to my M.Phil. supervisor Dr. Syed Sikander Azam who introduced me to Molecular modeling and without his support and guidance I would not be able to come this far. I am really indebted for life to all my teachers since the beginning of my school days up to this day, without their sincere efforts none of this would have been possible.
I acknowledge the efforts of my family members during my degree. I am thankful from the core of my heart to my brothers and sisters who have always encouraged me in all my endeavors. Their reassuring remarks have always kept me on the right track and their special interests in my studies have made this thesis possible today. My nieces and nephews have made my Ph.D. times much easier with their sweet talks. I would also like to thank my brother in law Asad Ali Rajput for the moral and financial help he provided me during my stay in Italy and also gave me a place in his home at the start and end of my Ph.D. degree. Lastly I would not shy away without thanking the Italian people for their kind and hospitable attitude. Indeed Italy, its food and people will always have special place in my heart.
I am deeply grateful to my beautiful wife, Dr. Amna Farrukh for the support and care she provided me during my Ph.D. and the writing of this thesis. She continuously encouraged me with her motivating remarks and curbed any anxiety and doubts during this stressful time.
Finally, I owe a special thanks to my parents Dr. Iftikhar H Qari and Fehmidah Iftikhar, this journey would have never been accomplished without their continuous support and unconditional love. I am, indeed the most blessed to have my beloved parents around me whose prayers and endless kindness has not only comforted me in times of stress and respite but also strengthened me with vigor to move forward at every stage. My father’s valuable comments and constructive remarks have encouraged me to be a better person and to do good in life and my mother’s efforts for trying to discipline me would always be appreciated and respected.
I hope this Ph.D. furthers my quest for scientific learning and enables me to achieve technological advances that may benefit the scientific community. May Allah help me in all my future pursuits. (Amen).
6 The work in this thesis is based upon the following publications:
Akhunzada, M.J., Chandramouli, B., Bhattacharjee, N., Macchi, S., Cardarelli, F., Brancato, G., 2017. The role of Tat peptide self-aggregation in membrane pore stabilization: insights from a computational study. Phys. Chem. Chem. Phys. 19, 27603–27610.
https://doi.org/10.1039/C7CP05103D
Akhunzada, M.J., D’Autilia, F., Chandramouli, B., Bhattacharjee, N., Catte, A., Rienzo, R.D., Cardarelli, F., Brancato, G., 2019. Interplay between lipid lateral diffusion, dye concentration and membrane permeability unveiled by a combined spectroscopic and computational study of a model lipid bilayer. Scientific Reports 9, 1508. https://doi.org/10.1038/s41598-018-37814-x
Akhunzada, M.J., Sagresti, L., Catte, A., Bhattacharjee, N., D’Agostino, T., Brancato, G., 2019. Temperature Dependence of the Structure and Dynamics of a Dye-Labeled Lipid in a Planar Phospholipid Bilayer: A Computational Study. J Membrane Biol.
https://doi.org/10.1007/s00232-019-00081-6
Catte, A., Ferbel, L., Bhattacharjee, N., Akhunzada, M.J., D’Agostino, T., Brancato, G., 2019.
In silico investigation of the interaction between the voltage-gated potassium channel Kv4.3 and its auxiliary protein KChIP1. Manuscript submitted.
Del Frate, G., Macchiagodena, M., Akhunzada, M.J., D’Autilia, F., Catte, A., Bhattacharjee, N., Cardarelli, F., Brancato, G., 2019. Probing liquid-ordered and disordered phases in lipid membranes: a combined theoretical and spectroscopic study of a fluorescent molecular rotor. Manuscript in preparation.
Akhunzada, M.J., Bhattacharjee, N., Catte, A., Kocer, A., Brancato, G., 2019. Ion conductance in a voltage-gated potassium channel is tuned by a single mutation in proximity of the selectivity filter. Manuscript in preparation.
7
Table of Contents
Acknowledgement ... 3 List of Figures ... 11 List of Tables ... 22 Chapter 1 Introduction ... 25Chapter 2 Biological Background ... 31
2.1 Overview ... 31
2.2 Plasma Membranes: Models and Structural Composition ... 31
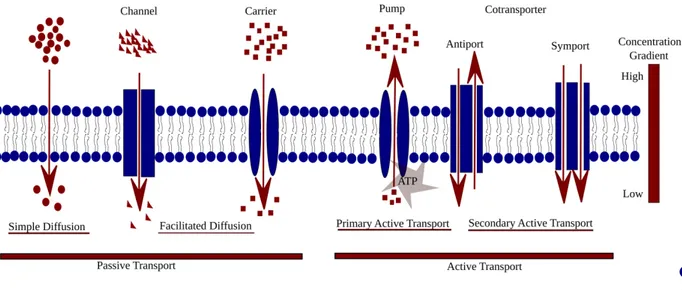
2.3 Mode of transport in biomembranes and role of proteins in transportation ... 35
2.4 Cell Penetrating Peptides ... 36
2.5 Voltage-gated potassium ion channels ... 38
2.6 Molecular rotors as probes for membrane properties ... 40
Chapter 3 Theoretical and Computational Methods ... 45
3.1 Molecular Dynamics Simulations ... 45
3.2 Statistical Mechanics ... 46
3.2.1 Classical Mechanics, Newton’s Second Law of Motion ... 47
3.2.2 Verlet Algorithm ... 49
3.3 Molecular Mechanics ... 50
3.4 Trajectory Analysis ... 51
3.4.1 Radial Distribution Function ... 51
3.4.2 Mean Square Displacement ... 51
3.4.3 Lipid Order Parameter ... 52
3.4.4 Normalized Water Density ... 52
3.4.5 Pulling Simulation and pulling force analysis ... 52
3.4.6 Average Pore Radius ... 53
3.4.7 Permeation and Conductance ... 54
Chapter 4 Insights into the interplay between dye concentration, lipid lateral diffusion and membrane permeability in lipid bilayers ... 55
4.1 Introduction ... 55
4.2 Computational Details ... 58
4.2.1 Molecular models of DOPC and dye-labelled lipid ... 58
4.2.2 Molecular model of an aggregated cluster of dye-labeled lipids ... 66
8
4.2.4 Data analysis ... 67
4.3 Results ... 69
4.3.1 Structural properties of the RHB-DOPC bilayer ... 69
4.3.2 Lipid lateral dynamics: DOPC vs RHB-DOPC ... 72
4.3.3 FCS measurements of lipid lateral diffusion effects of RHB concentration ... 74
4.3.4 High RHB concentration aggregation and membrane permeability change ... 75
4.3.5 Modelling RHB aggregation structural effects and lipid diffusion ... 77
4.3.6 Modelling RHB aggregation water permeation into the membrane ... 78
4.4 Discussion ... 80
4.5 Conclusions ... 83
Chapter 5 Temperature dependence of the structure and dynamics of a dye-labeled lipid in a planar phospholipid bilayer, a computational study ... 85
5.1 Introduction ... 85
5.2 Computational Details ... 88
5.2.1 Molecular models of DOPC and dye-labeled lipid ... 88
5.2.2 Molecular dynamic simulation parameters ... 89
5.2.3 Data analysis ... 90
5.3 Results ... 92
5.3.1 Temperature effects on the structural properties of the RHB-DOPC bilayer ... 92
5.3.2 Lipid lateral diffusion in pure DOPC and RHB-DOPC membranes ... 100
5.3.3 Partitioning of RHB lipids into the membrane ... 101
5.3.4 Local hydration at the RHB-DOPC membrane surface ... 109
5.3.5 Orientation of the RHB fluorescent headgroups ... 112
5.4 Discussion ... 114
5.5 Conclusions ... 115
Chapter 6 Probing liquid-ordered and disordered phases in lipid membranes, a combined theoretical and spectroscopic study of a fluorescent molecular rotor ... 117
6.1 Introduction ... 117
6.2 Computational details ... 120
6.2.1 Force field parameterization and QM calculations ... 120
6.2.2 Molecular dynamic simulation parameters ... 122
6.3 Results ... 123
6.3.1 Structure analysis and FF development ... 123
6.3.2 Model validation in organic solvents ... 128
6.3.3 Probing lipid phase in model bilayers through DPAP fluorescence lifetime ... 135
6.3.4 DPAP molecular dynamics in different lipid phases ... 137
6.4 Discussion ... 139
6.5 Conclusions ... 142
Chapter 7 The role of Tat peptide self-aggregation in membrane pore stabilization .. 154
7.1 Introduction ... 154
7.2 Computational Details ... 156
7.2.1 Model system generation ... 156
7.2.2 Molecular dynamic simulation parameters ... 160
7.3 Results ... 162
9
7.3.2 Tat11 and Tat11-TAMRA peptide translocation ... 163
7.3.3 Tat11-TAMRA monomer versus dimer translocation ... 166
7.4 Discussion ... 170
7.5 Conclusions ... 172
Chapter 8 Tuning the ion conductance in a voltage-gated potassium channel through a single mutation ... 174
8.1 Introduction ... 174
8.2 Computational Details ... 177
8.2.1 Kv4.3 Shal K+ channel system set up in the open state ... 177
8.2.2 Molecular dynamic simulation parameters ... 178
8.2.3 Data analysis ... 180
8.3 Results ... 180
8.3.1 Wild-type Kv4.3 ... 181
8.3.2 Comparison of WT, M373I and M373E ... 182
8.4 Discussion ... 189
8.5 Conclusions ... 191
Chapter 9 In silico investigation of the interaction between the voltage-gated potassium channel Kv4.3 and its auxiliary protein KChIP1 ... 192
9.1 Introduction ... 192
9.2 Computational Details ... 195
9.2.1 Kv4.3 T1-KChIP1 complex model ... 195
9.2.2 Molecular dynamic simulation parameters ... 196
9.2.3 Data analysis ... 197
9.3 Results ... 197
9.3.1 Wild-type Kv4.3 T1-KChIP1 complex ... 197
9.3.2 The first interface and its destabilization by the W8E-P10E-A15E Kv4.3 triple mutant ... 199
9.3.3 The second interface: structure, energy stability and effect of mutations ... 205
9.3.4 The third interface ... 217
9.4 Discussion ... 219
9.5 Conclusions ... 221
Chapter 10 Conclusions ... 223
11
List of Figures
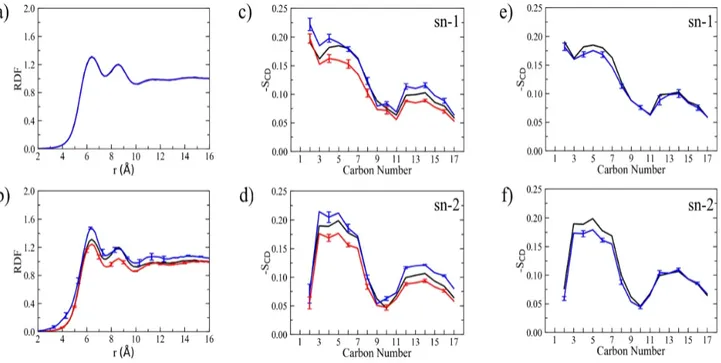
Figure 2.1: Fluid mosaic model proposed by Jonathan Singer and Garth Nicholson in the year 1972. ... 32 Figure 2.2: Structure of lipid molecules used in this thesis. ... 34 Figure 2.3: Schematic of different mode of transports mediated by channel, carrier and transport proteins. .... 36 Figure 2.4: Cell penetrating peptide (CPP) along with cargo molecule can take direct penetration pathway to permeate through lipid bilayer, the toroidal pore model a direct penetration pathway is shown. ... 37 Figure 2.5: a) Top view of the KV gated ion channel embedded inside the POPC lipid bilayer b) Side view of the KV gated ion channel embedded inside the POPC lipid bilayer. ... 40 Figure 2.6: structures of probes used in experimental and computational studies mentioned in this thesis, a) Rhodamine B linked to 1,2-dioleoyl-sn-3-phosphatidylehanolamine (RHB) b) tetramethylrhodamine-5-maleimide (TAMRA) dye c) 4-(diphenylamino)phthalonitrile (DPAP) d) 6-Dodecanoyl-N,N-dimethyl-2-naphthylamine (LAURDAN). ... 42 Figure 2.7: Snapshots from atomistic molecular dynamic simulations of different systems with the chromophores. a) DPAP embedded inside the DPPC bilayer containing cholesterol, b) RHB embedded inside DOPC bilayer and c) is TAMRA dye embedded inside the DOPC lipid bilayer. ... 43 Figure 4.1: a) Scheme of the RHB lipid. b) Side and c) top view of a MD simulation snapshot of the RHB-DOPC lipid bilayer. d) Side and e) top view of a MD simulation snapshot of the RHB-DOPC bilayer displaying RHB self-aggregation. RHB lipids are shown in yellow, with nitrogen in blue, while DOPC lipids are in gray with corresponding phosphate atoms in red; water is omitted for clarity. ... 57 Figure 4.2: a) P-P radial distribution functions (RDFs) obtained considering only DOPC-DOPC pairs as issuing from MD simulations of DOPC (black), RHB-DOPC (red) and RHBAgg-DOPC (blue, RHB self-aggregation) lipid bilayers. b) P-P RDFs obtained from DOPC (black, DOPC-DOPC pairs), RHB-DOPC (red, RHB-DOPC pairs) and RHBAgg-DOPC (blue, RHBAgg-DOPC pairs) bilayer simulations. c,d) Deuterium order parameters (SCD) evaluated for lipid acyl chains (i.e., sn-1 and sn-2) as issuing from MD simulations of DOPC (black, DOPC lipids), RHB-DOPC (red, RHB lipids) and RHBAgg-DOPC (blue, RHBAgg lipids) lipid bilayers. e,f) Deuterium order parameters (SCD) from MD simulations of DOPC (black, DOPC lipids) and RHBAgg-DOPC (blue, only DOPC lipids within 5 Å from any RHBAgg lipid) lipid bilayers. In all diagrams, error bars correspond to standard errors. ... 71 Figure 4.3: a) Mean square displacement (MSD) evaluated as a function of time from MD simulations of DOPC (black, DOPC lipids), RHB-DOPC (red, RHB lipids) and RHBAgg-DOPC (blue, RHBAgg lipids) lipid bilayers. Error bars correspond to standard errors. b) Mean square displacement (MSD) evaluated as a function of time from MD simulations of DOPC (black, DOPC lipids), RHB-DOPC (red, DOPC lipids) and RHBAgg-DOPC (blue, DOPC lipids) lipid bilayers. Error bars correspond to standard errors. c) Schematic representation of a FCS measurement. d) Confocal microscopy image of a GUV DOPC - 0.1% RHB, scale bar 1 micron. e) Effect of fluorophore concentration on the diffusion of RHB lipids in GUVs. f) Emission spectra of Rhodamine B at different
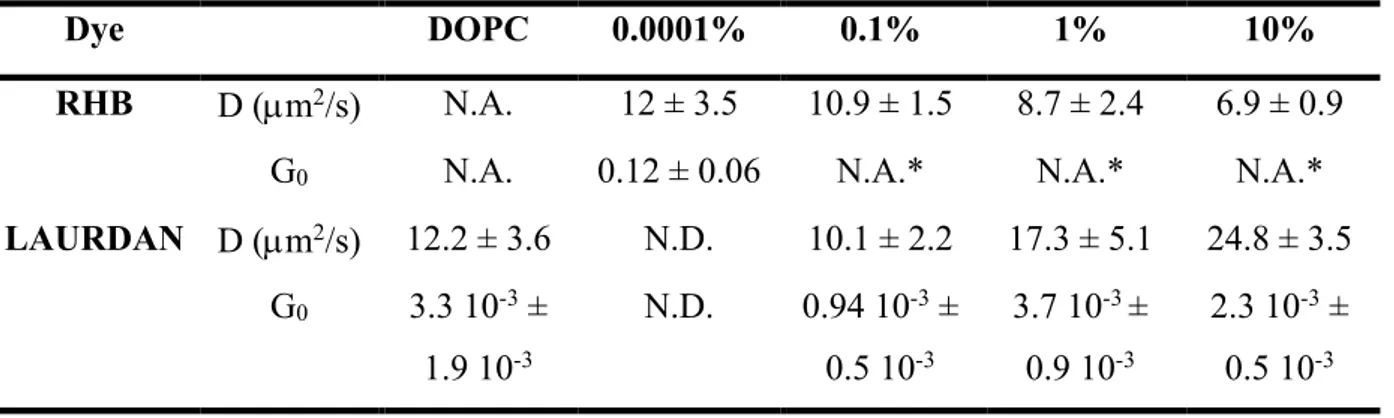
12 concentration (0.1% and 10%) in GUVs, the aggregation of Rhodamine B induces an emission spectra red shift of 8 nm, from 583 to 591 nm. ... 73 Figure 4.4: P - Na+ radial distribution functions (RDFs) obtained considering DOPC (black line) and RHB (red
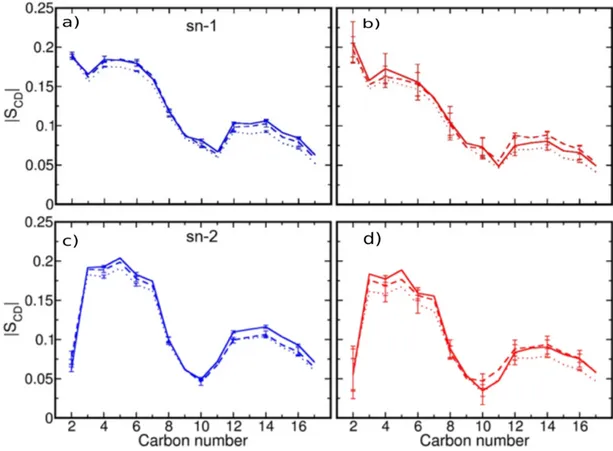
line) lipids as issuing from the RHB-DOPC MD simulation with 0.5M NaCl. Sodium ions are observed to penetrate the phosphate region of the lipid bilayer in a similar way with respect to both RHB and DOPC lipids. ... 74 Figure 4.5: a) Diffusion coefficient of LAURDAN increases with increasing concentration of RHB (blue dots), G0 remains constant (black dots). b) Confocal microscopy images of GUVs labelled with LAURDAN, the emission signal was split in two channels and polarity maps were obtained from these images using GP equation. c) GP values obtained in GUVs at different concentration of RHB. d) Water density distribution evaluated along a direction normal to the membrane surface as issuing from MD simulations of DOPC (black), RHB-DOPC (red) and RHBAgg-DOPC (blue, water within 5 Å in XY plane from the center of the RHB cluster) lipid bilayers. Origin was set to the average position of P atoms in one leaflet, negative values correspond to the inner bilayer region, positive values to the outer region and bulk solution. Water density was normalized with respect to bulk density. e) MD snapshot of the RHB cluster: RHB lipids are shown in orange, DOPC phosphate groups in red, water molecules within 5 Å from the RHB aggregate are in blue, while remaining water molecules at the membrane-water interface are in gray. f) Average membrane-water dipole moment evaluated along a direction normal to the membrane surface as issuing from MD simulations of DOPC (black) and RHBAgg-DOPC (red, water within 5 Å in XY plane from the center of the RHB cluster) lipid bilayers. ... 76 Figure 4.6: a,b) Deuterium order parameters (SCD) evaluated for lipid acyl chains (i.e., sn-1 and sn-2) as issuing
from MD simulations of DOPC (black, DOPC lipids), RHBAgg-DOPC (blue, only DOPC lipids within 5 Å from
any RHB lipid) and RHBAgg-DOPC (green, only DOPC lipids within 7.5 Å from any RHB lipid) lipid bilayers.
Small differences in DOPC order parameters appeared as caused by the local interaction with RHB lipids. In all diagrams, error bars correspond to one standard errors. Error bars of pure DOPC system (black lines) are negligible and then omitted for clarity in all plots. ... 78 Figure 4.7: 2D electrostatic potential maps as issuing from MD simulations of a) DOPC and b) RHBAgg-DOPC lipid bilayers evaluated on a lateral plane (i.e, XZ) of the simulation cell. Electrostatic potential evaluated along a direction normal to the membrane surface as issuing from MD simulations of c) DOPC and d) RHBAgg-DOPC lipid bilayers. In the latter case, the normal was selected to pass through the center of the RHB cluster. Origin was set to the center of the bilayer in both cases. Overall, the electrostatic potential can change by up to 0.6 V across the lipid bilayer, but RHBAgg-DOPC system shows a high degree of asymmetry with a peak at about 30 Å in correspondence to the RHB aggregate. ... 80 Figure 5.1: a) Molecular structure of the RHB lipid with the definition of vertical (v1) and horizontal (v2) molecular axes of the fluorescent polar headgroup. RHB sn-1 and sn-2 acyl chains are labeled together with significant carbon atoms of hydrophobic lipid tails on the sn-2 chain. Carbon, hydrogen, sulphur, phosphorus, oxygen and nitrogen atoms are shown in cyan, white, yellow, tan, red and blue, respectively. b) Side and c) top view of a MD simulation snapshot of the RHB-DOPC lipid bilayer with a 0.02 mol% RHB concentration. d) Side and e) top view of a 155 ns MD simulation snapshot of the RHB-DOPC lipid bilayer displaying RHB
self-13 aggregation. Carbon atoms of RHB lipids inserted into the DOPC lipid bilayer are shown in magenta, with the other atoms having the same color code of panel a, while DOPC lipids glycerol backbone and hydrophobic acyl chains are in green with corresponding polar headgroups in orange. For clarity, water and ions are not displayed. ... 86 Figure 5.2: Atoms selected to define horizontal (v1, red) and vertical (v2, blue) axes of the RHB fluorescent polar headgroup. Horizontal and vertical axes of the RHB polar fluorescent headgroup form angles α and β, respectively, with the lipid bilayer normal n, which is assumed to be coincident with the z-axis. A side view of a MD simulation snapshot of the RHB-DOPC lipid bilayer with a 2 mol% RHB concentration is shown in the right panel of the figure. The same color code of Fig. 1 is used for DOPC and RHB molecules. ... 91 Figure 5.3: RHB P-P distances from AA MD simulations of RHB-DOPC lipid bilayers with a 2 mol% RHB concentration performed at a), b) 320 K, c), d) 303 K and e), f) 293 K. Different colors are used for different P-P distances between all possible pairs of RHB molecules in upper and lower leaflets of the RHB-DOPC lipid bilayer. The formation of RHB aggregates is not observed at any temperature (RHB P-P distance > 2 nm). ... 95 Figure 5.4: P-P radial distribution functions (RDFs) of DOPC-DOPC and RHB-DOPC pairs from MD simulations of DOPC and RHB-DOPC lipid bilayers at three different temperatures. a) P-P RDFs of DOPC-DOPC pairs from MD simulations of DOPC-DOPC (blue: 293 K, turquoise: 303 K and cyan: 320 K) and RHB-DOPC-DOPC (violet: 293 K, magenta: 303 K and purple: 320 K) lipid bilayers. Note that the six lines appear as superimposed on one another. b) P-P RDFs of DOPC-DOPC (blue: 293 K, turquoise: 303 K and cyan: 320 K) and RHB-DOPC pairs (purple: 293 K, red: 303 K and green: 320 K) from DOPC and RHB-DOPC lipid bilayer simulations. Error bars of P-P RDFs DOPC-DOPC pairs in pure DOPC and RHB-DOPC systems are negligible and omitted for clarity in panel a. In all diagrams of panel b error bars correspond to standard deviations. ... 96 Figure 5.5: Deuterium order parameters (SCD) evaluated for sn-1 and sn-2 lipid acyl chains from MD simulations of DOPC and RHB-DOPC lipid bilayers at three different temperatures (solid, dashed and dotted lines: 293 K, 303 and 320 K, respectively). SCD of a), b) sn-1 and c), d) sn-2 acyl chains of DOPC and RHB molecules, respectively, from MD simulations of DOPC (blue, DOPC lipids) and RHB-DOPC (red, RHB lipids) lipid bilayers. Errors were estimated as standard deviations. ... 97 Figure 5.6: Deuterium order parameters (SCD) evaluated for sn-1 and sn-2 lipid acyl chains from MD simulations
of DOPC and RHB-DOPC lipid bilayers at three different temperatures (solid, dashed and dotted lines correspond to 293 K, 303 and 320 K, respectively). SCD of a), c), e) sn-1 and b), d), f) sn-2 acyl chains of DOPC
and RHB molecules, respectively, from MD simulations of pure DOPC (blue) and RHB-DOPC (DOPC and RHB order parameters are shown in green and red, respectively) lipid bilayers. Errors were estimated as one standard deviation. ... 99 Figure 5.7: a) Mean square displacement (MSD) of DOPC lipids evaluated as a function of time from MD simulations of DOPC (blue) and RHB-DOPC (green) lipid bilayers at three different temperatures (solid, dashed and dotted lines: 293 K, 303 and 320 K, respectively). b) MSD evaluated as a function of time from MD simulations of DOPC (DOPC lipids MSDs are shown in blue) and RHB-DOPC (RHB lipids MSDs are shown in red) lipid bilayers at three different temperatures (solid, dashed and dotted lines: 293 K, 303 and 320 K,
14 respectively). Error bars correspond to standard errors. Differences in error bars reflects mainly the different number of systems (i.e., 400 DOPC lipids and 8 free RHB lipids). ... 101 Figure 5.8: Partial density profiles across the lipid bilayer for different lipid components of DOPC and RHB lipids from MD simulations of RHB-DOPC lipid membranes at three different temperatures. Blue, green and red lines correspond to 293 K, 303 and 320 K, respectively, for a) DOPC phosphate (PO4-), b) RHB sulfonate (SO3
-), c) DOPC glycerol (OCH2-CHO-CH2) and d) RHB headgroup (NH-sulforhodamine B) groups. The partial density of each lipid moiety was initially averaged over the last 50 ns of the simulation and, then, the final average was performed over the four replicas at each temperature. ... 103 Figure 5.9: Partial density profiles across the lipid bilayer for different lipid components of DOPC and RHB lipids from MD simulations of RHB-DOPC lipid membranes at three different temperatures. Solid, dashed and dotted lines correspond to 293 K, 303 and 320 K, respectively. DOPC choline (CH2-CH2-N-(CH3)3+), phosphate
(PO4-), carbonyl (C=O), glycerol (OCH2-CHO-CH2), methylene (CH2), double bond (C=C) and methyl (CH3)
groups are shown with blue, orange, light green, green, red, yellow and black lines. RHB fluorescent polar headgroups (NH-sulforhodamine B) are shown with magenta lines. The partial density of each lipid moiety was initially averaged over the last 50 ns of the simulation and, then, the final average was performed over the four replicas at each temperature. ... 104 Figure 5.10: Partial density profiles across the lipid bilayer for different lipid components of DOPC lipids from MD simulations of RHB-DOPC lipid membranes at three different temperatures. Blue, green and red lines correspond to 293 K, 303 and 320 K, respectively, for DOPC a) phosphate (PO4-), b) choline (CH2-CH2
-N-(CH3)3+), c) glycerol (OCH2-CHO-CH2) and d) carbonyl (C=O) groups. The partial density of each lipid moiety
was initially averaged over the last 50 ns of the simulation and, then, the final average was performed over the four replicas at each temperature. ... 105 Figure 5.11: Partial density profiles across the lipid bilayer for different lipid components of DOPC lipids from MD simulations of RHB-DOPC lipid membranes at three different temperatures. Blue, green and red lines correspond to 293 K, 303 and 320 K, respectively, for DOPC a) methylene (CH2), b) double bond (C=C) and c)
methyl (CH3) groups. The partial density of each lipid moiety was initially averaged over the last 50 ns of the
simulation and, then, the final average was performed over the four replicas at each temperature. ... 106 Figure 5.12: Partial density profiles across the lipid bilayer for different lipid components of RHB lipids from MD simulations of RHB-DOPC lipid membranes at three different temperatures. Blue, green and red lines correspond to 293 K, 303 and 320 K, respectively, for RHB a) phosphate (PO4-), b) fluorescent polar head
(NH-sulforhodamine B), c) glycerol (OCH2-CHO-CH2) and d) carbonyl (C=O) groups. The partial density of each
lipid moiety was initially averaged over the last 50 ns of the simulation and, then, the final average was performed over the four replicas at each temperature. ... 107 Figure 5.13: Partial density profiles across the lipid bilayer for different lipid components of RHB lipids from MD simulations of RHB-DOPC lipid membranes at three different temperatures. Blue, green and red lines correspond to 293 K, 303 and 320 K, respectively, for RHB a) methylene (CH2), b) double bond (C=C) and c)
methyl (CH3) groups. The partial density of each lipid moiety was initially averaged over the last 50 ns of the
15 Figure 5.14: Snapshots of a single RHB molecule at a) 293 K, b) 303 and c) 320 K show the effect of temperature on the hydration of the RHB fluorescent headgroup. The lower panel of the figure reports the temperature and the average number of water molecules within one hydration layer (0.28 nm) of any atom of the RHB fluorescent headgroup from MD simulations of RHB-DOPC lipid membranes at three different temperatures. The number of water molecules was averaged over the last 50 ns of each simulation at each temperature. The errors are standard deviations. The same color code of Fig. 1 is used for DOPC and RHB molecules. Oxygen and hydrogen atoms of water molecules are shown in skyblue and cyan, respectively. ... 109 Figure 5.15: Water density distribution evaluated along a direction normal to the membrane surface from MD simulations of DOPC (solid lines) and RHB-DOPC (dashed lines) lipid bilayers at three different temperatures. a) Blue, green and red lines correspond to 293 K, 303 and 320 K, respectively. The origin was set to the average position of P atoms in both leaflets. Negative and positive values until ~2.5 nm correspond to lower and upper leaflets bilayer regions including water-membrane interfaces, respectively. Negative and positive values above ~2.5 nm refer to the bulk solution. b) A zoomed view in the region defined by the highest peak intensity of partial density profiles of DOPC glycerol and carbonyl groups (1.5 nm) show a higher water density in RHB-DOPC (dashed lines) lipid bilayers as compared to DOPC membranes (solid lines) at every temperature. ... 110 Figure 5.16: Water partial density profiles in the region defined by the highest peak intensity of partial density profiles of DOPC glycerol and carbonyl groups (1.5 nm) from MD simulations of DOPC (solid lines) and RHB-DOPC (dashed lines) lipid bilayers at a) 293 K (blue lines), b) 303 K (green lines) and c) 320 K (red lines). Snapshots of single RHB molecules at different temperatures show the increase in the hydration around RHB fluorescent headgroups below the DOPC glycerol backbone region. The same color code of Fig. 6 is used for DOPC, RHB and different types of water molecules. ... 111 Figure 5.17: Angle distributions of a) horizontal (v1) and b) vertical (v2) axes of RHB fluorescent polar headgroups at three different temperatures. Blue, green and red lines correspond to angle distributions at 293 K, 303 and 320 K, respectively. Horizontal and vertical axes of the RHB polar fluorescent headgroup forming angles α and β, respectively, with the lipid bilayer normal, which is assumed to be the z-axis, are also shown in the molecular representations of specific RHB molecules in right panels of the figure. The same color code of Fig. 1 is used for DOPC and RHB molecules. ... 113 Figure 6.1: 4-(diphenylamino)phthalonitrile (DPAP) 2D molecular structure a) and a con- figuration of the DPAP rotor (in magenta) in the DPPC:CHOL system b) highlighting in yellow the cholesterol molecules, in red and gray the polar head and non-polar tails, respectively. ... 119 Figure 6.2: DPAP propeller-like conformation as optimized in butanoic acid (solvent effect modeled by the PCM). Flexible dihedral are indicated with green vectors. The ipso (C1, C1’ and C”), the ortho (C2, C2’ and C2”) carbon atoms are labeled in black together with the nitrogen (N’ and N”) and the carbon (C3 and C3’) atoms of the two cyano groups. ... 124 Figure 6.3: Frontier molecular orbitals of DPAP: HOMO a) and LUMO b). An isosurface value of 0.02 a.u. has been used. ... 125 Figure 6.4: Potential energy curve of dihedral angle 1 (panel a)) and 2/3 (panel b)). QM data, black points; MM data, continuous lines. ... 127
16 Figure 6.5: Radial distribution functions between DPAP and acetonitrile (blue), cyclohexane (green) and o-xylene (magenta) center of mass. ... 129 Figure 6.6: Dihedral distribution function of the three dihedral angles in acetonitrile: in solid red line dihedral angle 1, in blue dashed line dihedral angle 2 and in solid green line dihedral angle 3. ... 130 Figure 6.7: Time dependent dihedral distribution function for dihedral angle 1 for the first 5 ns of simulation in acetonitrile (ACN) a), cyclohexane b), o-xylene c). ... 131 Figure 6.8: Time dependent dihedral angle distribution function in acetonitrile (in red results for dihedral angle 1, in blue for dihedral angle 2 and in green for dihedral angle 3). The first 5 ns of simulation are reported. .. 132 Figure 6.9: Distribution of the emission wavelengths computed for 200 DPAP geometries extracted from the MD trajectories in cyclohexane a), o-xylene b) and acetonitrile c). The solid lines represent the fitting to a Gaussian curve. For sake of clarity a different number of bins have been used in the three panels. ... 135 Figure 6.10: Conformational dependence of the fluorescence wavelength computed in acetoni- trile. a) Energy profile of dihedral angle 1. b) Relation between DPAP emission energy and dihedral angle 1 amplitude. c) Dihedral 1 distribution for the selected conformations taken from the MD trajectory and used for fluorescence wavelength calculation. ... 136 Figure 6.11: ph-FLIM of multilamellar vesicles characterized by homogeneous lipid phases. a) Fluorescence image of a multilamellar vesicle characterized by homogeneous Lo phase. b) Fluorescence image of a multilamellar vesicle characterized by homogeneous Ld phase. c) Phasor plot relevant to vesicles a) and b): the segment connecting the averages of the two reference phasor clouds is depicted in red. ... 137 Figure 6.12: Deuterium order parameter for a) DOPC and b) DPPC lipid, the lipid nomenclature is indicated inside the inset of the graph. The first order parameter corresponds to the first CH2 group of the acyl chain
(position 2). ... 138 Figure 6.13: Correlation between DPAP rotational correlation time (ps) and experimental fluorescence lifetimes (ns) in the considered environments. ... 141 Figure 6.14: DPAP atom labelling. ... 143 Figure 7.1: Transduction of Tat11 peptide, originating from spatially restricted zones (NZs) on the plasma
membrane (white arrows). Time-lapse confocal microscopy at room temperature (with frames recorded every 30 seconds) for a free serum growth medium 15 µM solution of Tat11-TAMRA administered to CHO-K1 cells. Five
frames recorded at 1, 2, 3, 5 and 10 min are shown; transmitted-light channel recorded at 10 min is shown in the last frame. Scale bars: 10 µm. ... 154 Figure 7.2: Chemical structure of TAMRA dye covalently linked to the Tat11 peptide. ... 157
Figure 7.3: Representative initial configurations of a) Tat11 and b) Tat11-TAMRA dimer peptides as embedded
into a DOPC membrane pore. Peptide backbone is depicted in vdW representation, O atoms in red and N atoms in blue. Lipid chains are depicted in gray, phosphate groups in yellow. c) Top and d) side views of an equilibrated molecular configuration of the membrane pore. Lipid chains are depicted in gray, phosphate groups in yellow and lipid head groups shaping the pore in blue. ... 161
17 Figure 7.4: Snapshot configurations issuing from a) Tat11 and c) Tat11-TAMRA MD simulations taken at different
time intervals. Peptides are depicted in red with TAMRA dye in green. (b-d) Corresponding translocation distance of monomer center of mass along the longitudinal pore axis (i.e., Z-coordinate). ... 164 Figure 7.5: (a,c) Snapshot configurations issuing from Tat11 replica simulations taken at different time intervals.
Peptides are depicted in red. (b,d) Corresponding translocation distance of monomer center of mass along the longitudinal pore axis (i.e., Z-coordinate). ... 165 Figure 7.6: (a,c) Snapshot configurations issuing from Tat11-TAMRA replica simulations taken at different time
intervals. Peptides are depicted in red with TAMRA dye in green. (b,d) Corresponding translocation distance of monomer center of mass along the longitudinal pore axis (i.e., Z-coordinate). ... 166 Figure 7.7: a) Snapshot configurations issuing from Tat11-TAMRA dimer MD simulation taken at different time
intervals. Peptides are depicted in red with TAMRA dye in green. b) Corresponding translocation distance of dimer center of mass along the longitudinal pore axis (i.e., Z-coordinate). ... 167 Figure 7.8: (a,c) Snapshot configurations issuing from Tat11-TAMRA dimer replica simulations taken at different
time intervals. Peptides are depicted in red with TAMRA dye in green. (b,d) Corresponding translocation distance of dimer center of mass along the longitudinal pore axis (i.e., Z-coordinate). ... 168 Figure 7.9: Initial (top) and final (after 40 ns, bottom) configurations issuing from Tat11-TAMRA a) monomer and
b) dimer SMD simulations. Peptide are depicted in red with TAMRA dye in green. Red arrow shows the direction of applied pulling force along the longitudinal pore axis (i.e., Z-coordinate). ... 169 Figure 7.10: Average pulling force applied to gently move the Tat11-TAMRA peptide (both monomeric and dimeric
forms) out of the membrane pore as a function of distance from the lipid bilayer center. The resulting force profile is evaluated as the average of four SMD simulations for each system under consideration. Peptide (yellow) at various distances from pore center is depicted in the insets, with lipid head groups in blue. Standard error is 25 pN. ... 170 Figure 7.11: Role of Tat peptide self-aggregation to direct transduction in cells is highlighted in a computational study of dimer versus monomer. ... 173 Figure 8.1: Top and side views of the open conformation of the transmembrane domain of wild-type Kv4.3 in its tetrameric (top panels) and monomeric (bottom panels) forms. The location of VSDs (residues 182-307), PD (residues 321-402) and SF (residues 367-372) are indicated by arrows. The sites of the single point mutation in residue M373 skyblue licorice representations, respectively. S4, S4-S5 linker, S5 and S6 helices are shown in red, blue and green, respectively. Crystallographic K+ ions are shown in magenta space filling representation. All
remaining residues are shown in white. ... 177 Figure 8.2: (a) Sequence alignment of the transmembrane PD (residues 321-402) of human wild-type Kv4.3 with Kv1.2 PD from Rattus norvegicus shows high sequence similarity. (b) Sequence alignment of the transmembrane PD domains (residues 359-411) of human wild-type Kv4.3 with different Kvchannels from Homo sapiens. The SF domain of Kv4.3 exhibits high sequence similarity with all human Kv channels, indicating that this region of the protein is highly conserved. ... 181 Figure 8.3: Average pore radius along the channel axial position (z-coordinate) for human WT, M373I and M373E Kv4.3 TMDs embedded in a POPC lipid bilayer and simulated with an applied voltage of 1 V. The S6
18 gating helices become increasingly constricted in mutated forms of Kv4.3 as it can be seen from the structural alignment of PDs for WT (red), M373I (blue) and M373E (cyan). ... 182 Figure 8.4: Water coordination number and distribution of K+ ions of human WT and M373E Kv4.3 TMDs
embedded in a POPC lipid bilayer and simulated with an applied voltage of 1 V at 310.15 K for 1 μs. The SF of WT Kv4.3 TMD is shown in silver with highlighted carbonyl groups and T367 sidechains in licorice representation. Water molecules and permeating K+ ions (green) are shown in space filling representation. The
different binding sites inside the SF are separated by dashed lines. The analysis was performed over the whole trajectory. ... 184 Figure 8.5: Contact maps of a region of the transmembrane PD domain in close proximity of the SF (residues 350-375) of human WT, M373E and M373I Kv4.3 TMDs embedded in a POPC lipid bilayer and simulated with an applied voltage of 1 V at 310.15 K for 350 ns. ... 184 Figure 8.6: Number of contacts residue 373 with residues 350-375 of human WT, M373E and M373I Kv4.3 TMDs embedded in a POPC lipid bilayer and simulated with an applied voltage of 1 V at 310.15 K for 710 ns. In M373I the mutated residue 373 exhibits a higher average number of contacts to residues 350-375 than in the WT and M373E model. The cutoff used for the calculation of the number of contacts was 3.0 Å. Averages and standard deviations of the number contacts for each chain are measured over the last 40% of each trajectory. ... 185 Figure 8.7: The average number of contacts of residue 373 of human WT, M373E and M373I Kv4.3 TMD with residues 350-372. The average number of contacts was measured by averaging the total number of contacts over the four chains and it was normalized dividing by the total number of frames from the whole trajectory. Top views of WT (red), M373E (cyan) and M373I (blue) SFs are shown with residues 350-363 (WT: orange and M373I: cyan). In the inset a side view of M373I SF shows the interaction of I373 with Y360. The cutoff for considering a residue in contact with residue 373 was 3.0 Å. The analysis was performed over the whole trajectory. ... 186 Figure 8.8: a) Average distances of residue 373 Cαs of human WT, M373E and M373I Kv4.3 TMDs embedded in a POPC lipid bilayer and simulated with an applied voltage of 1 V at 310.15 K for 710 ns. b-d) indicating average distance between SF of chains A, B, C and D for all three Kv models, in the M373I model the average distances d1 and d3 are shorter than those in the WT and M373E models, indicating a tighter packing of the SF in proximity of residue 373. (e,f) A top view of the SF is shown together with a CPK representation of residue 373 and the set of distances of residue 373 Cαs in WT (red) and M373I (blue) models. Cαs are shown in orange and purple for WT and M373I models, respectively. The average distances were measured over the last 40% of each trajectory. ... 187 Figure 8.9: Solvent accessible surface areas (SASAs) of (a) residues 367-373 and (b) residue 373 of human WT, M373E and M373I Kv4.3 TMD embedded in a POPC lipid bilayer and simulated with an applied voltage of 1 V at 310.15 K for 710 ns. In both WT and M373E model the SF including residue 373 show larger SASAs compared to the M373I system, whereas the SASA for residue 373 in M373E is also larger than WT model indicating that the presence of the mutation affects the overall SF hydration. Average SASAs for residues 367-373 and residue 373 with their errors estimated as standard deviations over the analyzed trajectory are reported in the right panel of the figure. The probe radius used for the calculation of SASAs was 1.4 Å. The analysis was performed over the last 40% of each trajectory. ... 188
19 Figure 8.10: RMSF of alpha carbons of human WT (RED), M373I (blue) and M373E (Cyan) Kv4.3 models calculated for VSD, PD and SF region of the Kv4.3 channel TMD. ... 189 Figure 9.1: a) Side view of the full-length atomistic model of human wild-type (WT) Kv4.3 open state in its tetrameric form showing transmembrane (TMD), intracellular (ICD) domains and KChIP1 auxiliary subunits. Black lines indicate the lipid bilayer. S4, S4-S5 linker and S5/S6 helices are shown in yellow, blue and green, respectively. Crystallographic potassium, zinc and calcium ions are shown in magenta, green and purple space filling representations, respectively. Kv4.3 TMD (residues 165-411) and Kv4.3 residues 142-164 are shown in white. KChIP1 residues are shown in skyblue. For clarity, only two of the four KChIP1 auxiliary subunits are shown. Kv4.3 T1 domain and KChIP1 auxiliary subunits are shown in red and skyblue ribbon representations, respectively. b) Top view of the WT Kv4.3 T1-KChIP1 complex with a dashed line enclosing a c) zoomed view of two Kv4.3 monomers (red and light blue) interacting with one KChIP1 auxiliary subunit (blue). First, second and third sites of interaction between Kv4.3 and KChIP1 are indicated by arrows. d) Side view of Kv4.3 T1 domain (red) showing residues involved in the W8E-P10E-A15E Kv4.3 triple mutant complex (orange). e) Top and f) side views showing sites of mutations in the first (orange) and second (Kv4.3 and KChIP1 residues are shown in magenta and cyan, respectively) interfaces. ... 194 Figure 9.2: a) Side and b) top views of a KChIP1 auxiliary subunit showing all its α-helical domains in different colors. H1 (residues 39-45) and H2 helices (residues 50-63) mainly mediate the second interface interaction among Kv4.3 residues 70-78 and KChIP1. H1, H2, H3, H4, H5, H6, H7, H8, H9, H10 are shown in cyan, celeste, skyblue, red, orange, yellow, blue, green, purple and magenta, respectively. The remaining residues are in white. Calcium ions are shown in purple spacefilling representation. ... 199 Figure 9.3: Average number of contacts of a) W8 (purple), b) F11 (green) and c) W19 (purple) residues of the WT Kv4.3 TKChIP1 complex. The cutoff used to define a contact was 3 Å. The Kv4.3 N-terminus (residues 1-20) and the KChIP1 subunit of the starting model are shown in red and transparent skyblue ribbon representations, respectively. W8, W19 and F11 amino acids are shown in purple and green licorice representations, respectively. Residues displaying the largest average number of contacts are also shown for W8 (top right, panel a), F11 (middle right, panel b) and W19 (bottom right, panel c). ... 200 Figure 9.4: a) Average interaction energy of Kv4.3 residues 8-15 with KChIP1 from 100 ns MD simulations of WT (red) and W8E-P10E-A15E (purple) Kv4.3 T1-KChIP1 complex models. Energies were computed and averaged over the whole trajectory, saved every 50 ps. Errors correspond to one standard deviation. Electrostatic potential surfaces of the Kv4.3 N-terminus (residues 3-20) of b) WT and c) W8E-P10E-A15E Kv4.3 T1-KChIP1 complex models. ... 202 Figure 9.5: a) Average interaction energy of Kv4.3 residues 8-15 with KChIP1 from 100 ns MD simulations of WT (red) and W8E-P10E-A15E (purple) Kv4.3 T1-KChIP1 complex models. Energies were computed and averaged over the whole trajectory, saved every 50 ps. Errors correspond to one standard deviation. Electrostatic potential surfaces of the Kv4.3 N-terminus (residues 3-20) of b) WT and c) W8E-P10E-A15E Kv4.3 T1-KChIP1 complex models. ... 204 Figure 9.6: Average pulling forces applied to move a single KChIP1 subunit out of a Kv4.3 T1-KChIP1 octameric complex from 100 ns SMD simulations of WT (red) and W8E-P10E-A15E (purple) Kv4.3 T1-KChIP1 complex
20 models using a constant velocity pulling of 0.25 Å·ns-1. Pulling force is reported as a function of Kv4.3-KChIP1
distance. The Kv4.3 T1 domain (red) and the pulled KChIP1 subunit (green) structures are shown as insets at different distances. The overall force profile is given as an average over two SMD simulations. Standard deviation is 35 pN. ... 205 Figure 9.7: The average number of contacts of Kv4.3 amino acid residues 70-78 with KChIP1 residues 37-61 from 100 ns AA MD simulations of Kv4.3 T1-KChIP1 complexes: a) WT (red), Y57A-K61A KChIP1 (orange) and Y57A KChIP1 (cyan); b) WT (red), E70A-F73E Kv4.3 (blue) and E70A-F73E Kv4.3 + L39E-Y57A-K61A KChIP1 (green). The number of contacts were measured and averaged over the whole trajectory. The cutoff used to define a contact was 3 Å. ... 206 Figure 9.8: a) Average number of contacts of Kv4.3 residue 73 with KChIP1 residues from MD simulations of WT (red), E70A-F73E Kv4.3 (blue), E70A-F73E Kv4.3 + L39E-Y57A-K61A KChIP1 (green), Y57A-K61A KChIP1 (orange) and Y57A KChIP1 (cyan) Kv4.3 T1-KChIP1 complexes. b) Average number of contacts of KChIP1 residue 57 with Kv4.3 residues from MD simulations of WT and mutated Kv4.3 T1-KChIP1 complex models. The cutoff used to define a contact was 3 Å. ... 209 Figure 9.9: Salt bridges of the second interface formed between Kv4.3 (green) and KChIP1 (blue) amino acid residues from MD simulations of WT, E70A-F73E Kv4.3, E70A-F73E Kv4.3 + L39E-K61A KChIP1, Y57A-K61A KChIP1, and Y57A KChIP1 Kv4.3 T1-KChIP1 complexes displayed on the 100 ns structure. The cutoff used to define a salt bridge was 5 Å. Kv4.3 monomers (omitting residues 3-40) and KChIP1 subunits of each model are shown with the same color code of Fig. 1. Salt bridges are shown in yellow connecting alpha carbons of Kv4.3 and KChIP1 residues. The percentage of persistence of salt bridges of the WT Kv4.3 T1-KChIP1 complex are reported in the top, right table (see also Table 9.1). ... 210 Figure 9.10: a) Solvent accessible surface areas (SASAs) of residues interacting in the second interface, namely Kv4.3 residues E70, F73, F74 and D78 and KChIP1 residues M37-E40, L42, K50, R51, L53, Q54, Y57, R58, K61 and F108, from 100 ns AA MD simulations of WT (red, 892 ± 33 Å2), Y57A-K61A KChIP1 (orange, 853 ± 30 Å2),
Y57A KChIP1 (cyan, 880 ± 40 Å2), E70A-F73E Kv4.3 (blue, 1018 ± 31 Å2) and E70A-F73E Kv4.3 +
L39E-Y57A-K61A KChIP1 (green, 1235 ± 45 Å2), Kv4.3 T1-KChIP1 complexes. Mutations in the second interface side of
Kv4.3 induce an increase in the SASA as compared to WT, KChIP1 mutants and Kv4.3 triple mutant systems. All SASAs were computed over the last 40% of each trajectory, saved every 50 ps. The errors are reported as standard deviations. b) Side and c) top views of residues interacting in the second interface. The same color code of Fig. S1 is used for helices of the KChIP1 subunit. The region of the Kv4.3 T1 domain interacting with H2 helix of KChIP1 is shown in yellow. ... 212 Figure 9.11: a) Top view of the structural alignment of starting and 100 ns structures of the E70A-F73E Kv4.3-L39E-Y57A-K61A KChIP1 Kv4.3 T1-KChIP1 complex. The starting structure is shown with the same color code of Fig. 1 except for KChIP1 auxiliary subunits, which are shown in blue. In the 100 ns structure, Kv4.3 T1 domain and KChIP1 auxiliary subunits are shown in orange and celestial blue ribbon representations, respectively. Cysteine and histidine amino acid residues involved in the Zn2+ ion (silver) binding site are highlighted in lime
21 subunit are enclosed with a dashed line and a b) zoomed view of them highlights the loss of second interface interactions, as confirmed by the large average Cα atoms RMSD of KChIP1 auxiliary subunits. ... 214
Figure 9.12: a) Average interaction energy of Kv4.3 amino acid residues 70-78 with KChIP1 residues 37-61 from MD simulations of WT (red), Y57A-K61A KChIP1 (orange), Y57A KChIP1 (cyan), E70A-F73E Kv4.3 (blue) and E70A-F73E Kv4.3 + L39E-Y57A-K61A KChIP1 (green) complex models. All energies were computed and averaged over the whole trajectory, saved every 50 ps. The errors are reported as standard deviations. b) Average pulling forces applied to move a single KChIP1 subunit out of a Kv4.3 T1-KChIP1 complex from 100 ns SMD simulations of WT (red), E70A-F73E Kv4.3 (blue) and Y57A-K61A KChIP1 (orange) complex models using a constant velocity pulling of 0.1 Å·ns-1. Pulling forces are reported as a function of the Kv4.3-KChIP1 distance.
Kv4.3 T1 domain (red) and the pulled KChIP1 subunit (green) are shown in the insets at different distances. The overall force profile is given as an average over two SMD simulations. Standard deviation is 25 pN. ... 216 Figure 9.13: Salt bridges of the third interface formed between Kv4.3 (red) and KChIP1 (blue) residues from MD simulations of WT, E70A-F73E Kv4.3, E70A-F73E Kv4.3 + L39E-Y57A-K61A KChIP1, Y57A-K61A KChIP1, and Y57A KChIP1 complex models. The cutoff used to define a salt bridge was 5 Å. Salt bridges are shown as yellow bond connecting Kv4.3 and KChIP1 residues. The percentage of persistence of the salt bridges of the WT Kv4.3 T1-KChIP1 complex are reported in the top, right table (see also Table 9.2). ... 219
22
List of Tables
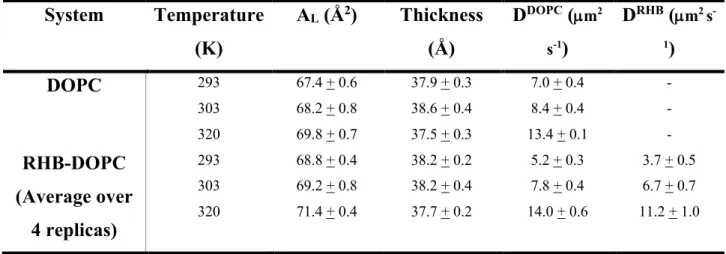
Table 4.1: List of atoms of the RHB lipid model reporting atom types and atomic charges. ... 59 Table 4.2: Structural and dynamical properties of the DOPC and RHB-DOPC bilayer systems as issuing from corresponding MD simulations. ... 70 Table 4.3: FCS measurements of RHB and LAURDAN, diffusion coefficients (D) and G0 ... 75 Table 5.1: Structural and dynamical properties of DOPC and RHB-DOPC lipid bilayers from AA MD simulations at three different temperatures. ... 94 Table 5.2: Average tilt angles of horizontal and vertical axes of RHB fluorescent polar headgroups from AA MD simulations of RHB-DOPC lipid bilayers at three different temperatures. ... 113 Table 6.1: Comparison between ground state (GS) and electronically excited state (EES) DPAP geometry optimized. Atom labeling in Figure 6.2. ... 125 Table 6.2: Dynamic properties of DPAP in solvents. ... 132 Table 6.3: Experimental and theoretical maximum emission peak wavelength (nm) and Stokes shift of DPAP in different environments. In parenthesis the dielectric constant of the solvent. Stoke shift values are computed by considering the absorption peak wavelength determined in our previous work. 58 For DOPC bilayer no experimental
counterpart is available. ... 133 Table 6.4: Dynamic properties of DPAP in DOPC and DPPC:CHOL bilayers. Errors are in brackets. ... 139 Table 6.5: Comparison between GS and EES atom charges (e) of DPAP in acetonitrile. For atom labeling see Figure 6.14 ... 143 Table 6.6: DPAP force field non-bonded parameters for atom labelling see Figure 6.14 ... 145 Table 6.7: DPAP force field stretching parameters for atom labeling see Figure 6.14 ... 146 Table 6.8: DPAP force field bending parameters. ... 147 Table 6.9: DPAP force field stiff torsional parameters. ... 150 Table 6.10: DPAP force field improper dihedral angles parameters. ... 152 Table 6.11: DPAP force field flexible torsional parameters. ... 153 Table 7.1: List of atoms of TAMRA model reporting atom type and atomic charge (i.e., standard CHARMM format is adopted). ... 158 Table 7.2: Molecular dynamics simulation details. ... 160 Table 7.3: Interaction energy and H-bond analysis of Tat11 and Tat11-TAMRA peptides with DOPC ... 163
Table 8.1: Number of permeation events and conductance of K+ ions for WT, M373I and M373E Kv4.3 estimated
from MD simulations and electrophysiological measurements at single-channel level. ... 183 Table 9.1: Salt bridges of the second interface from MD simulations of WT and mutated Kv4.3 T1-KChIP1 complexes. ... 208 Table 9.2: Salt bridges of the third interface from MD simulations of WT and mutated Kv4.3 T1-KChIP1 complexes. ... 218
25
Chapter 1 Introduction
Plasma membranes not only provide the necessary compartmentalization to protect living cells, but also are directly involved in a variety of vital cellular processes such as signaling, transport of biomaterial, cell adhesion and cell communication. For their multiple biological roles, plasma membranes do require a high degree of plasticity to modulate the perception and transduction of extracellular and intracellular signals. Dynamic lateral assembly of protein complexes combined with an independent compositional lipid patterning in both membrane leaflets provide cells the opportunity to decorate this interface with specific molecules in an organized but dynamic manner. For such reasons, in recent years a great effort has been directed towards the understanding, at molecular level, of lipid diffusion, self-organization, phase change, raft formation, and so on. In my PhD thesis, I am presenting different computational approaches based on molecular dynamics (MD) techniques, which have been fruitfully used as complementary tools with respect to experimental methodologies to shed light onto some relevant phenomena and processes occurring within the lipid bilayers. Briefly, the topics covered in my research work include the study of lipid lateral diffusion and membrane permeability, the study of the role of self-aggregation in promoting cell-penetrating peptides translocation across a lipid membrane (Tat11 peptide, either or not covalently-linked to a common fluorescent dye), the dynamic and photophysical properties of a molecular rotor used to probe lipid order in lipid bilayers of different composition, and the detailed mechanisms through which single point mutations affect the gating and ion translocation in a voltage-gated potassium channel (Kv4.3) and also how the mutations inside the Kv4.3-KChIP1 complex affect the overall structural stability of the ion channel.
The biological membranes and their diverse constituents play key roles in cellular physiology and there has been a significant progress in experimental techniques over the last few decades to study lipid bilayers and their structures. Yet, lipid membranes, due to their complexity, continue to pose major challenges to experimental techniques, whereas computational modeling methods, specifically molecular dynamics simulations, have been utilized quite
26 effectively to fill the gap in the structural and dynamical description of biological membranes, not readily accessible to standard experimental methodologies. Moreover, the work presented in this thesis illustrates in some detail the molecular structures, dynamics and mechanisms characterizing molecules like fluorophores, molecular rotors, carrier peptides and ion channels when embedded inside biological membranes. This work also highlights the possible role and effect that such molecules could have on the physical and chemical properties of the biological membranes. In all studies included in this thesis, results helped to gain new and relevant insights into subtle features of lipid membranes and of protein channel behavior. To better interpret and support our findings from molecular dynamics simulations, parallel experimental investigations were carried out by external collaborators. These studies were conceived towards a more accurate prediction of structural and dynamical properties of biological membranes. In addition, the choice of probes described in this work could also be applied to other biological membrane systems and could help in predicting correct dynamics as well as structural properties of more general lipid membranes and plasma membranes. This thesis comprises also a detailed study of a voltage-gated potassium channel (Kv), along with a mutation that could cause channelopathies and its interaction with an important auxiliary protein. The work on the channel mutation affecting the gating mechanism and the functioning of the ion channel could serve as an illustrative application for researchers interested in analyzing various other mutations in similar ion channels. Overall, the work presented here has also implication in fluorophore designing, transport of drugs to its target and to understand the role of certain amino acids in the normal functioning of ion channels. This in turn could lead to cure various disorders associated specifically with the ion channels. All the above-mentioned phenomena are discussed and described in separate chapters of this thesis, where a short summary of each chapter is sketched below.
In chapter 2 and 3 of this thesis, the basic biological background and the description of the computational methodology which has been used throughout the present research work is reported. Chapter 4 and 5 discusses the role of dye-labelled lipids as molecular probes for lipid diffusion studies. When molecular probes are used, two major points of concern arises: 1) the incomplete understanding of the probe behavior inside the lipid bilayers and the perturbation of the latter resulting from probe incorporation 2) Another concern is the dye concentration and how it could affect the lipid bilayers. In this study, for the first time the effect of self-aggregation of Rhodamine labeled lipid was studied in comparison to non-labeled lipids. To
27 study this effect, molecular dynamics simulations represent a valuable way to characterize the location and dynamics of bilayer-inserted membrane probes, by providing a detailed atomic-scale information. As well, the magnitude of the induced perturbation on the host lipid structure can be effectively investigated, in fact several important classes of reporter molecules have been studied in recent years. It has been now widely recognized that our understanding of complex biological processes, such as protein folding, ion transport through bio-channels and molecular recognition, can greatly benefit from the use of computer simulations in conjunction with conventional laboratory techniques. The aim of the present studies, as detailed in these chapters, is to use state-of-the-art computational tools to shed light on lipid dynamics and to support experimental evidence issuing from advanced fluorescence microscopy techniques. Given the high number of experimental systems and imaging approaches used, it is now difficult to rationalize all collected results into a unified picture of membrane heterogeneity regulation. In particular, experimental results inevitably suffer from the effect of the fluorophore used for lipid/protein labeling. Moreover, the bias introduced by the optical probes is not easily predictable and biological conclusions must be carefully interpreted in light of possible perturbative effects by the probes. Molecular dynamics simulations offer a unique opportunity to quantitatively investigate the effect of lipid labeling through fluorescent probes of different size and physico-chemical characteristics. While several computational studies have recently investigated dynamical properties of lipids in homogeneous and heterogeneous model bilayer membranes, the plan in the current study was to assess the optimal computational methodology (ensemble conditions, force fields, mechanical stress) for studying diffusion and self-organization processes. Moreover, the use of appropriate kinetic models helped to establish diffusion laws that hold well beyond the time limit of the computer simulations. Then, the dependence of dynamical properties on temperature and composition, a somewhat overlooked yet important physical condition, were studied to gather significant information transferable to more realistic vesicles and plasma membranes. In this thesis, a large effort has been put to assess the influence of the fluorophore probes on the lipid dynamics and clustering properties. The hydrodynamic effect of a Rhodamine-labeled lipid along with its ability to self-aggregate at different concentration levels was scrutinized and compared to the experimentally observed dynamics of the modified and labeled systems with respect to the natural counterparts.
28 Fluorescent molecular rotors (FMRs) are discussed in chapter 6. They are an important class of environment sensitive dyes which have application in analytical, environmental, optical and biochemical areas. Their wide application in different areas is due to their ability to permeate cell membrane easily because of their smaller size and to sense environment dependent processes at intracellular level. All these features of FMRs make them a subject of extensive research. In the study reported here, MD simulations and florescence lifetime imaging microscopy (FLIM) were combined to study the application of 4-(diphenylamino) phthalonitrile (DPAP), a recently synthesized FMR, as a probe for detecting the local order within lipid bilayers. In this work, a force field development was tailored towards DPAP potential energy surface and corresponding gradient in the first excited state as evaluated from quantum mechanical calculations at time-dependent DFT level. The sampling of the first electronically excited state (EES) potential energy surface allowed us to effectively simulate excited state properties of DPAP embedded in several solvents (i.e., acetonitrile, cyclohexane and o-xylene) and lipid bilayers, and to finally model fluorescence wavelengths on hundreds of snapshots issuing from the computed classical MD trajectories at a reasonable computational cost. However, in this particular study the molecular rotor (DPAP) in its excited state inserted inside multiple environments demonstrated its ability to perfectly sense both viscosity and polarity of the local environments. This ability of DPAP is because of its propeller like geometry, which favors the barrier free flexible configurations inside those environments. The study highlights the structural and dynamical effects of the DPAP on the different environments and its interactions within those environments and also how suitable is this molecular rotor in using as a probe for detecting subtle changes in lipid membranes.
In chapter 7, a study on a prototype of cell penetrating peptides (CPPs) is reported. CPPs are an important class of peptides which helps in facilitating the cellular uptake/intake of various types of molecular cargos and their ability to penetrate the cells make them an effective drug delivery vector. Tat11 is an arginine rich peptide from HIV-1 Tat protein which is a prototype for cationic CPPs and it was utilized for the study outlined in this thesis. It has been widely accepted now that for CPPs translocation through cell, the concentration of the peptide plays a significant role. Within nanomolar to low micromolar range the CPP takes an endocytic pathway, whereas when the concentration of the peptide goes above 10 µm, it takes spontaneous transduction through the plasma membrane as a pathway to release the attached cargo into the cytoplasm of the cell. The hypothesis outlined in this study was that Tat11 peptide