buildings
ISSN 2075-5309 www.mdpi.com/journal/buildings/ Article
The Use of Sound Absorbing Shading Systems for the
Attenuation of Noise on Building Façades.
An Experimental Investigation
Nicolò Zuccherini Martello 1,†,*, Patrizio Fausti 1,†, Andrea Santoni 1,† and Simone Secchi 2,†
1 Engineering Department, University of Ferrara, via Saragat, 1, I-44122 Ferrara, Italy;
E-Mails: [email protected] (P.F.); [email protected] (A.S.)
2 Industrial Engineering Department, University of Florence, via di Santa Marta, 3, I-50139 Florence,
Italy; E-Mail: [email protected]
† These authors contributed equally to this work.
* Author to whom correspondence should be addressed; E-Mail: [email protected]; Tel.: +39-0532-974879 (ext. +39-340-9064505).
Academic Editor: Umberto Berardi
Received: 29 October 2015 / Accepted: 3 December 2015 / Published: 7 December 2015
Abstract: The problem of solar irradiation in building façades with large windows is often solved with the use of external shading devices, such as brise-soleil systems, but their potential acoustic effects on building façades are usually neglected. The purpose of this work is a preliminary consideration of the acoustic behaviour of brise-soleil systems and, furthermore, the evaluation of the possibility to improve their performances, in terms of Sound Pressure Level (SPL) abatement over glass surfaces. The paper reports the results of a study on two portions of the same office building, with shading devices installed in front of large windows. Both airborne sound insulation measurements and SPL measurements over the glass surfaces of the windows were carried out to compare different situations, with or without louvers, and with sound absorbing experimental louvers as well. Results show that the louvers' presence can produce an increase in the SPL over the glass surface as a consequence of the reflection of the sound. Results further show that sound absorbing louvers improve the noise protection of the system, in terms of the SPL reduction, over glass surfaces, cancelling out the negative effect of the standard shading devices.
1. Introduction
Buildings are often erected very close to noisy roads or to railway tracks, which are a nuisance to inhabitants. Façade sound insulation can be improved either by using high-performance building elements or, with smart design, with self-protection from noise, achieved by the building shape itself.
In previous works, the possibility to improve noise protection through the façade shape was investigated. Simple prediction models compared with scale model measurements were used to estimate the noise protection provided by a single balcony [1] and a balcony array [2]. Other authors investigated SPL reduction over building façades with balconies modified in shape and materials; simulations, scale model measurements [3–6] and in situ tests were also conducted [7].
Regulation in Italy, as well as in many other countries, imposes a reduction of solar irradiation over the glazed surface of buildings in order to reduce energy consumption due to summer air-conditioning. In fact, when very large windows or curtain walls are used in buildings, there could be problems in terms of high solar irradiation and sound insulation. Brise-soleil systems are often used both to reduce solar irradiation during the summer period and to reduce glare effects [8].
This work is a starting point of a new research study on the possibility of using the external shading devices as noise barriers, of obtaining a higher sound insulation performance of the façade, or of enhancing the comfort of the external parts of the buildings (balconies etc.) if protected by shading devices.
The acoustic effects of external shading systems, in terms of façade sound insulation, are often neglected. Some recent works were carried out on the noise protection given by curtains over windows [9] and by rolling shutters [10].
Numerical simulations were performed to study the noise shielding effect of louvers [10–12]. The results showed that brise-soleils can offer noise protection, which increases with the building height. On lower floors, SPL over the façade can instead be increased by sound waves reflected by the louvers.
The present work is based on preliminary field measurements to test the possibility of reducing SPL over the building façade using sound absorbing shading louvers. The idea comes from acoustic louvers [13] generally used to silence machinery. A thin layer of sound absorbing material was placed on metal lightweight louvers that are installed over the windows of an office building. The sound absorbing material under each louver intercepts sound waves coming from a noisy source, generally located at street level (roads or railways), and this modified system could globally reduce SPL over the façade if compared to the performance of the standard louvers. The system was tested with 0° and −30° tilt angles, these being the typical inclinations to intercept sunlight and maintain a satisfactory view of the exterior. Over the window surfaces, both SPL measurements and façade sound insulation measurements [14] were carried out to investigate the opportunity of combining the shading effect and the noise reduction properties in the louvers system. Some of the obtained results have been published in the proceedings of the 22nd International Congress on Sound and Vibration [15].
2. Case Study Description and Measurement Set up
Measurements were carried out on a four-story office building. The façade presents large windows (1 × 3 m2) that are shaded by lightweight metal louvers, manually adjustable in tilt angle and with the
façade, respectively located on the ground and third floor, were studied to evaluate acoustic performance as a function of the incidence angle of the generated sound.
Figure 1. (a) Building view; (b) Shading louvers installed over a window. 2.1. Measurements Configuration
2.1.1. The Sound Absorbing Material Used to Modify the Louvers
The material used to modify the sound absorption properties of louvers is a polyurethane conglomerate, with a polyethylene film on the backside. The chosen material is 7 mm thick and has a density ρ = 70 kg/m3.
The sound absorption coefficient was measured in the impedance tube [16]. To obtain data from 250 Hz to as high as 4000 Hz, two different diameters were used, 45 mm and 100 mm, respectively. Results are shown in Figure 2. This material does not have good sound absorbing properties (Figure 2), but it was chosen because it has a suitable weight and thickness that can be easily applied to the metal louvers.
Figure 2. (a) Normal-incidence sound absorption coefficient measurements result for 70 kg/m3, 7 mm thick, polyurethane conglomerate; (b) Some samples of the tested material.
2.1.2. The Windows Louvers
The shading louvers studied were simple thin metal lamellae, 1 mm thick, 90 mm wide, and 3 m long (Figure 1). Louvers were studied in different configurations. A first set of measurements was carried out
without any louver over the glazed surface (Figure 3a) to determine the reference situation (configuration A). Subsequently, measurements were made with louvers, with and without sound absorbing material added to the bottom sides of each lamella, with 0° and −30° tilt angles (configurations from B1 to C2 in Figure 3).
Figure 3. Different louver configurations. (a) A: window without louvers; (b) B1: window with 0° tilt standard louvers; (c) B2: window with −30° tilt standard louvers; (d) C1: window with 0° tilt louvers with sound absorbing material; (e) C2: window with −30° tilt louvers with sound absorbing material. Main directions of sound waves are highlighted for ground and third floors (see further Section 2.1.3). Dimensions are in cm.
2.1.3. Measurement Source Positions
The measurement was carried out using a directional sound source, placed over the ground generating a pink noise. Various source positions were used to evaluate different source-receiver combinations.
Positions S1 (Figure 4) were mainly used to evaluate façade sound insulation, since ISO 140-5 [14] requires that the direction of incident sound forms an angle of 45° with the perpendicular to the façade. Positions S2 (Figure 4) were instead used to study the system’s efficiency, comparing the difference in terms of average SPLs measured over the glass with microphones.
Table 1 summarises the distances between the source positions and the geometric barycentre of the windows, both for the ground and the third floor. Figure 4 represents a schematic view of the various Source-Receiver combinations.
Table 1. Distances between the source positions (S1 and S2) and the geometric barycentre of windows.
Windows Floor S1 S2
Ground floor 7.1 m 5.7 m
Figure 4. Scheme of source positions. (a) Source positions used on ground floor; (b) Source positions used on third floor. The “_S1” positions were mainly used for the D2m,nT
measurements, while the “_S2” positions were used to better evaluate the sound reduction provided by the shading system over the glazed surface. Both S1 and S2 positions were placed on the ground.
3. Measurement Results
Measurements of Sound Pressure Levels (SPL) over the glazed surface and façade sound insulation measurements [14] were carried out for all the different configurations, from “A” to “C2” (Figure 3), as described in the previous Section 2.1.2, for a window on the ground floor and another one on the third floor.
In the following sections the detailed results are shown with reference to both the difference of Sound Pressure Levels on window surfaces and to the façade sound insulation.
3.1. Measurements of Sound Pressure Level (SPL) on Window Surfaces
SPL over the glazed surface was measured with six free-field ½" microphones (equipped with wind screens) randomly placed over the glazed exterior surface on the ground floor and with seven microphones on the third floor (Figure 5).
Figure 5. Microphone positions over the external side of the glazed surfaces on the ground floor (a) and third floor (b).
Measurements were carried out for all situations described in Section 2.1.2 and repeated on the ground and third floors, with source position both in S1 and S2.
The different performances of the louvers were compared in terms of sound pressure level difference, ΔSPL. This quantity represents the difference between the sound pressure levels, measured in the different
configurations A, B1, B2, C1 and C2. 3.1.1. Single Microphone SPL Comparison
The microphones were randomly placed over the window glass, with special attention paid to their mutual positions with the louvers.
The SPLs measured at each microphone position are quite different because of both the diffraction effect created by the louvers and the proximity of the microphone to the glass. For this reason, it is difficult to do a comparison of the system performance referring to the mutual position of the microphones and louvers. Therefore, it was evaluated whether the microphone position (behind a single louver or between two louvers) could have a significant effect on the SPL. Figure 5 shows the positions of each microphone over the external side of the windows on the ground (Figure 5a) and third (Figure 5b) floor. The window, the louvers and the room typology of the ground and the third floor were the same.
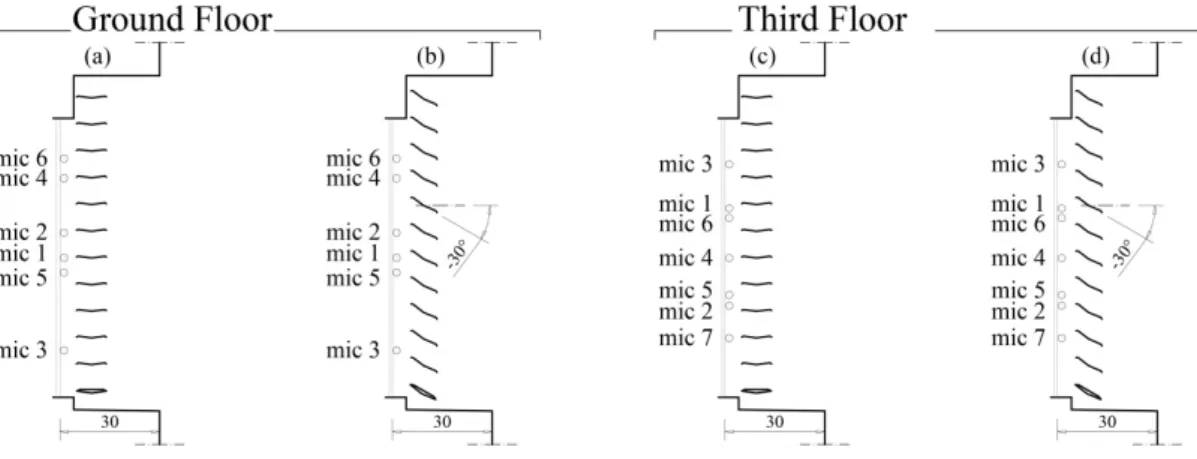
Table 2 identifies each microphone position over the two studied windows with respect to the louvers. Microphones are placed behind a single louver (B) or in the middle of two louvers (M). In Figure 6, the positions of the microphones are shown in sections.
Table 2. Table of the mutual position between microphones and louvers.
Floor Louvers
Tilt Angle Mic 1 Mic 2 Mic 3 Mic 4 Mic 5 Mic 6 Mic 7
Ground Floor Un-tilted B B M B M M –
−30° tilt M M B M B B –
Third Floor Un-tilted M B M B M M B
−30° tilt B M B M B B M
Figure 6. Scheme of the mutual microphone positions and the tilt angle of the louvers. (a,b) represent the ground floor configuration with un-tilted louvers and with a tilt angle of −30°, respectively; (c,d) represent the third floor configuration with un-tilted louvers and with a tilt angle of −30°, respectively.
As shown in Figure 7, there is not a clear correlation between the microphone positions and the ΔSPL
calculations. This confirms that the effect of the louvers on the sound propagation is not systematically dependent on the microphone position.
Figure 7. Arithmetic differences of the SPLs measured by each microphone placed over the glass on the third floor. (a) ΔSPL = ASPL − B1SPL; (b) ΔSPL = ASPL − C1SPL;
(c) ΔSPL = ASPL − B2SPL; (d) ΔSPL = ASPL − C2SPL. M (solid lines) or B (dashed lines) in
brackets as in Table 2. Configurations A, B1, B2, C1, C2 are the same as in Figure 3. Source position is in S2, as it is in Figure 4.
In the following paragraph, the averaged effect is therefore analysed in terms of SPL reduction over the glazed surface due to the presence of standard or modified louvers.
3.1.2. Averaged SPL Comparison
In this section, the evaluation of the differences between the SPLs, averaged over all the microphone positions placed on the external side of the windows, measured in the different configurations are reported.
For the sake of completeness, calculations of SPL differences are reported both for the S1 and S2 source positions. Figures 8–13 highlight that results from calculations with S1 and S2 are comparable to each other on a case-by-case basis.
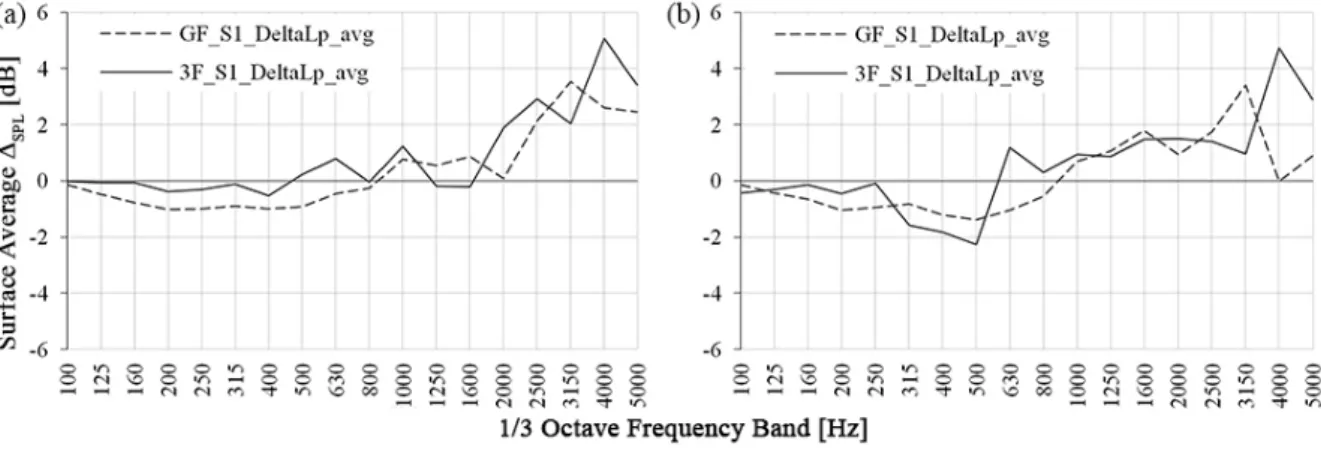
Figure 8. ΔSPL calculated between SPL on the glass surfaces of windows averaged over all
the microphone positions. Ground floor (dashed line) and third floor (solid line). Source position in S1, as it is in Figure 4. (a) ΔSPL = ASPL − B1SPL; (b) ΔSPL = ASPL − B2SPL.
Configurations A, B1, B2 are as they are in Figure 3.
Figure 9. ΔSPL calculated between SPL on the glass surfaces of windows averaged over all
the microphone positions. Ground floor (dashed line) and third floor (solid line). Source position in S2, as it is in Figure 4. (a) ΔSPL = ASPL − B1SPL; (b) ΔSPL = ASPL − B2SPL.
Figure 10. ΔSPL calculated between SPL on the glass surfaces of windows averaged over all
the microphone positions. Ground floor (dashed line) and third floor (solid line). Source position in S1, as it is in Figure 4. (a) ΔSPL = ASPL − C1SPL; (b) ΔSPL = ASPL − C2SPL.
Configurations A, C1, C2 are as they are in Figure 3.
Figure 11. ΔSPL calculated between SPL on the glass surfaces of windows averaged over all
the microphone positions. Ground floor (dashed line) and third floor (solid line). Source position in S2, as it is in Figure 4. (a) ΔSPL = ASPL − C1SPL; (b) ΔSPL = ASPL − C2SPL.
Configurations A, C1, C2 are as they are in Figure 3.
Figure 12. ΔSPL calculated between SPL on the glass surfaces of windows averaged over all
the microphone positions. Ground floor (dashed line) and third floor (solid line). Source position in S1, as it is in Figure 4. (a) ΔSPL = B1SPL − C1SPL; (b) ΔSPL = B2SPL − C2SPL.
Figure 13. ΔSPL calculated between SPL on the glass surfaces of windows averaged over all
the microphone positions. Ground floor (dashed line) and third floor (solid line). Source position in S2, as it is in Figure 4. (a) ΔSPL = B1SPL − C1SPL; (b) ΔSPL = B2SPL − C2SPL.
Configurations B1, B2, C1, C2 are as they are in Figure 3.
Table 3 is a synthetic scheme of the evaluated differences. In Figures 8–13, it is clear that positive curves indicate an equivalent noise abatement, whereas negative values of the curves are related to an average SPL increase on the surface of the window.
Table 3. Synthesis of the evaluated differences (Δ) in the following Figures 8–13.
Δ Evaluated Situations
A-B1 B1 is evaluated against A
A-B2 B2 is evaluated against A
A-C1 C1 is evaluated against A
A-C2 C2 is evaluated against A
B1-C1 C1 is evaluated against B1
B2-C2 C2 is evaluated against B2
In the following graphs, resulting ΔSPL calculations are shown; they are derived using both S1 and S2
source positions.
Results reported in Figures 8 (source position S1) and 9 (source position S2) show that standard metal louvers are almost transparent to the generated sound field both with the source in S1 (Figure 8) and in S2 (Figure 11). In addition to a very poor protection given from un-tilted louvers, negative effects are visible when the louvers’ tilt angles are −30°.
In Figures 10 (source position S1) and 11 (source position S2), it is noticeable that when louvers are modified with sound absorbing material (Figure 2), some good effects are shown in terms of average SPL reduction over the glazed surface compared to the average SPL measured without the shading devices. Performances are obviously limited within the frequency range in which the material presents good sound absorption (Figure 2).
If a better sound absorbing material were used instead of the polyurethane conglomerate, a significant increase in performance would be expected.
Finally, the graphs of Figures 12 (source position S1) and 13 (source position S2) show the average performance differences between standard and modified louvers. Figures 12 and 13 show good
performance of the modified system compared to that of the standard one. The same limitations observed above are valid with limits in terms of frequency range system efficiency. An increase of the acoustic performance would be expected if enhanced sound absorbing louvers were used instead of the tested prototype.
As previous works [11,12] have highlighted, the noise shielding properties of acoustic louvers slightly increase on the third floor.
The tested louvers system is a prototype quite far from the real possibilities given by an acoustic design and optimisation of a brise-soleil system.
3.1.3. Global Average SPL Comparison
The global average SPL is defined as the energetic sum of every 1/3 octave frequency band of the spectrum of the average SPL measured by microphones. Global average SPL is evaluated in terms of mutual differences between the various configurations studied, as illustrated in the previous Section 3.1.2 (Table 3).
This evaluation was evaluated as having an easy efficiency rating of the situations studied (from A to C2, as in Figure 3); positive values indicate an equivalent global noise abatement, whereas negative values show that there is a noise increase over the window.
The graph in Figure 14 highlights that the modified system, in configurations B1 and B2, has better performances if compared to the system without the sound absorbing material, configurations C1 and C2. The efficacy of the absorbing louvers reaches a value of 1.5 dB in the case with the tilted louvers on the third floor. Instead, the standard louvers generate a light increase in the SPL over the windows.
Figure 14. Comparison of global average SPL differences in dB of the studied configurations A, B1, B2, C1, C2, on the ground and third floor.
In Figure 14, it is possible to observe the difference in the system performance in terms of its height from the source position (the ground level). The system performs slightly better on the third floor. This result is a confirmation of simulations made in a previous study [12].
3.2. Measurements of Façade Sound Insulation (D2m,nT)
Measurements of façade sound insulation (D2m,nT [14]) were carried out both for the façade portion
on the ground floor and for the portion on the third floor. The noise source for these measurements was placed in GF_S1 and 3F_S1, as illustrated in Figure 4.
Results are shown in Figures 15 and 16: façade sound insulation is slightly improved from the 1600 Hz frequency band when absorbing louvers are used. Standard louvers seem to have no effect on overall façade sound insulation; the curves respectively related to the windows without louvers and the windows with standard shading devices are very close to each other, with small differences that are included in the measurement uncertainty.
In terms of façade sound insulation, the sound attenuating efficiency of the shading devices is reduced due to the fact that louvers are only installed over the glazed portion of the façade studied. The window is 3 m2 against 12 m2 of the corresponding façade modulus. Moreover, the sound insulation curve
highlights problems at middle and low frequencies due to flanking sound transmissions, perhaps through the louvers box installed above the windows [10]. It is impossible to correct such a problem placing any kind of device just over the windowed part of the façade.
Figure 15. Façade sound insulation curves measured without louvers (solid lines), with standard louvers (dashed lines) and with sound absorbing louvers (dash-dotted lines). Louvers tilt angle is 0°. (a) Ground floor façade portion; (b) third floor façade portion.
Figure 16. Façade sound insulation curves measured without louvers (solid lines), with standard louvers (dashed lines) and with sound absorbing louvers (dash-dotted lines). Louvers tilt angle is −30°. (a) Ground floor façade portion; (b) third floor façade portion. 4. Conclusions
This experimental investigation demonstrates the possibility of efficiently using sound absorbing shading devices to reduce average SPL over building façades. Some issues arose when standard louvers were used: Diffracted and reflected sound fields reached the building façade and increased the average SPL over it at specific 1/3 octave frequency bands. This problem can be reduced by using sound absorbing shading devices.
SPL comparisons at each microphone position show that there is not a strong correlation between the mutual location of the louvers and the microphones. For this reason it is better to evaluate an average effect of the system, instead of a specific study of the single microphones.
Sound absorbing louvers seem to have good performances in terms of average SPL level reduction over the window surface. The system performance is clearly dependent upon the properties of the sound absorbing material, with significant effects between 1600 Hz and 5000 Hz. Absorbing louvers, however, have a better performance than the standard ones, and they reduce the problem of sound reflection over the building façade given by the standard shading devices.
The average SPL measured over glazed surfaces, when sound absorbing louvers are used, is 5 or 6 dB lower (Figures 10 and 13) at high frequencies than the average SPL measured with the standard shading system.
The global average SPL calculations confirm the aforementioned results, with a global SPL reduction over the glazed surface of up to 1.5 dB when the tilted sound absorbing louvers are compared to the tilted standard shading devices.
The evaluation of the standardised façade noise insulation is not particularly significant given such low differences in the D2m,nT curves of each situation studied. Dissimilarities are included in the range
of the measurement uncertainty. Further investigations with more performing prototypes are needed to have a clear evaluation of the effect in the façade sound insulation of the acoustic louvers.
This work shows how a good design of shading devices, in terms of shape and sound absorption properties, could give them a supplementary value and a dual function, combining sun-shading and noise reduction properties. This may be an important feature in view of the overall evaluation of the sustainability of buildings.
Author Contributions
Nicolò Zuccherini Martello, Patrizio Fausti, Andrea Santoni and Simone Secchi have equally contributed to the activities described in the article, to the achievement of the results shown and to write the text.
Conflicts of Interest
The authors declare no conflict of interest. References
1. Mohsen, E.A.; Oldham, D.J. Traffic noise reduction due to the screening effect of balconies on a building façade. Appl. Acoust. 1977, 10, 243–257.
2. Tang, S.K. Noise screening effects of balconies on a building façade. J. Acoust. Soc. Am. 2005, 118, 213–221.
3. Hossam el Dien, H.; Woloszyn, P. Prediction of the sound field into high-rise building façades due to its balcony ceiling form. Appl. Acoust. 2004, 65, 431–440.
4. Hossam el Dien, H.; Woloszyn, P. The acoustical influence of balcony depth and parapet form: Experiments and simulations. Appl. Acoust. 2005, 66, 533–551.
5. Lee, P.J.; Kim, Y.H.; Jeon, J.Y.; Song, K.D. Effects of apartment building façade and balcony design on the reduction of exterior noise. Build. Environ. 2007, 42, 3517–3528.
6. Busa, L.; Secchi, S.; Baldini, S. Effect of façade shape for the acoustic protection of buildings. Build. Acoust. 2010, 17, 317–338.
7. Ishizuka, T.; Fujiwara, K. Full-scale tests of reflective noise-reducing devices for balconies on high-rise buildings. J. Acoust. Soc. Am. 2013, 134, 185–190.
8. Jinkyun, C.; Changwoo, Y.; Yundeok, K. Viability of exterior shading devices for high-rise residential buildings: Case study for cooling energy saving and economic feasibility analysis. Energy Build. 2014, 82, 771–785.
9. Matos, J.E.; Carvalho, A.P.O. Sound Insulation Provided by Shading Screens Applied in Façades. In Proceedings of the 159th ASA Meeting and Noise-Con 2010, Baltimore, MD, USA, 19–21 April 2010. 10. Dìaz, C.; Pedrero, A. An experimental study on the effect of rolling shutters and shutter boxes on
the airborne sound insulation of windows. Appl. Acoust. 2009, 70, 369–377.
11. Otani, R.; Asakura, T.; Sakamoto, S. Numerical Analysis and Experiment on Noise Shielding Effects of Eaves/Louvers Attached on Building Façade. In Proceedings of the 38th Inter-Noise 2009, Ottawa, ON, Canada, 23–26 August 2009.
12. Fruzzetti, A.; Secchi, S.; Zuccherini Martello, N. Nuove applicazioni di elementi in laterizio fonoassorbente. Costr. Laterizio 2014, 156, 52–57.
13. Viveiros, E.B.; Gibbs, B.M.; Gerges, S.N.Y. Measurement of sound insulation of acoustic louvers by an impulse method. Appl. Acoust. 2002, 63, 1301–1313.
14. ISO 140-5:1998 Acoustics—Measurement of Sound Insulation in Buildings and of Building Elements. Field Measurements of Airborne Sound Insulation of Façade Elements and Façades; ISO: Genève, Switzerland, 1998.
15. Zuccherini Martello, N.; Fausti, P.; Santoni, A.; Secchi, S. Experimental Analysis of Sound Absorbing Shading Systems for the Acoustic Protection of Façades. In Proceedings of the 22nd International Congress on Sound and Vibration, Florence, Italy, 12–16 July 2015.
16. EN ISO 10534-2:2001 Acoustics—Determination of Sound Absorption Coefficient and Impedance in Impedances Tubes—Part 2: Transfer-function method (ISO 10534-2:1996); ISO: Brussels, Belgium, 2001.
© 2015 by the authors; licensee MDPI, Basel, Switzerland. This article is an open access article distributed under the terms and conditions of the Creative Commons Attribution license (http://creativecommons.org/licenses/by/4.0/).