DIPARTIMENTO DI SCIENZE AGRARIE, DEGLI ALIMENTI E DELL’AMBIENTE
PhD Thesis May 2016
GESTIONE DELL’INNOVAZIONE NEI SISTEMI AGRO-ALIMENTARI MEDITERRANEI (XXVIII ciclo)
ANGELA BARBUTO
Tutor: Prof. ANTONIO LOPOLITO
STRATEGIES FOR THE DIFFUSION OF SUSTAINABLE AGRICULTURAL INNOVATION: AN AGENT BASED MODEL FOR THE HORTICULTURAL
SECTOR IN PROVINCE OF FOGGIA
ACKNOWLEDGEMENTS
I would like to thank Prof. Dr. Antonio Lopolito for his great help, patience, and advice in the course of this work. He has supported me in each choice and decision with his valuable knowledge and experience.
I am very thankful to professor Gianluca Nardone for giving me the possibility to grow and to improve my educational background.
Thanks to Maurizio Prosperi for his useful tips and discussions, and to all the Economic Area of my Department for their moral support.
I want to thank my family and my friends, always ready to help me.
A special and warm thanks must go to Marco, for believing in me and in my choices, giving me the necessary encouragement.
TABLE OF CONTENTS
• Chapter 1
INTRODUCTION
1.1 Relevance of the topic………..6
1.2 Objectives ………...9
1.3 Structure of thesis ………...10
• Chapter 2 THEORETICAL BACKGROUND 2.1 The Rogers theory of innovation diffusion………...12
2.1.1. The innovation and its characteristics………13
2.1.2.The innovation diffusion process………14
2.1.3 Innovativeness and adopters categories………..15
2.1.4 Rate of adoption………..16
2.1.5 The social system: social and communication structure…………...17
2.1.6 The role of opinion leaders in a diffusion network……….21
2.2 Induced diffusion………....23
• Chapter 3 THE INNOVATION BROKER 3.1 The innovation broker’s role in the agricultural knowledge infrastructure………27
3.2 Different methods for the innovation broker to carry out effective dissemination activities………...30
• Chapter 4 DIFFERENT MODELS TO STUDY DIFFUSION OF INNOVATIONS 4.1 Introduction ………...36
4.2 Aggregate models of innovation diffusion………...….37
4.4Agent Based modeling of innovation diffusion………....41
• Chapter 5 RESEARCH AREA, DATA COLLECTION AND CASE STUDY 5.1 Description of Research Area ………...55
5.2 Data collection………...58
5.3 Case study………...60
• Chapter 6 METHODOLOGY 6.1 Model’s objective and assumptions………...66
6.2 Model description ………..68
6.3 Model calibration………. ………..70
• Chapter 7 RESULTS 7.1 Introduction ………. ………..81
7.2 The baseline simulation………..81
7.3 The Degree Centrality simulation ……….83
7.4 The Collective Influence simulation………..85
7.5 The comparison between………87
• Chapter 8 CONCLUSIONS 8.1 Conclusions ………...97
CHAPTER 1
INTRODUCTION
1. Introduction
1.1 Introduction
In the last years the volume of bio-waste has quickly been increasing, therefore the issue of bio-waste valorization has captured the attention of governments, environmental and social organizations, businesses and academics, becoming an increasingly urgent priority. The Organic Fraction of Municipal Solid Wastes (OFMSW) is humid, therefore the decomposition in the landfill generates leaching and fermentation phenomena and production of bad odors. In particular, the leachate from landfills where biodegradable waste is conferred, if not properly managed, can be a source of heavy contamination of groundwater and water bodies. In addition, the methane produced within the body of the landfill, released into the atmosphere, has a climate-changing effect because, as the carbon dioxide absorbs infrared radiation emitted from the "hot" surface of the Planet. There is an abundant literature targeting various aspects associated with waste valorization, like the improvement of bio-waste management, the conversion of bio-bio-waste to synthetic fuels (Dermibas et al.,2011); the issue of bio-waste biorefinery (Fava et al., 2015); different valorization pathways (Mirabella
et al., 2014 and Galanakis, 2012). Moreover, the ongoing researches are moving on the
usability of the organic fraction of municipal waste to produce biodegradable materials. Research carried out at the University of Torino over the last 7 years for instance, has shown that urban and agriculture wastes are source of soluble bio-based substances (SBOs) that can be used for several applications in the fields of chemical and environmental technology, material chemistry, biofuels production, agriculture and animal husbandry (Montoneri et al., 2011). The SBO were studied for their performances in detergent formulations, textile auxiliaries, fuels, plastic, photo-sensitizers, emulsifiers, forming agents, animal husbandry, nanostructured materials. Whereas they were found effective in all cases, the most promising performances were shown in agriculture, in animal husbandry, as modulators of anaerobic fermentation processes, and as reagents for the synthesis biodegradable plastics, that can be used for the production for example of mulching films. The bio plastics (Cioica et al.2008, Pei et al.2011) currently available in the market, or already in the experimental phase, are based on the content of biopolymers isolated from dedicated crop or obtained by fermentation. Most commercial products are blended materials containing synthetic polymers derived from fossil source and polymers of natural origin, the former contributing the mechanical properties and the latter the biodegradability. So far no biodegradable plastics
made with bio-based chemicals isolated from bio-wastes are known. So from this point of view SBO represent an additional opportunity for OFMSW management.
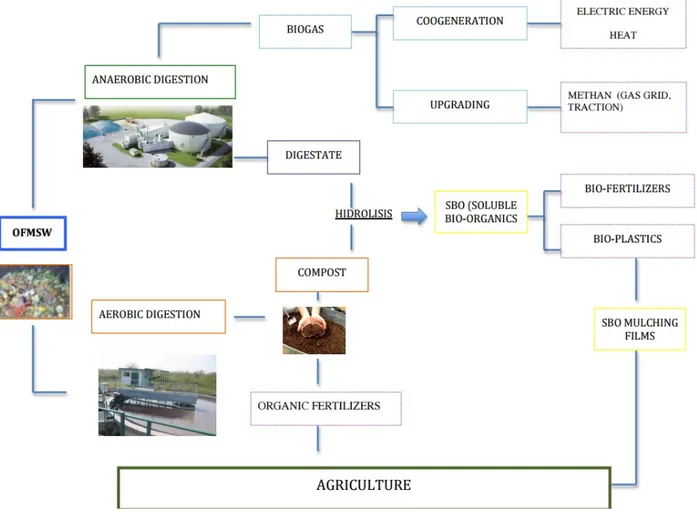
Moreover In the agricultural industry, the biodegradable mulching films containing SBO,
represents a way to improve the agricultural sustainability1 (see Figure 3.1).
Figure 3.1 SBO mulching films: an opportunity for OFMSW management and a way to improve agricultural sustainability
Source: my elaboration
As you can see from figure 3.1 the SBO are additional matherials that can be obtained from the OFMSW threatment through aerobic and anaerobic digestion, two processes that are necessary to reduce the environmental impact of OFMSW disposal and to transformate waste
1 The Food and Agricultural Organisation of the United Nations defines sustainable agriculture as the use of agricultural practices which conserve water and soil and are environmentally non-degrading, technically appropriate, economically viable and socially acceptable.
in useful products for a sustainable agriculture. In particular SBO are obteined from the compost and digestate idrolysis. The first derive from a process accelerated and controlled by the man, predominantly aerobic, that is called composting and leads to the formation of a solid fraction. Compost which is an organic fertilizer that can change and improve the chemical, physical, biological and mechanical properties of the soil with numerous environmental and agronomic benefits. Instead digestate is the result of a process accelerated and controlled by the man, mainly anaerobic, called anaerobic digestion. The digestate is a special waste which is not allowed spreading as such (because of the high salinity and the high concentration of nitrogen), then it can be used as agricultural fertilizer only after being transformed into soil amendment composted by a finishing stage aerobic made in special bio-cells or other systems of composting, mixed with wood chips or other materials used as structuring (straw, vegetable waste, etc.), after reducing the excess water. The compost thus obtained, is defined by the legislative decree 75/2010 as Mixed Composted Soil Conditioner and is able to ensure, in addition to the contribution of humified organic substance a good fertilizing effect too, and an appreciable quantity of magnesium and iron. From the digestate can be produced biogas that can be used for the production of electrical and thermal energy, by means of a cogenerator. A part of the electricity produced can be used for internal purposes; the remaining part can be sold to the grid, and the heat can be used for district heating or to feed the heating of a greenhouse that can be placed in proximity of the biogas plant. The biogas, in addition, can be further purified for the production of bio methane which could be placed in the natural gas grid or used as fuel for automobiles. In fact plastic
films for soil mulching used mainly for horticultural cultivation are disposed off through land
filling, incineration and recycling while the removal of the plastic is time consuming (about 16h/ha) and, despite the use of machines still requires hand labor. Also because of high
transportation cost and landfill tipping fees, farmers consider on-site burning to be economically more favorable (McCraw and Motes, 1991; Kasirajan and Ngouajio, 2012). This common practice produce the release of harmful substances with the associated
obviously negative consequences to the environment (Picuno et al.,1994). Therefore the
introduction in agriculture of films produced with biodegradable raw materials, such as starch (Bastioli et al. 1998; Lorcks et al., 1998), that can be disposed directly into the soil or into a composting system at the end of their lifetime represents a viable solution to this problem. Taking into account the previous discussion about bio waste valorization and the sustainable agriculture definition I will consider mulching films containing SBO a new Sustainable
Agricultural Practice (SAP) which has a dual function: 1) to broaden the spectrum of OFMSW management, and 2) to improve agricultural sustainability.
1.2 Objectives
The adoption of SAPs has a key role in improving agricultural sustainability (Reimer et al., 2012). Many studies have attempted to understand what are the factors that influence the adoption of SAPs. According to Baumgart-Getz et al., (2012), Tey and Brindal (2012), Prokopy et al., (2008), Knowler and Bradshaw (2007), and Pannell et al., (2006), adoption depends on different factors that can be divided into six dimensions: socio-economic factors; agro-ecological factors; informational factors; psychological factors; institutional factors. The socio-economic dimension includes factors like, gender, age, education levels, and some farm-specific characteristics (farm size, farming experience, access to finance etc.). The second dimension concerns variables like the practice of organic farming, duration of land used and geographical location. Very important are informational and psychological factors too, included in fourth and fifth dimensions, like usefulness of information, intention to adopt, habits and the perceived attributes. The last dimension regards institutional factors, as well as organizational membership, participation in institutional arrangements, participation in certification programs that is farm’s presence in different social networks. A social network is the pattern of friendship, advice, communication or support relationships existing among the members of a social community (Knoke and Kuklinski, 1982; Burt and Minor, 1983; Wellman, 1988). There are different works that show, each with a unique theoretical model and distinctive methodological tools, different ways in which networks influence the adoption of an innovation. Coleman and colleagues (1966) founded that some network variables are important predictors of innovativeness; according to Valente (1995) a combination of external influences from cosmopolite sources and the network interconnectedness best explain the medical doctors innovativeness in adopting a medical innovation. Tey et al., (2010) show that social networks are particularly influential on SAPs diffusion. In fact, the diffusion of an innovation, like a new SAP, is the process by which a few members of a social system initially adopt an innovation, then over time more individuals adopt until all (or most) members adopt the new idea (Ryan and Gross, 1943; Rogers, 2003). In this context, agricultural innovations diffusion could be promoted through different links between farmers. The network position of an actor affects the power and influence he can exert on its immediate neighbors and on the collective behavior of the
purpose in a marketing or policy context. Policy maker can induce diffusion choosing specific injection points (members of the network where the novelty is first inoculated) in order to boost adoption speed and adoption level (Diaz-Reiney, 2012) that is various according to the relational profile and location in the network of the injection points chosen. As a consequence, the principal question for policy makers is who are the injection points to recruit to obtain more effective diffusion results. This problem is usually faced heuristically, identifying time after time, through a try and error process, the best injection points. From these observations arises the fundamental research question of this thesis: R1) does it exist a
rational criterion for the choice of the injection points? Thus, the objective of my thesis is to
prove that there are specific network properties belonging to the actors that can be used like rational criteria for the choice of the best injection points. The hypothesis related to these criteria will be tested through an Agent Based Model (ABM) designed to simulate the social interaction mechanisms within a social network composed by different agents.
1.3 Organization of the Thesis
The rest of the work is organized as follows. Chapter 2 depicts the theoretical background of Rogers’ theory on innovation diffusion and of policy induced diffusion. Chapter 3 is devoted to introduce the innovation broker’s role in the agricultural knowledge infrastructure and to show different methods to efficiently induce diffusion. Moreover this chapter states the fundamental hypotheses of this research. Chapter 4 portrays a review of Agent Based Model for innovation diffusion. In chapter 5, I present the research area, the data collection and the case study. In chapter 6 I describe the model and the simulations setting. In chapter 7 I discuss the results of my research. Finally chapter 8 presents the conclusions of this thesis.
CHAPTER 2
2.1 The Rogers theory of innovation diffusion
Innovation diffusion research seeks to understand how new ideas, products and practices spread throughout a society over time (Rogers 2003). Diffusion research is an interdisciplinary field with roots in anthropology (Wissler 1915), sociology (Tarde 1903), geography (Hägerstrand 1967), political science (Walker 1969), economics (Griliches 1957), and marketing (Arndt 1967). In particular, diffusion of innovations is a theory that seeks to explain how, why, and at what rate new ideas and technology spread through cultures. Everett Rogers, a professor of communication studies, popularized the theory in his book Diffusion of Innovations; the book was first published in 1962, and is now in its fifth edition (2003). Rogers argues that diffusion is the process by which an innovation is communicated through certain channels over time among the participants in a social system. Therefore according to Rogers (2003) innovation is any new idea, practice or object that is intended to be beneficial for the adopter and its diffusion is: “the process by which an innovation is communicated through certain channels over time among the members of a social system”, where time is involved in the innovation-diffusion process, innovativeness, and an innovation’s rate of adoption. (figure 2.1)
Figure 2.1 The diffusion process
Source: Rogers (2003)
Therefore the four main elements are the 1) innovation, 2) communication channels, 3) time, and 4) the social system. They are identifiable in every diffusion research study, and in every diffusion campaign or program.
2.1.1 The innovation and its characteristics
The S-curve is innovation specic and system-specific, describing the diffusion of a particular new idea among the member units of the specific system. In fact, how Figure 2.1 shows, the diffusion processes is different for each represented innovations (I-II-III), depending on the distinct innovation’s characteristics. In particular, Rogers (2003), on the basis of the previous literature on innovation diffusion, found five main attributes that influence adoption decisions and explain the different innovation rates of adoption: 1) relative advantage; 2) compatibility; 3) complexity; 4) trialability; and 5) observability.
1) Relative advantage is the degree to which an innovation is perceived as better than the idea
it supersedes. The degree of relative advantage may be measured in economic terms, but social-prestige factors, convenience, and satisfaction are also often important components. It does not matter so much whether an innovation has a great deal of "objective" advantage. What does matter is whether an individual perceives the innovation as advantageous. The greater the perceived relative advantage of an innovation, the more rapid its rate of adoption is going to be.
2) Compatibility is the degree to which an innovation is perceived as being consistent with
the existing values, past experiences, and needs of potential adopters. An idea that is not compatible with the prevalent values and norms of a social system will not be adopted as rapidly as an innovation that is compatible. The adoption of an incompatible innovation often requires the prior adoption of a new value system. An example of an incompatible innovation is the use of contraception in countries where religious beliefs discourage use of birth-control techniques, as in Moslem and Catholic nations.
3) Complexity is the degree to which an innovation is perceived as difficult to understand and
use. Some innovations are readily understood by most members of a social system; others are more complicated and will be adopted more slowly. For example, in a study carried out in 1955, Wellin found that the villagers of a Peruvian village, Los Molinos, did not understand germ theory, which the health worker tried to explain to them as a reason for boiling their drinking water. In general, new ideas that are simpler to understand will be adopted more rapidly than innovations that require the adopter to develop new skills and understandings.
4) Trialability is the degree to which an innovation may be experimented with on a limited
basis. New ideas that can be tried on the installment plan will generally be adopted more quickly than innovations that are not divisible. Ryan and Gross (1943) found that every one
If the new seed could not have been sampled experimentally, its rate of adoption would have been much slower. An innovation that is trialable represents less uncertainty to the individual who is considering it for adoption, as it is possible to learn.
5) Observability is the degree to which the results of an innovation are visible to others. The
easier it is for individuals to see the results of an innovation, the more likely they are to adopt. Such visibility stimulates peer discussion of a new idea, as friends and neighbors of an adopter ask him or her for innovation-evaluation information about it. Solar panels on a household's roof are highly observable, and a California survey found that the typical solar adopter showed his equipment to about six of his peers (Rogers et al, 1979). Other consumer innovations like home computers or videotape recorders are relatively less observable, and thus may diffuse more slowly.
Generally, innovations that are perceived by receivers as having greater relative advantage, compatibility, trialability, observability, and less complexity will be adopted more rapidly than other innovations (Rogers 2003) (Figure 2.2).
2.1.2 The innovation diffusion process
According to Rogers: “The innovation-decision process is the process through which an individual (or other decision-making unit) passes from first knowledge of an innovation to forming an attitude toward the innovation, to a decision to adopt or reject, to implementation of the new idea, and to confirmation of this decision”.
The Rogers innovation decision process consists of five stages:
1. Knowledge occurs when an individual (or other decision making unit) is exposed to the innovation's existence and gains some understanding of how it functions.
2. Persuasion occurs when an individual (or other decision making unit) forms a favorable or unfavorable attitude toward the innovation.
3. Decision occurs when an individual (or other decision-making unit) engages in activities that lead to a choice to adopt or reject the innovation.
4. Implementation occurs when an individual (or other decision making unit) puts an innovation into use.
5. Confirmation occurs when an individual (or other decision making unit) seeks reinforcement of an innovation-decision already made, but he or she may reverse this previous decision if exposed to conflicting messages about the innovation.
The innovation-decision process involves time in the sense that the five steps usually occur in a time-ordered sequence of knowledge, persuasion, decision, implementation, and confirmation. The innovation- decision period is the length of time required to pass through the innovation-decision process.
2.1.3 Innovativeness and adopters categories
According to Rogers, adopter distributions follow a bell-shaped curve over time and approach normality, because of the cumulatively increasing degree of influence upon an individual to adopt or reject an innovation, resulting from the activation of peer networks about the innovation in the social system. This influence results from the increasing rate of knowledge and adoption or rejection of the innovation in the system. Adoption of a new idea is the result of human interaction through interpersonal networks. If the first adopter of the «innovation discusses it with two other members of a social system, and each of these two adopters passes the new idea along to two peers, the resulting distribution follows a binomial expansion, a mathematical function that follows a normal shape when plotted over a series of successive generations. The process is similar to that of an unchecked infectious epidemic (Bailey, 1957). Evidence supporting this statement comes from investigations of agricultural, consumer, and other innovations in a variety of social systems, in the United States, India, and other nations (Rogers, 1958; Bose, 1964; Ryan, 1948; Beal and Rogers, 1960; Dimit 1954; and Hamblin et al, 1973). All these researches show that S-shaped diffusion curves are essentially normal, a conclusion that is very useful for classifying adopter categories (Rogers 2003). In particular, Rogers established five adopter categories that describe and explain impacts of heterogeneity on adoption decisions (Mahajan et al.1990). These five categories are distinguished by adoption timing that measures the adopter innovativeness (see Fig.2.1). The innovativeness dimension is continuous and it is characterized by a normal distribution that has several characteristics that are useful in classifying adopters. One of these characteristics or parameters is the mean (x), or average, of the sample. Another parameter of a distribution is the standard deviation (sd), a measure of dispersion about the mean.
These two statistics, the mean (x) and the standard deviation (sd), can be used to divide a normal adopter distribution into categories. If vertical lines are drawn to mark off the standard deviations on either side of the mean, the curve is divided into categories in a way that results in a standardized percentage of respondents in each category (Figure 2.2).
The area lying to the left of the mean time of adoption minus two standard deviations includes the first 2.5 percent of the individuals to adopt an innovation—the innovators. The next 13.5 percent to adopt the new idea are included in the area between the mean minus one standard deviation and the mean minus two standard deviations; they are labeled early
adopters. The next 34 percent of the adopters, called early majority, are included in the area
between the mean date of adoption and minus one standard deviation. Between the mean and one standard deviation to the right of the mean are located the next 34 percent to adopt the new idea, the late majority. The last 16 percent are called laggards. (Rogers 2003)
Figure 2.2. Adopter categorization on the basis of innovativness
Source: Rogers 2003
Adopters in each category differ in several characteristics, for instance in their use of communication channels, readiness to assume risk, and social affiliation (Rogers 2003).
2.1.4 Rate of adoption
There is a third specific way in which the time dimension is involved in the diffusion of innovations. Rate of adoption is the relative speed with which an innovation is adopted by members of a social system. When the number of individuals adopting a new idea is plotted on a cumulative frequency basis over time, the resulting distribution is an s-shaped curve (see figure 2.1). At first, only a few individuals adopt the innovation in each time period (such as a year or a month, for example); these are the innovators. But soon the diffusion curve begins to climb, as more and more individuals adopt. Then the trajectory of the rate of adoption begins to level off, as fewer and fewer individuals remain who have not yet adopted. Finally,
the s-shaped curve reaches its asymptote, and the diffusion process is finished. Most innovations have an s-shaped rate of adoption. But there is variation in the slope of the "s" from innovation to innovation (see figure 2.1); some new ideas diffuse relatively rapidly and the curve is quite steep. Another innovation may have a slower rate of adoption, and its s-curve will be more gradual, with a slope that is relatively lazy. One issue addressed by diffusion research is why some innovations have a rapid rate of adoption, and why others are adopted more slowly (Figure 2.1). The rate of adoption is usually measured by the length of time required for a certain percentage of the members of a system to adopt an innovation. Therefore, we see that rate of adoption is measured using an innovation or a system, rather than an individual, as the unit of analysis. Innovations that are perceived by individuals as possessing greater relative advantage, compatibility, and the like, have a more rapid rate of adoption (as I pointed out previously in the section 2.1.2).
There are also differences in the rate of adoption for the same innovation in different social systems. Clearly, there are aspects of diffusion that cannot be explained only by the nature of individual behavior. The system has a direct effect on diffusion, and also an in direct influence through its individual members.
2.1.5 The social system: social and communication structure
Innovation decision process cannot be explained as a result of individual and innovations characteristics alone, but it is also fundamentally a social process (Rogers 2003). According to Deroian, 2002 the structure of a social system can facilitate or impede the diffusion of innovations in the system. The impact of the social structure on diffusion is of special interest to sociologists and social psychologists, and the way in which the communication structure of a system affects diffusion is a particularly interesting topic for communication scholars (Rogers 2003). Katz (1961) remarked, "It is as unthinkable to study diffusion without some knowledge of the social structures in which potential adopters are located as it is to study blood circulation without adequate knowledge of the structure of veins and arteries."
Rogers define structure as the patterned arrangements of the units in a system. This structure gives regularity and stability to human behavior in a social system; it allows one to predict behavior with some degree of accuracy. Thus, structure represents one type of information in that it decreases uncertainty. Perhaps we see an illustration of this predictability that is provided by structure in a bureaucratic organization like a government agency where there is a well-developed social structure consisting of hierarchical positions, giving officials in
higher ranked positions the right to issue orders to individuals of lower rank. Their orders are expected to be carried out. Such patterned social relationships among the members of a system constitute social structure, one type of structure.
An individual’s position and connectedness within a social system is important for adoption behavior (Valente 1995). Individuals who have more direct ties to other actors are more innovative, receive more information, and are less dependent on other individuals (Wasserman and Faust 1994; Valente 1995). Individuals who have dense networks are considered not to receive much information from outside. In a dense personal network, most members are connected to each other and are thought to hear of an innovation later (Valente 1995).
In addition to social structure among, Rogers define another type of structure, the
communication structure, that exists in the interpersonal networks linking a system's
members, determining who interacts with whom to create and share information with one another in order to reach a mutual understanding (Rogers 2003).
The interpersonal channels, involve a face-to-face exchange between two or more individuals, and are important in persuading an individual to adopt an innovation.
The information diffuses through Mass media channels too (radio, television, newspapers and so on) that are often the most rapid and efficient means to inform an audience of potential adopters about the existence of an innovation (Kats and Lazarsfeld 1955; Lazarsfeld et al. 1944; Lazarsfeld and Menzel, 1963) that is, to create awareness-knowledge (Rogers 2003). The importance of interpersonal and mass media channels in the innovation-decision process was investigated in a series of researches with farmers, and then largely confirmed in studies of other types of respondents. For example, Sill and Copp (1958) found that if the probability of adoption were to be maximized, communication channels must be used in an ideal time sequence, progressing from mass media to interpersonal channels. A farmer upsetting this sequence in any way prejudices progress at some point in the adoption process." The greatest thrust out from the knowledge stage was provided by the use of the mass media, while interpersonal channels were salient in moving individuals out of the persuasion stage.
Beal and Rogers (1960) obtained data on the relative importance of interpersonal and mass-media channels at each function in the adoption of 2,4-D weed spray from 148 Iowa farmers. On the basis of these studies Rogers, referring to his model of the innovation-decision
process2
argues that: ” Mass media channels are relatively more important at the knowledge
stage and interpersonal channels are relatively more important at the persuasion stage in the innovation decision process”.
So mass communication channels are primarily knowledge creators, whereas interpersonal networks are more important in persuading individuals to adopt or reject.
In literature can be identified several innovation diffusion models based on the relevance of social networks’ role in diffusion of innovations and on the assumption that people adopt an innovation when sufficient information has reached them. One of the first diffusion investigation based on these assumptions was the classic study of a new drug's spread among doctors carried out by Professor James Coleman and his colleagues in 1966. In particular they included various indicators of network communication behavior among their independent variables of study; they found these network variables to be the most important predictors of innovativeness. Moreover they proceeded to study the way in which interpersonal networks explained the very nature of the diffusion process. This methodological advance allowed Coleman et al to gain important understandings into the S-shaped diffusion curve.
Their work stands out as a model for gaining in-depth insight into the nature of diffusion, and their approach has attracted the later attention of various other diffusion scholars who have probed the dynamics of diffusion networks, like for example Rogers and Kincaid (1981). They conducted personal interviews with the sixty-nine married women in a Korean village in order to determine the role of interpersonal networks in the diffusion of family-planning innovations. Each respondent was asked which other women she talked with about contraceptive methods. Spatial location of each respondent's home was a very important predictor of who talked with whom, even though the village was extremely small (only about two typical city blocks in diameter). But space was by no means a complete explanation of diffusion networks links; in fact some women talked with a peer on the opposite side of the village. Physically lengthy links were especially characteristic of opinion leaders, which suggested that one of the important roles of such leaders was to interconnect the spatially related cliques in the village, and thus to increase the connectedness of the village's communication structure. Social similarity also helped to explain who was linked to whom; women of similar social status and age were more likely to interact with each other.
A general conclusion from who-to-whom studies is that space and social distance (that is, heterophily/homophily) are the main determinants of who talks to whom in diffusion networks. Homophily is the degree to which pairs of individuals who interact are similar in
certain attributes, such as beliefs, education, social status, and the like. Although a conceptual label— homophily—was assigned to this phenomenon only in fairly recent years by Lazarsfeld and Merton (1964), the existence of homophilous behavior was noted a half-century ago by Tarde (1903): "Social relations, I repeat, are much closer between individual who resemble each other in occupation and education." Heterophily is the degree to which pairs of individuals who interact are different in certain attributes. So Heterophily is the opposite of homophily.
When two individuals share common meanings, beliefs, and a mutual language, communication between them is more likely to be effective. Most individuals enjoy the comfort of interacting with others who are quite similar.
Homophily and effective communication breed each other, instead heterophilous communication may cause cognitive dissonance because an individual is exposed to messages that go unheeded becouse they are inconsistent with existing beliefs, causing an uncomfortable psychological state. But heterophilous communication has a special informational potential, even though it may be realized only rarely. These interpersonal links are especially important in carrying information about innovations, as is implied in Granovetter's (1973) theory of "the-strength-of-weak-ties," so homophilous communication may be frequent and easy but may not be so crucial as the less frequent heterophilous communication in diffusing innovations.
Extended models include that information about the innovation is assessed towards an
individual threshold3
that can change over time and depending on the adoption rate within the personal network of the decision-maker. Granovetter (1978) postulated that individuals were heterogeneous in the extent to which their social system influences on them. In fact, individuals have varying thresholds for adoption of an innovation. According to threshold models, individuals make decisions based on the proportion of others that have already done so (Granovetter 1978; Markus, 1987). In particular, a threshold is reached when an individual s convinced to adopt as the result to knowing that some minimum number of other individuals in the individual’s personal communication network have adopted and are satisfied with innovation (Rogers 2003).
A social-psychological theory with direct applicability to diffusion networks is social learning theory (Bandura 1977). The central idea of social learning theory is that an
3
individual learns from another by means of observational modeling; that is, one observes what another person is doing, and then does something similar. But not exactly the same thing. That would be simple imitation or blind mimicry. But social modeling permits the observer to extract the essential elements from an observed behavior pattern in order to create a similar behavior.
The basic perspective of social learning theory is that the individual can learn from observation of other people's activities, so the individual does not actually need to experience a verbal exchange of information in order for the individual's behavior to be influenced by the model. Thus, nonverbal communication is considered important in behavior change (as well as verbal communication). Therefore according to this theory, the potential adopter decision, whether or not to buy the new product, is based not only on his own preferences but on the decisions of his neighbors in the social network, hence the adoption behaviour of one member influences the adoption decision of another member (Rogers 1995;Valente 1995).
2.1.6 The role of opinion leaders in a diffusion network
In diffusion networks an important role is played by Opinion Leaders. Opinion leadership is the degree to which an individual is able informally to influence other individuals’ attitudes or overt behavior in a desired way with relative frequency . So opinion leaders are individuals who lead in influencing others' opinions about innovations. Various studies have attempted to understand the attributes and roles of opinion leaders (Weimann, Tustin, Vuuren, and Joubert, 2007). Besides their central position (Berelson and Steiner, 1964; Czepiel, 1974; Valente, 1996) other characteristics of opinion leaders, such as interpersonal influence and innovativeness, may significantly affect their influence. Two main types of interpersonal influence exist: informational and normative influence (Deutsch and Gerrard, 1955). Informational influence refers to the tendency to accept information from others as evidence of reality. For example, opinion leaders directly influence other consumers by giving them advice and verbal directions about their search for, purchase of, and use of a product (Flynn, Goldsmith, and Eastman, 1994). Normative influence, on the other hand, entails the tendency to conform to the expectations of others (Burnkrant and Cousineau, 1975). Hence, normative opinion leaders exert social pressure and social support and thereby influence decision-making pro- cesses of the influenced consumers (Glock and Nicosia, 1964). Since people aim to create and maintain meaningful social relationships, they often engage in
behaviors approved by others, such as adopting a product to appeal to other product adopters (Cialdini and Goldstein, 2004). The product and situation determine which type of influence is more important (Grewal, Mehta, and Kardes 2000). Privately consumed goods prioritize the informational influence, whereas for publicly consumed goods both types of influence are critical. Opinion leaders can accelerate the diffusion of innovation and are potentially interesting for political issues (Deroian, 2002). Valente and Davis (1999) investigate how the diffusion of innovations can be accelerated through opinion leader recruitment. They use homogeneous agents that adopt once 15% of their neighbors have adopted. The formal description of the underlying model is sketchy and the network model used, which randomly allocates seven ties per agent, does not appear to resemble most real-world social network structures very closely. Nevertheless, simulation results demonstrate that diffusion occurs faster when initiated by opinion leaders rather than by random or marginal agents and that targeting opinion leaders may therefore accelerate diffusion. Similar to Valente and Davis (1999), Delre et al. (2010) also investigate the effectiveness of opinion leader recruitment. Results suggest that the most important function of highly interconnected hubs is to inform others about the new products, but that their effect on the decision making of consumers can be often overestimated. They also find that in markets in which such hubs do not exist, diffusion is less likely to occur. For such markets, direct to consumer advertising could be an alternative strategy to stimulate the spreading of the new product in different areas of the network. Finally, van Eck et al. (2011) also study the role of opinion leaders, but take into account not only their central network position, but also the influence of personality traits and knowledge among influential consumers. Hence all these works show that the opinion leader can be recruited by policy makers to speed diffusion in a network of potential adopters and to reach higher level of diffusion, in other words to induce diffusion. Induced diffusion is a recent research area that study how regulatory interventions accelerate the adoption process (speed) and how they increase the long term penetration rate (level). In the following section I present a brief literature review on this new theoretical field and on patterns of diffusion when it is induced, that are different from the conventional patterns observed when diffusion is unaffected by policy interventions.
2.2 Induced diffusion
The origins of the concept of induced diffusion can be traced back to Hicks (1932) “induced innovation” hypothesis, according to which a change in the relative prices of the factors of production would by itself engender invention or innovation to economize the use of a factor which has become relatively expensive. A considerable literature has been developed using the induced innovation hypothesis within and beyond Hicks' original macroeconomic focus on the effects of wage rises on labor saving inventions (P. Funk, 2002; D. Popp, 2002). In particular, mounting concerns about climate change and environmental decay have led in recent years to the development of a literature exploring the possibility of price-induced innovation (A.B. Jaffe et al. 2002). For instance, Popp 2002 using patent data explores the effect of rising energy prices on innovation in energy technologies, whilst Newell et al., 1999 investigate the effects of rising energy costs on improvements in the energy efficiency of goods.
Research in this context has explored not just invention and innovation but also diffusion. Accordingly two related concepts to induced innovation are induced adoption and induced diffusion. The term ‘induced adoption’ appears to have first been employed by Antonelli (1990) in an examination of the territorial distribution of fax machines and modems and shows that their adoption is highly uneven geographically, favoring regions with higher levels of fixed and human capital and where there are positive network externalities, such as business clusters of service industries. These results highlight the importance of regional and socioeconomic differences as the broader context with which to engender the adoption of innovations. The most prominent use of the term induced diffusion was by Jaffe et al. (2002). In fact in their widely cited review of work on environmental policy and technological change, they explain the concern with induced diffusion, as distinct from induced innovation, when they observe that:
“While the induced innovation literature focuses on the potential for environmental policy to bring forth new technology through innovation, there is also a widely-held view that significant reductions in environmental impacts could be achieved through more widespread diffusion of existing economically-attractive technologies.”
Following from this, Diaz-Rainey in their induced diffusion literature included in a work of 2009, suggests a more formal definition of induced diffusion. In particular they define it as: “Any intervention that aims to alter the speed and/or total level of adoption of an innovation by directly or indirectly internalizing positive and/or negative externalities”.
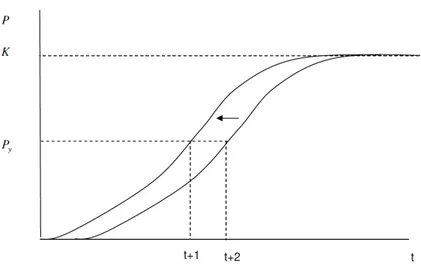
Following this definition Diaz-Rainey represent the desired impact of induced diffusion on diffusion speed (acceleration effect) (figure 2.3) and on diffusion level (increased saturation effect) (figure 2.4). Depicted in both panels are cumulative normal ‘s’ shaped diffusion curves.
Figure 2.3 Induced diffusion: acceleration
Source: Diaz-Rainey 2009
Figure 2.4 Induced diffusion: acceleration effect and increased saturation effect
Key: P = cumulative market penetration of an innovation; t = time; K = saturation
In Figure 2.2.1a policy interventions succeed in accelerating diffusion for a given level of
cumulative adoption P y from t+2 to t+1. In other words the diffusion curve shifts to the left.
Under this scenario, however, both curves ultimately reach the same market saturation point. In the second panel is diffusion also accelerated, however, in this case the policy
interventions also results in a higher ‘realistic’ saturation point, K r rather K u .
Diaz-Rainey (2009), in his work, after showing graphically the effect of policy maker intervention on speed and on level of diffusion, introduced some empirical evidence on the efficacy of some tools available to policymakers with which induce diffusion, as well as: trading mechanisms (Kerr and Newell, 2003); price and taxes (Baker et al., 1989; Lafferty et
al. 2001; Jaffe et al. 2002; Greene 1990; Hassett and Metcalf 1995; Jaffe and Stavins 1995;
Rose and Joskow 1990; Stoneman and Battisti 1998; Brown 2001; Golove and Eto 1996; Sanstad and Howarth 1994; Sorrell et al. 2004); subsidies (Hassett and Metcalf 1995; Jaffe and Stavins 1995; Soderholm and Klaassen 2007; Koefoed and Buckley 2008); command and control instruments (Cutler and McClellan 1996; Battisti and Stoneman, 1998; Stoneman and Battisti, 1998; Gray and Shadbegian, 1998; Stoneman and Battisti, 2000; Baker 2001; Snyder et al., 2003; Battisiti, 2008; Mickwitz et al. 2008; Luken and Van Rompaey, 2008; Koefoed and Buckley, 2008); information policy (Morgenstern and Al-Jurf, 1999; Howarth et
al. 2000; Anderson and Newell, 2004). Since Diaz-Rainey (2009), the research in the
emerging area of induced diffusion has grown a lot. For instance, Cantono and Silverberg (2009) explore through Agent Based Simulation the alternative policy approaches to ‘kick-start’ the diffusion of eco-innovations using a mixed probit and epidemic model. Further, Higgins et al. (2011) explore various policy options for reducing the greenhouse gas emissions from the housing stock using a decision support diffusion model applied to a case study in Australia. Finally Rixen and Weigand (2014) simulate through an Agent Based model the effect of different policy intervention on speed and level of Smart Meter adoption in Germany. The previous consideration about the importance of innovation networks (knowledge transfers among innovation potential adopters), included in the first section of this chapter and the consideration that innovation diffusion can be induced by policy makers, support the point of view adopted in this work and lead to the following question: how public policy could promote this knowledge transfer (word of mouth) in the agriculture sector both beetween research and the farmers worlds and between these last? A solution to this problem could be the innovation broker, a new figure contemplated by EIP (European Innovation Partnership), described in the following chapter.
Chapter 3
3.1 The innovation broker’s role in the agricultural knowledge infrastructure
EIP has been established by the Commission‘s proposal for a post-2013 rural development policy (COM 2012 79) with the aim of building a bridge and achieving synergies through fostering exchange between research and practice. Its implementation will be channeled through the Operational Groups (OG), as key acting entities involving different actors, such as farmers, advisors, researchers, NGOs, enterprises, etc. (ENRD, 2013b). The agricultural EIP adopts the interactive multi-actor model of knowledge exchange (European Commission, 2013; World Bank, 2006; Hall et al., 2006; Knickel et. Al., 2009; Mosley, 2000; Labarthe & Laurent, 2013; Latruffe, 2010), in order to promote end user focused solutions or developing new opportunities (ENRD, 2013a).
In the context of the agricultural EIP, the main task of the innovation broker is to help the setting up of operational groups around concrete innovation projects through collecting information, animating bottom-up initiatives, helping to refine innovative ideas, providing support for finding partners and funding, as well as for preparing the project proposal work plan.
These functions are not exhaustive of the possible activities that the innovation broker can play in view of smoothing the innovation process (Cristiano and Proietti, 2011). In fact, the literature describes a variety of functions performed by innovation brokers, that will be explained in the following paragraph.
According to Klerkx and Leeuwis (2009) the formation and functioning of innovation networks and systems can be problematic due to the existence of several gaps between actors. In this context, there is the need for subjects whose main function is to fill these gaps by connecting different players so as to facilitate knowledge exchange across the boundaries between them. This task will be performed by the “innovation broker” (Herman et al.,2012; Perèz et al., 2010; EU SCAR, 2012), meaning “ an agent or broker in any aspect of the innovation process between two or more parties”, whose activities include helping to provide information about potential collaborators, brokering a transaction between two or more parties, acting as a mediator or go-between bodies or organizations that are already collaborating, helping find advice, funding and support for the innovation outcomes of such collaborations (Howell, 2006). As Howell observes, organizations can provide intermediary functions as their primary or exclusive role, but also as jointly activities of research and technical services. The role of the innovation broker is very usual in the Netherlands, since it has emerged following the privatization of the research and extension system and a
paradigmatic shift in the agricultural and rural fields, as well as in innovation pathways. Klerkx and Leeuwis (2009) give examples of the seven distinct types of agricultural innovation brokers that can currently operate in the Netherlands:
- innovation consultants are organizations focused either on the individual farmer (type 1), or ona collective of farmers (type 2) with a common interest, who wish to jointly develop or implement an innovation;
- peer network brokers (type 3) are organizations involved in the setting up of peer networks (generally with a sub-sectorial focus) concerned with informal knowledge exchange among the farmers;
- systemic brokers (type 4) go beyond individual firms, or networks of firms, addressing higher level innovation architectures that involve complex constellations of business, government and societal actors, dealing with complex problems and radical innovations; - internet portals (type 5) connect farmers with relevant information sources;
- research councils with innovation agency (type 6) are aimed at connecting relevant actors in the agriculture value chain in order to facilitate farmer-driven research planning mechanisms; - education brokers (type 7) link education establishments with the aim of positioning the agricultural schools in view of responding to innovation queries from the agricultural sector. Howell (2006) describes a detailed set of functions concerning innovation brokerage that are primarily targeted at assisting individual firms in innovation processes, through articulating their innovation needs and composing the network (e.g. knowledge processing, selection of collaborative partners and network brokerage, gate-keeping and knowledge brokering, etc.). Besides, Smits and Kuhlmann (2004) describe other functions with a more systemic focus, aimed at interfacing with different actors and animating groups, such management of interfaces, building and organizing (innovation) systems, stimulating demand articulation, and so on. Klerkx and Leeuwis (2009) summarize the last functions as innovation process management, which includes a host of facilitation tasks that ensure that networks are sustained and become productive, e.g. through the building of trust, establishing working procedures, fostering learning, managing conflict and intellectual property management (Leeuwis, 2004). In the context of the agricultural EIP innovation process management is not an expected function, as the broker’s core objective is to help the group in the elaboration of a well-designed project plan. However, in case the project gets funded, the innovation broker could also be involved in its implementation, as a facilitator, and even in the dissemination of results. Despite the potential role of innovation brokers in facilitating partnerships and
linkage among different innovation players, several risks have been identified with particular regard to their neutral position and possible function ambiguity, as well as, to funding problems (Klerkx et al., 2009). Concerning neutrality, innovation brokers can reveal possible dependence from shareholders, who may exercise pressure to compose and manage network in order to satisfy their own interests. Therefore, there is a concrete risk that innovation intermediaries may be used as a vehicle for realizing other parties’ objectives and expectations. Neutrality issues seem to be particularly relevant with regard to network brokerage roles performed by traditional research and extension providers. In these cases, it is possible that the articulation of needs and the selection of cooperation partners may be influenced in favor of the needs of the provider rather than those of the client. Besides, function ambiguity tensions may arise as a consequence both of a new, and not completely clear, mission of innovation brokers and of an overlap with intermediary functions from research and extension services. Innovation brokers acting with insufficiently differentiation from the role of advisory and research providers may be seen by these latter as direct competitors. At the same time, farmers who are not aware of what they can expect from the innovation broker, cannot have the indispensable confidence in her/his functions. Moreover, farmers’ representatives can see the innovation broker as a threat due to a possible role of opinion leader in performing ‘animation’ functions. According to Klerkx et al. (2009), specialized innovation brokers may be an option to prevent neutrality tension and to act as innovation catalysts more freely, but, on the other hand, they bear their own tensions with regard to neutrality, function overlap and funding. A further drawback can be related to the difficulty of recognizing the value of intermediating role among the variety of tasks performed by a multi-actor network. This may lead innovation brokerage activities to be economically non-self-sufficient and, thus, impossible to exist without public funding schemes. Cristiano and Proietti (2014), in a study that aim to profile the innovation brokerage model applied in Italy, synthesize the functions described by the European Commission and those described by the literature in eight tasks:
! Discovering innovative ideas, identifying and articulating farmers’ needs;
! Connecting partners, identifying suitable partners from different knowledge fields;
! Supporting partners to refine the idea, articulating their demands and expectations;
! Identifying funding;
! Preparing the project proposal;
! Running innovation, playing a role in initiating, developing and testing an innovation;
! Communicating results, carrying out effective dissemination activities addressed to
transfer knowledge on the innovations.
Moreover Cristiano and Proietti (2014) in their work show that the implementation of measure 124 of RDPs in Italy has driven a variety of actors belonging to AKIS (Agricultural Knowledge and Innovation System) , innovation center, university and research centre, farmers, LAGs, Producer Organization (PO), cooperatives, consortiums, local administration, to self-organize themselves and establish partnerships for the specific purpose of developing, through cooperation, innovation projects and demonstrate that the involvement, as innovation brokers, of actors who are already part of the system and who also play a role in the implementation of the project, lets the innovation process be more sustainable, avoiding the risk of projects that do not necessarily address the real needs of change of the farmers or the group, and promotes a collaborative learning environment.
Regarding to the last task described by Cristiano and Proietti (2014), how the innovation broker should implant useful information into a farmer’s networks about a new technology so that it reach the maximum number of individuals? The logic answer to this question is that the innovation broker to pass information about the novelty to the maximum number of potential adopters and to obtain the highest diffusion level should choice as injection points the most influent actors in the farmers’ network. In social network literature have been described different algorithms to identify influential spreaders in networks, among which there is a recent algorithm developed by Morone and Makse (2015) that are discussed in the following paragraph.
3.2 Different methods for the innovation broker to carry out effective dissemination activities
Localizing in a network the optimal (minimal), set of structural nodes, called influencers, which, if activated, would cause the spread of information to the whole network (Domingos et al. 2002) is one of the most important problems in network science (Kempe et al. 2003, Newman 2010).
This problem has been heuristically adressed as (like) a problem that leads to the identification of the nodes suitable for the optimal network’s fragmentation.
Heuristic methods quantify node’s importance in a network (Newman 2010; Kleinberg 1999), on the basis of individual’s node attributes such as: 1) Closeness Centrality; 2) Betweenness centrality (BC); 3) Eigenvector Centrality (EC); 5) High-Degree (HD).
1) Closeness Centrality (CC) (Bavelas 1950) measures how close a vertex is to all other
vertices in the graph. More precisely CC at node i is the inverse of the average distance to all other nodes. Nodes are ranked according to their CC from the highest to the lowest score, and removed accordingly. A property of CC is that it tends to give high scores to individuals who are near the center of local clusters (i.e. network communities), and hence it over-allocates spreaders (or immunized nodes) next to each other. Moreover, it comes with a high computational cost that prevents the application to large networks.
2) Betweenness centrality (BC) (Freeman, 1977). Betweenness centrality of node i is the sum
of the fraction of all-pairs shortest paths that pass through i. BC is a very popular tool for network analysis, which has applications in different fields, from community detection to the human brain. However, it comes with a high computational cost that prevents the examination of large graphs of interest. The best algorithm for BC computations has O(NM) time complexity for unweighted networks with N nodes and M vertices. It is not fast enough, for example, to handle our 10+ million people network. It does not outperform other centralities.
3) Eigenvector Centrality (EC). It is an alghoritm introduced by Straffin in a work of 1980
and it corresponds to the largest eigenvalue of the adjacency matrix. Node rank is the corresponding entry of the eigenvector. Nodes are removed starting from the highest rank. This method is not very powerful, especially for the case of SF networks, where most of the weight may be carried by few nodes (hubs), while the others have vanishingly small weights, and thus they are not properly ranked.
4) PageRank (PR) (Brin and Page 1998). It is the famous algorithm used by Google for
ranking websites. It consists in condensing every page in the World Wide Web into a single number, its PageRank. PageRank is a global ranking of all web pages, regardless of their content, based solely on their location in the Web's graph structure. PR can be thought of as the most successful rank, ever. At its heart, it is another eigenvector centrality. It computes the probability that, if someone follows links on the web at random, performing a random walk of clicks, he/she eventually hits your website. The higher this chance, the higher the PR of the website. Therefore, sites that get linked more are considered reputable, and, linking to other websites, they pass that reputation along. Thus, the shortcoming with PR comes from
the fact that PR takes node's score into account when calculating other's scores. In other words, a high-PR site may confer a much higher score to otherwise unpopular sites it happens to link. Notice that in our algorithm using the non-backtracking operator this problem is cured nicely, since the infuence is computed by "ignoring" the node you come from.
5) High-Degree (HD) (Pastor-Satorras et al. 2001, Albert et al. 2000, Cohen et al.2001).
According to this method nodes are ranked by degree, and sequentially removed starting from the node of highest degree. One of the limitations of this method is the fact that hubs may form tightly-knit groups called\rich-clubs" (Colizza et al. 2006, Wasserman 1994). Strategies based on high-degree will highly rank these rich-club hubs. On the other hand, an optimized scheme will target only one of them to avoid overlap between the already attacked areas in the network. High Degree Adaptive (HDA) is the adaptive version where the degree of the remaining nodes is recomputed after each node removal.
All these methods based on individual node ranking consider the influencers as isolated entities and not the interaction with each other, so they not optmize an objective global function of influence, this means that the removal of some nodes, based on one of the heuristic methods described previously, doesn’t guarantee the maximum distruption on a network. Morone and Makse (2015) face this problem by mapping the integrity of a tree-like random network into optimal percolation (Hashimoto 1989; Karrer et al.2014) theory. From this, they derive an energy function with a minimum that corresponds to the set of nodes that need to be eliminated, to yield a network whose largest cluster is as small as possible. To do this, Morone and Makse (2015) introduced the concept of collective influence, an algorithm that allows them to efficiently dismantle networks. They define the collective influence of a network node as the product of its reduced degree (the number of its nearest connections, k, minus one), and the total reduced degree of all nodes at distance d from it (defined as the number of steps from it).
CI (i) = (ki – 1) Σ (kj – 1) (3.1)
Collective influence describes how many other nodes can be reached from a given node, assuming that nodes of high collective influence have a crucial role in the network. The collective-influence-based algorithm then sequentially removes nodes, starting with those that have the highest collective influence (known as influencers) and recalculating the collective influence of the rest following each operation. The authors show that, for large
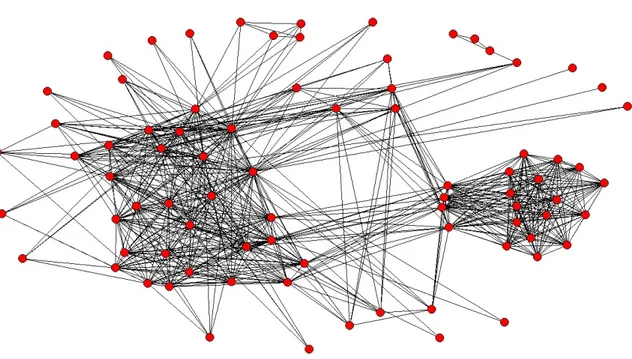
networks, removing the set of influencers identified by this algorithm is more effective in fragmenting a network than removing the hubs, or than removing nodes that are identified through other algorithms, such as degree or closeness centrality. The set of influencers identified by the authors contains many nodes with few connections. This highlights the fact that the importance of a node in ensuring a network’s integrity is determined not only by the number of direct links it has to other nodes, but also by which other nodes it is connected to. Morone and Makse concluded in their work that the influencers founded by collective influence are more effective in destroying a network than nodes selected by other methods, like for example the high degree method. Kovacs and Barabasi, 2015 showed an example of this optimal network disaggregation (see Fig. 2.4.1).
Figure 3.3.1 - Optimal network demolition
Source: Kovacs and Barabasi, 2015
In the network showed in figure a), for d = 2, the red node with k = 4 has the highest collective influence, because the total reduced degree of the nodes at d = 2 from it (green and yellow circles) is 21. This yields a collective influence of 3 • 21 = 63. The most connected hub, with k = 6 (yellow circle), has a collective influence of 60. Figure b), show what happens if the 6 nodes with the highest k (white circles) are removed. This one causes considerable damage to the network, but leaves a sub-network that contains 12 nodes unperturbed. In figure c, by contrast, the removal of four influencer nodes (white circles) chosen according to their collective influence lead to a fragmented network in which the largest connected cluster that remains has only ten nodes. The major finding of the contribution of Morone and Makse (2015) is the elaboration of an algorithm that allows identifying the members of the network having the most capillary influence on the rest of the