1
UNIVERSITY OF FOGGIA
DEPARTMENT OF ECONOMICS
PHD
“HEALTH FOOD INNOVATION AND MANAGEMENT”
TITLE OF THESIS:
“
Sustainability and shelf life extension: the case studies of
fresh cut salad, extra virgin olive oil and vegetable derivate”
PhD: Giustina Pellegrini
Tutor: Professor Francesco Contò
Referee: Prof. Jacqueline Bloemhof
Referee : dr. R Rene Haijema
2
Riassunto
Oggigiorno, gli sforzi più significativi nella scienza delle tecnologie alimentari hanno riguardato l’allungamento delle vita commerciale (SLE degli alimenti e delle bevande. In questo contesto, però, è stata prestata una scarsa o nulla attenzione al possibile contributo positivo che la SLE ha sulla sostenibilità globale di un prodotto alimentare lungo tutta la filiera. La SLE può contrastare le perdite di cibo e avere degli impatti positivi sulla distribuzione e sulla logistica. Numerosi studi hanno sottolineato l'importanza di aumentare le conoscenze su questi temi. Il presente progetto mira a colmare questo gap, utilizzando la SLE, ottenuta con un'innovazione di formulazione, di trasformazione o di confezionamento, come un nuovo indicatore di sostenibilità. Le attività si focalizzano su tre diversi tipologie di prodotto alimentare: l'insalata di IV gamma, l'olio extra vergine di oliva e il patè di olive. Sono stati raccolti dati relativi agli alimenti selezionati (consumi, perdita di cibo, canali di distribuzione), al fine di valutare l'impatto della SLE. Questi dati saranno utili per supportare il decision maker nella valutazione e modellizzazione di nuove strategie in grado di tener conto degli effetti di SLE sulla sostenibilità globale degli alimenti selezionati.
3
Index
1. INTRODUCTION (3)
1.1- The importance of food waste reduction (3)
1.2- Food waste reduction initiatives in Italy (11)
1.3- Food waste reduction initiatives in Europe (12)
1.4- The Shelf life extension as solution to reduce food loss (13)
1.5- The objective of the research (14)
2. SOCIAL IMPACT (16)
2.1- Reducing food losses: a (dis)-opportunity cost model (17)
2.1.1 Introduction (17)
2.1.2 Methodology and results (18)
2.1.3 Discussion (19)
2.1.4 Conclusions (22)
2.2- Attitude toward food waste reduction: the case of Italian consumers (25)
2.2.1 Food waste and consumer’s behavior (25)
2.2.2 Material and Methods (28)
2.2.3 Results and Discussion (31)
2.2.4 Conclusions (39)
3. ECONOMIC AND ENVIRONMENTAL IMPACT: THE CASE STUDY OF EXTRA VIRGIN OLIVE OIL (EVOO) (46)
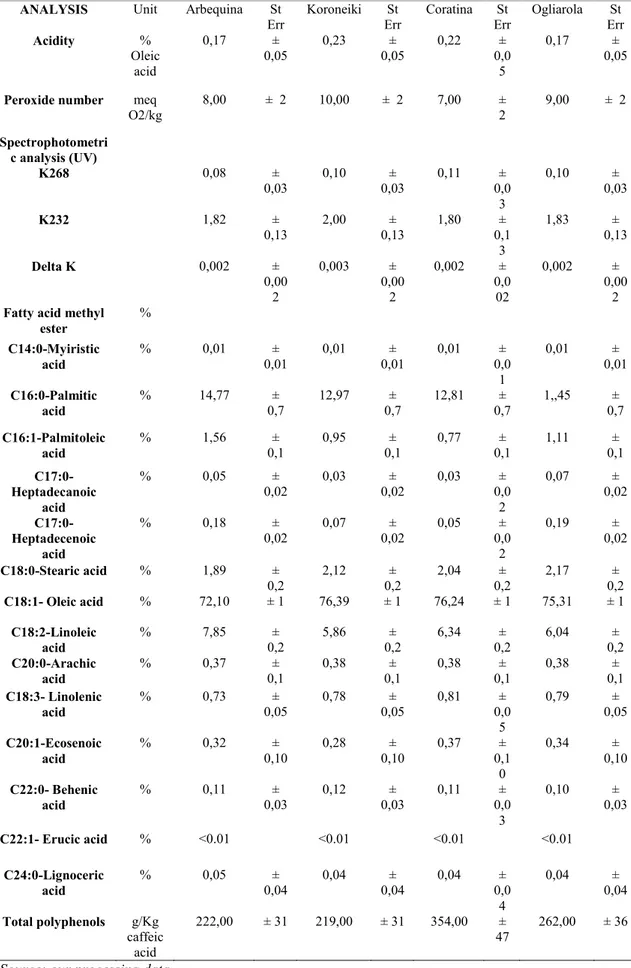
3.1 Shelf life extension of EVOO (46)
3.1.1-The high healthy value of EVOO (47)
3.1.2- Materials and methods (49)
3.1.3 Results and Discussion (50)
3.2 Economic sustainability of different olive growing systems (56)
3.2.1 Olive oil sector in Italy (56)
3.2.2 Intensive or High Density systems(HDS) (58)
3.2.3 Superintensive or Super-High Density system (HDS) (58)
3.2.4 Material and Methods (59)
3.2.5 Results and Discussions (61)
3.3 Conclusions (65)
3.4 Environmental Analysis of different olive growing systems (74)
3.4.1 Introduction (74)
3.4.2 The theoretical approach to water footprint analysis (76)
3.4.3 Materials and methods (78)
3.4.4 Results and discussions (83)
3.4.5 Conclusions and recommendations (86) 4. ENVIRONMENTAL IMPACT:THE CASE STUDY OF OLIVE PATE’ (90)
4
4.1 Introduction (90)
4.2 Material and methods (93)
4.2.1 Product shelf life extension (93)
4.2.2 Life Cycle Assessment Analysis (94)
4.3 Results and discussion (98)
4.3.1 Life Cycle Impact Assessment (98)
4.3.2 Life Cycle Impact Interpretation (99)
4.4 Conclusions (99)
5. SLE IMPACT ON LOGISTICS:THE CASE STUDY OF FRESH CUT SALAD (100)
5.1 Introduction (100)
5.2 Material and methods (103)
5.2.1 Modelling logistics (105)
5.2.2 Collecting data- transport burdens (105)
5.2.3 Collecting data- transformation burdens (107)
5.2.4 Collecting data- retailer burdens (108)
5.3 Results and discussion (109)
5.3 Conclusions (112)
5
Abstract
Actually, in the recent past the most significant efforts in food science and technology have been addressed to extending the commercial life of foods and beverages. In this context, however, very little or null attention has been paid to the possible positive contribution, coming from a shelf life extension (SLE) to the overall sustainability of a food product along its entire supply chain. Nevertheless, a shelf life extension can contrast food losses and the logistic distribution impacts and several studies stressed the importance of increasing the knowledge about these issues.
The project aims to overcome this gap, using SLE as a new Sustainability Indicator and matching the shelf life extension, due to a formulation, processing or packaging innovation, with the possible increase of global sustainability of food products. The activities faced different food items selected such as fresh cut salad, extra virgin olive oil, and vegetable derivate. Data pertinent to the target foods have been collected (consumptions, food loss, pathways of distribution), in order to assess the impact of shelf life extension through innovations developed or tested. These data will be useful to support the decision maker in the assessing and modelling new strategies able to take into account the effects of SLE on the global sustainability of the target foods selected.
1. INTRODUCTION
1.1- The importance of food waste reduction
The way to produce and consume food has a huge impact on the planet's resources. There is no doubt that to move towards a sustainable future involves a profound transformation of the food sector, because this food style in our society has proved harmful to health and environment. “Sustainable Products” are those able to provide environmental, social and economic benefits over their full commercial cycle, from the extraction of raw materials to final disposition. A huge interest is already on this subject and it increases daily, more and more. A lot of sustainable product standards are now available and it is now quite easy to find life cycle based metrics by which it is possible to identify sustainable products (Baldwin, 2009). In addressing the sustainability issue, researchers and policy-makers have to face economic development and environmental preservation, while also ensuring intergenerational equity balancing the need for development and the concern for the least advantaged generations (Martinet, 2012). Food scraps or losses represent irrational use of resources producing a negative direct impact on the income of entrepreneurs and
6
consumers; a coordinated strategy that improves the efficiency of the entire supply chain is, therefore, required.
In this context, a clarification of terminology between food loss and food waste is needed:
Worldwide, an estimated 1.3 billion tonnes of food is lost or wasted annually in production, manufacture and distribution, and in homes (FAO, 2013); this is approximately one third of food produced for human consumption. This means that a huge amount of resources used in food production is used in vain and the same for the greenhouse gas emissions caused by the production of food (Segrè, 2011; FAO, 2011). “Food loss” represents the amount of edible food, originally intended for human consumption but is not consumed for any reason; it includes loss and natural shrinkage (e.g., moisture loss), loss from mold, pest or inadequate climate control and plate waste.
“Food waste” occurs when an edible item goes unconsumed, such as food discarded by retailers due to undesirable color or blemishes and plate waste discarded by consumers (Wells et al., 2014).
To classify a product as “sustainable”, it is also important to take into account the improvement efficiency of the whole supply chain, considering that the largest part of the waste is concentrated in the latter stages: distribution and consumption.
Food is wasted from agricultural phase to final household consumption. In developed countries, food losses are primarily due to the lack of infrastructure (i.e., cold chain developments), as well as lack of knowledge or investment in the means to protect from losses arising from damage and spoilage attributable to rodents, insects, molds, and other microorganisms. Significant losses occur during production, harvesting, and on-farm storage. In contrast, in industrialized countries, food gets lost when production exceeds demand, and losses are more significant at household level and in retail and foodservice establishments. There are three broad stages of the food supply chain (i.e., at the farm, retail, and consumer levels); and although many of the causes are similar across developed countries, such as food that has past its ‘use-by’ dates, some factors have greater variation, such as the socio-demographic characteristics and cultural traditions manifested through individual behaviour.
According to a study across Europe countries the amount of food waste in 2012 is equal to 88 million tonnes (this amount includes both edible food and inedible parts associated with food) that corresponds to 173 kilograms of food waste per person (Stenmarck et al., 2016). In Fig.1.1.1the percentage of food waste assessed by sector
7
(among 28 European countries) in 2012 were reported: at households level the higher food waste percentage occurs (53%) following by Processing(11%) and Food Service (12%) phases (Stenmarck et al., 2016).
Fig. 1.1.1-Food waste by sector in 2012 (includes food and inedible parts associated with food)
Source: Stenmarck et al., 2016
Food losses and wastes reduction and the optimization of the logistics are for the EU and not only a key challenge. There are several reasons that drive food loss and waste prevention (Buzby and Hyman, 2011).The first reason is due to the growth of world population, thus more food is needed to ensure access to food. The second reason is that food waste represents significant economic resources invested throughout food’s entire lifecycle to produce, store, transport, and otherwise handle something that does not ultimately meet its intended purpose of feeding people. The losses on the time of harvest and storage are the cause of lost income for small farmers and higher prices for consumers. The reduction of losses has therefore an immediate and significant socio-economic impact.It becomes difficult to estimate the costs and impacts of these losses. Basing on producers prices only, the direct economic cost of food wastage for agricultural products (excluding fish and seafood), is equal to USD 750 billion, equivalent to the GDP of Switzerland (FAO, 2013).
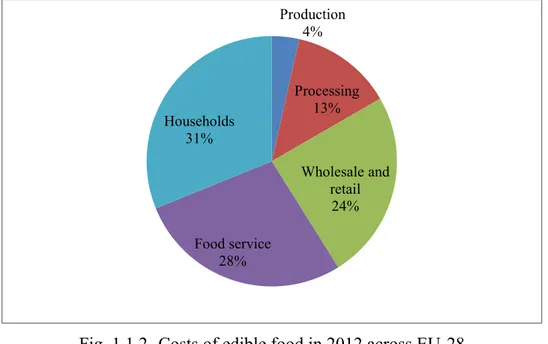
Stenmarck et al. (2016) assess the costs associated with edible food EU-28 in 2012, and it is equal to 11334 euros per tonne. Particularly the cost at households level is equal to 3529 euros (31.1%), 3148 euros (27,8%) for food service phase, 2790 euros
Production 11% Processing 19% Wholesale and retail 5% Food service 12% Households 53%
8
(24.4%) in wholesale and retail phase, 1490 euros (13.1%) in processing phase, and 399 euros (3.5%) in production phase (Fig.1.1.2).
Fig. 1.1.2 -Costs of edible food in 2012 across EU-28 Source: our processing data from Stenmarck et al. (2016)
The third reason is that food production generates negative externalities and adversely impact society and the environment such as (Fiore et al., 2015):
greenhouse gas emissions;
water pollution and damage to marine and freshwater fisheries from agricultural chemical run-off during crop production;
soil erosion, salinization, and nutrient depletion;
uneaten food vainly occupies almost 1.4 billion hectares of land representing about 30 percent of the world’s agricultural land area.
genetic erosion and biodiversity loss (Graham-Rowe et al., 2014; Pearson et al., 2014).
The social impact of food waste contributes to increase the global food prices, consequently makes the food not accessible for the poorest and allows the increase of malnutrition (Graham-Rowe et al., 2014).
Furthermore the social implications of food waste are related to food security, and the reduction of food waste has been identified as a key component of strategies to feed a future global population of 9 million people (Parizeau et al., 2014).
A food which become a waste, has a negative impact on the Society, the Economy and the Environment that we should learn how to assess. A very recent EUResolution
Production 4% Processing 13% Wholesale and retail 24% Food service 28% Households 31%
9
states that if nothing is done, food wastage will grow 40% by 2020 (http://www.europarl.europa.eu, 2011). This is an ethical but also an economic and social problem, with huge implications for the environment. The measuring of food loss is a complicate issue. Several different approaches have been used, based on estimates and real data, using surveys, interviews, indirect statistical measures and even archaeological examination of household, cafeterias and restaurant garbage. In any case, what is definitely clear is that food losses occur throughout the entire food system. It is clear evident, in any case, that a significant improvement in the capacity of estimating the food losses is required and protocols and procedures are needed, as well as an action towards the education of consumers is really urgent (Scott et al. 1997, Schneider 2007).
In a study conducted in UK the authors assess that the percentage of GHG emissions of the whole food chain excluding land use (Garnett, 2008). As shown in Fig.1.1.3 the phase that more contributes to GHG emissions is production, following by processing, households, transport and retail. This classification depends certainly on the type of analyzed product.
Fig. 1.1.3-Breakdown of food chain GHG emissions in the UK excluding land use change. Source: Garnett (2008)
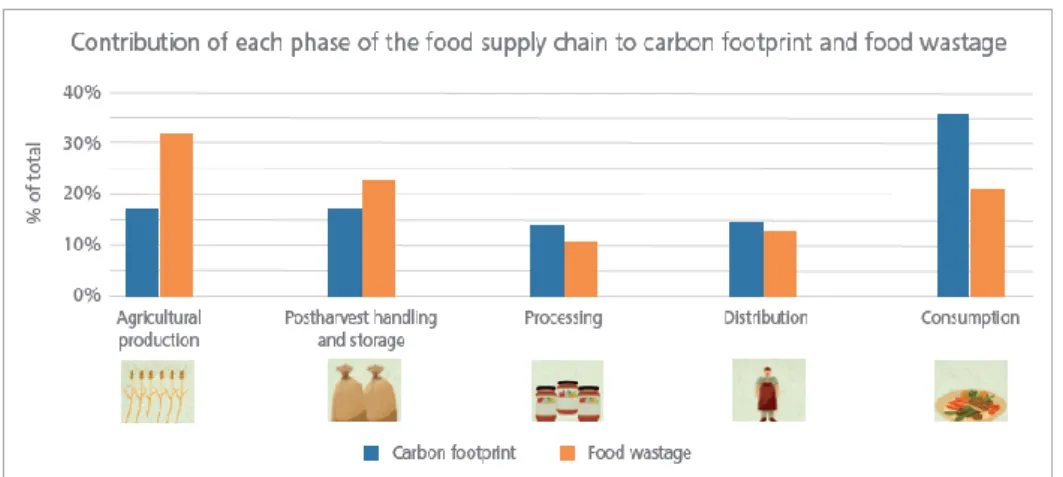
According to FAO (2012) and Griffin et al. (2009), consumers are the biggest contributors to the total volume of food waste generated over the world: the carbon footprint of wastage in the consumption phase is equal to 37% of total, whereas consumption only accounts for 22% of total food wastage. The carbon footprint attributed to production and post harvest waste is equal to 34% with an highest
Production 45% Processing 19% Transport 12% Retail 7% Households 15% Waste disposal 2%
10
percentage of waste (respectively 32% and 23%); the lowest percentage of carbon footprint occurs at the processing (14%) and distribution (15%) phases with a waste percentage equal to 10% and 13% (Fig. 1.1.4). One kilogram of food that is wasted further along the supply chain will have an higher carbon intensity than at earlier stages. These data constitute the basis for planning evaluation and identification of waste prevention measures.
Fig.1.1.4- CF and FW contribution of each phase in food supply chain Source: FAO 2013
The loss of land, water and biodiversity, as well as the negative impacts of climate change, represents huge costs to society that are yet to be quantified. Fig. 1.1.5 shows the food items that more contribute to CO2 emissions production such as meat and drink until to arrive to oil and fat.
Fig. 1.1.5– Foods contributing increase of CO2 emissions. Source: WRAP data (2015)
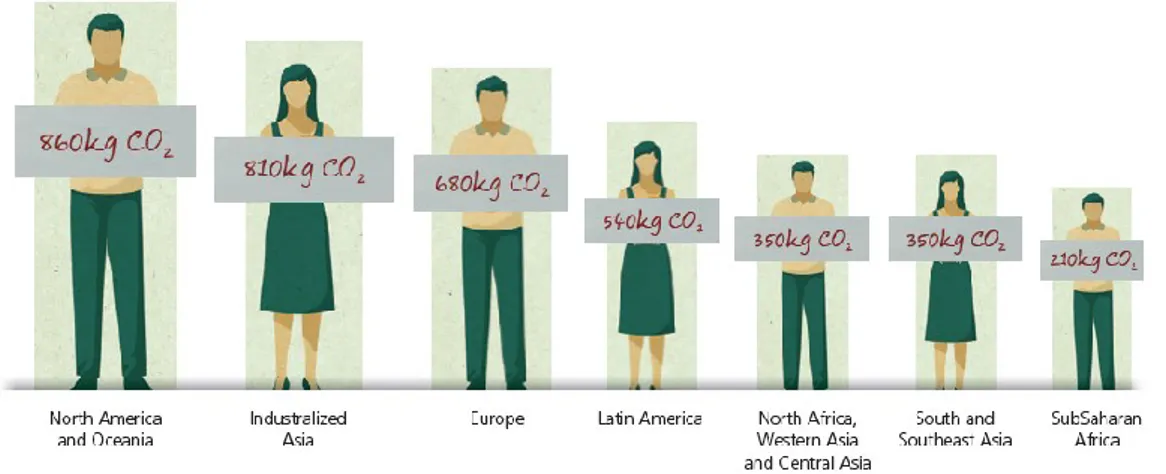
Fig. 1.1.6 shows the per capita food waste footprint in different region of the world. It is clear that in industrialized countries and areas such as North America and Oceania and Europe. Particularly North America and Oceania per capita footprint (860 kg CO2)
11
is four times higher than Sub Saharan Africa (210kg CO2). In Europe, is equal 680 kg CO2 (Fig. 6) less than Industrialized Asia with 810 kg CO2·person-1 (FAO,2013).
Fig. 1.1.6- Global average, per capita food wastage footprint on climate in different countries
Source: FAO, 2013\
In Europe, in 2014, 122 million people (24,4%) were at risk of poverty or social exclusion and among them 55 million (9,6%) were not able to afford a quality meal every second day (Fiore et al., 2015)
In Fig. 1.1.7 the percentage of around the world from 1990-1992 to 2012-2014 period was reported.
According to FAO’s food balance sheets, all high-income countries now have available at retail level, more than 3,000 kcal of food per day per capita, with Europe leading the list (Smil 2010).
Fig. 1.1.7 - Undernourishment around the world, 1990-1992 to 2012-2014. Source: FAO, 2014*projection
12
Significant effort are so to be planned to reduce undernourishment, food waste and CO2 emissions reduction, conserve the environmental and natural resources, mainly through community participation to ensure that growth is sustainable.
Food losses are principally caused by lack of coordination between the different actors in the chain, by the consumer's behaviour as well as by the presence of the certification rules that reject foods not perfect in form or appearance (BCFN, 2013; Schneider, 2007).
Thus, understanding of factors that contribute to the amount of food waste generated by consumers is a priority and so a crucial driver for providing policies suggestions. According to HLPE (2014), the possible sources of global food waste are:
lack of adequate infrastructure (market, storage, cold chain, processing infrastructure)
lack of support for actors for investment (often results from lack of access to finance and credit) and implementation of good practices
lack of integrated food chain approaches and management
lack of awareness, lack of shopping planning, confusion about "best before" and" use by" date labels
lack of knowledge on how to cook with leftovers (households) lack of investments
standard portion sizes, difficulty of anticipating the number of clients (catering)
stock management inefficiencies, marketing strategies (2 for 1, buy 1 get 1 free), aesthetic issues (retail)
overproduction, product & packaging damage (farmers and food manufacturing);
inadequate storage (whole food supply chain); inadequate packaging
impact of policies, laws and regulations (waste disposal)
the manufacture of safe food is the responsibility of everyone in the food chain and food factory, from the operative on the conveyor belt to higher management
agricultural investment policies, including training and extension animal feed regulations
13
1.2- Food waste reduction initiatives in Italy
The estimation of food loss and waste is becoming increasingly important as a quantitative baseline for policy makers and to food industry to set targets and develop initiatives, legislation, or policies to minimize food waste, conserve resources, and to improve human health worldwide. According BCFN (2012) every year 9 billion tonne of food go to waste. This amount is able to feed 44 billion of people and is equal to 37 billion of euro that represent 450 € year-1 per family. Today there are several types of action for waste reduction and recuperation of food in order to improve the optimization of supply chain:
One of the example of initiative was the Milan Protocol: a policy document, promoted by Barilla Center for Food and Nutrition (BCFN) that presents targets and guidelines for improvements of the food system, in order to tackle 3 core issues: promote healthy lifestyles (and so defeating hunger and stop rising of obesity), create sustainable agriculture (rebalancing the percentage of crops for food and fuel) and reduce food waste (reduce waste by 50% within 2020).
The mostly non-profit organizations is Last Minute Market , a spin-off of the University of Bologna that is a project where retailers, shops and producers who have unsold food which would otherwise be discarded are linked with people and charities who need food. This project offers services to enterprises and institutions in order to prevent and reduce waste production at its origin. It also develops innovative services for the recovery and reuse of unsold goods.
Fondazione Banco Alimentare is an Onlus organization with 1900 volunteers that collect food from canteens, catering, supermarket and large-scale retail trade to charity organization. Today, about 700 firms provide excess of food to Banco Alimentare. The same activities are developed by:
program SITICIBO, the first initiative that applied the Buon Samaritano law (155/2003);
EQUOEVENTO ONLUS born in Rome in 2013 that collect food also from events (wedding, conference etc.).
Carta Spreco Zerois an academic spin-off which commits public administrators to support initiatives for the reduction of food losses and wastes. The project is connected to the European Resolution against food waste that has dedicated 2014 European Year for combating waste. The Innovative Procedural Protocol for sustainability and global health from farm to fork engages an economic/social virtuous circle involving all stakeholders, defining an innovative orientation (which is inserted into the Task Force
14
Models for the reduction of food waste of the Ministry of the Environment) and is a priority of action in the framework of social challenges and of new paths of the regional strategy based on smart specialization.
The Innovative Procedural Protocol for sustainability and global health from farm to fork engages an economic/social virtuous circle involving all stakeholders, defining an innovative orientation (which is inserted into the Task Force Models for the reduction of food waste of the Ministry of the Environment) and is a priority of action in the framework of social challenges and of new paths of the regional strategy based on smart specialization.
Several procedural/regulatory/management options can be adopted: tax law and corporate responsibility for inclusion of bonuses and rebates for businesses and consumers; regulation of discounted sales (when a product is close to expiring or has a defect, the discounted price to 50% or even less); simplification of the endorsements on food labels for expiration but with only two dates, one of the trade deadline (use by), the other on consumption (best before); modification of rules for public procurement and catering services of hospitality and establishing programs and courses of food education, economy and home ecology. Training on supply chain losses in schools and political initiatives are possible starting points to change people’s attitudes towards the current massive food waste (FAO, 2011).
1.3- Food waste reduction initiatives in Europe
Several initiatives to prevent food waste throughout the food chain have already been rolled out in many European countries. There are many organizations and action initiatives in the world aimed at the reduction and/or recuperation of food products that can no longer be sold but are still edible. Few examples are: Banco Alimentare, the Buon Samaritano, Società del Pane Quotidiano, Last Minute Market and Buon Fine Coop in Italy. FareShare, WRAP, This is Rubbish, Love Food Hate Waste and Keep Britain Tidy in Great Britain; United Against Waste and Foodwaste.ch in Switzerland; The Zero Hunger Challenge, City Harvest and Food Schift in the United States; Mesa and del Sesc in Brazil; Plataforma Aprofitem els Aliments in Spain; Satisfeito in Portugal; Stop Wasting Food and United against food waste in Denmark; MTT in Finland; Hungarian Foodbank Association; OzHarvest in Australia; Ademe campaign in France; Agriculture and Consumer Protection and Save Food initiative in Germany.
15
In 2015, Fedération Européenne des Banques Alimentaires (FEBA) distributed 2,9 million meals every day (equivalent to 531 000 tons of food) to 5,7 million people. 1.4- Shelf-life extension as possible solution to reduce food waste
“Shelf Life” is the period of time during which a food retains acceptable sensory characteristics, nutritional value, and safety. The Shelf Life concept is almost always referred to the commercial life of packaged food products but it is well known that Shelf Life is affected by the food, the package, and the environment (Waletzko & Labuza, 1976, Labuza & Taoukis, 1990; Fu & Labuza 1993 and 1997; Nelson & Labuza 1994; Labuza &Szybist, 2001; Lee et al. 2008) and the rate at which the food quality decay results from the integrated effects of formulation, processing, packaging and storage conditions. When food exceed shelf life become a waste to be disposed, and it increase the environmental, economic and social impacts.
The distances that foods products travel are huge nowadays and, consequently, transport is considered to be no more than a storage on wheels/ships/wings. Recently, an Italian survey by Accenture-SDA Bocconi (May 2011) stated that more than 78% of the logistic costs are due to transports and warehouse management. Transport systems have significant impacts on the environment, accounting for between 20% of world energy consumption (Pagani et al., 2015). Greenhouse gas emissions from transport are increasing at a faster rate than any other energy using sector (Energy Council, 2007). Therefore, extending the commercial life of a food or a beverage might mean an optimization of the supply chain. The SLE is obtained thought:
- product reformulation with the use of natural ingredients that increase its stability;
- the use of packaging innovation;
- the use of mild technologies that preserve sensorial and nutritional food characteristics.
The topics of global sustainability, sustainable development and sustainable packaging are big issues of daily debate, but still represent a big challenge for the developed countries (Verghese et al., 2015). In fact, the definition of smart and green food products and chain delivery systems, definitely fulfils the key objectives of Horizon 2020. Guidelines for the management and reduction of food losses falls within the "smart and green" Horizon 2020 approach and is functional in order to eliminate an information gap that precludes the implementation of the triple bottom line (People-Planet-Profit) social, economic, environmental sustainability.
16
1.5- The objective of the research
The present PhD project is included in a national project PRIN 2012 “Long Life High Sustainability” in which the Department of Economics of Foggia’s University is involved. This project is aimed to match a Shelf Life Extension (SLE), due to a formulation, processing or packaging innovation (developed by other food technologists from other Research Units), to the possible increase of food product global sustainability along the entire supply chain, from farm to fork. Several studies, demonstrated that a SLE can be real important or even conclusive in contrasting two main issues which can be detrimental for the overall sustainability of a product: “Food Loss” and “Chain Fails” (Amani and Gadde, 2015). Learning how to estimate the SLE in relation to an increase of sustainability, can represent a true improvement in the task of designing new technological solutions, providing real benefits to the food companies, to the consumers and the environment. Secondly the project is aimed to assess the social impact of food waste considering the largest part of it: household’ food waste. In this regard, the activities focused on the analysis of cosumer’s attitude, habits and behaviour that minimize food waste. The SLE could reduce food loss along the entire supply chain, with the possible improvement in logistics. Therefore, the measure of the SLE impact on logistics becomes crucial.; thus this project is aimed also to evaluate the logistic improvement aspects. In particular different scenarios, characterized by some interesting issues, such as the type of transport and distance, transport refrigeration temperature, as well as supermarket refrigeration were taken into account. The present project is arranged as follows: the first part of the research project activities will allow to set up procedures and tools to understand some behaviours of the consumers as far as food losses are concerned. In this session the research activities lead to a useful archive of information concerning the food consumption habits of the selected food items. Furthermore a social implications of food waste related to food security and what it would be happen if food losses were reduced were analyzed. In the second part of the work an environmental impact analysis of new technologies and new solutions in order to reduce energy burdens and food losses was carried out. This part of the study, is aimed to highlight problems and opportunities related to the introduction of innovation through the elaboration of a set of technical-economic indicators connected to the product innovation.
The analysis is based upon the use of the Life Cycle Thinking approach “from cradle to grave" that seeks the energy and environment production process impact improvement (Toepfer, 2000). In the third step, the supply chain was simulated by
17
means of simulation model in order to highlight the impact of product SLE and to assess the energy and food waste potential savings reducing cooling temperature in the supermarkets. The environmental and economic sustainability was assessed considering three product items: olive paste and extra-virgin olive oil. The evaluation of SLE impact on logistics was carried out simulation fresh cut salad supply chain. These products were selected due to the perishability.
References
Pegah Amani and Lars-Erik Gadde (2015). Shelf life extension and food waste reduction Proceedings in System Dynamics and Innovation in Food Networks 2015. ISSN 2194-511X
Baldwin C.J. (2009). Sustainability in the Food Industry, Wiley-Blackwell, ISBN 978-0-8138-0846-8
Barilla Center for Food and Nutrition, (2012) Food Waste: causes impact and proposals. Milano: BCFN.
Buzby, J.C., Hyman, J., Stewart, H., & Wells, H. F. (2011). The value of retail- and consumer-level fruit and vegetable losses in the united states. Journal of Consumer Affairs, 45(3): 492-515
Fao,(2013) Food wastage footprint, Summary Report. ISBN 978-92-5-107752-8 Fao,(2011) The State of Food Insecurity in the World.
Fu, B., Labuza, T.P. (1993). Shelf life prediction: theory and application. Food Control, 4(3): 125-133.
Fu, B., Labuza, T.P. (1997). Shelf life testing: procedures and prediction method. In Quality of Frozen Food ed.in “Fresh Point Magazin”, Il sole 24 Ore, Milan, pp. 3-4. Garnett, T. (2008). Cooking up a Storm: Food, Greenhouse Gas Emissions and our Changing Climate. Food Climate Research Network, Centre for Environmental Strategy, University of Surrey, UK.
Graham-Rowe E., Jessop D.C., Sparks P. (2014) Identify motivations and barriers to minimizing household food waste. Resources, Conservation and Recycling 84: 15-23. Griffin, M., Sobal, J., & Lyson, T. A. (2009). An analysis of a community food waste stream. Agriculture and Human Values 26(1–2): 67–81.
HLPE (2014). Food losses and waste in the context of sustainable food systems. A report by the High Level Panel of Experts on Food Security and Nutrition of the Committee on World Food Security, Rome 2014.
Labuza, T.P., Szybist, L.M. (2001). Open dating of foods. Trumbull: Food and Nutrition Press, Inc.ISBN: 0-917678-53-2
Lee D.S., Yam K.L and Piergiovanni L. 2008.Shelf life of packaged food products. In Food Packaging science and technology, D.S. Lee, Ed., 480-506. Boca Raton, FL: Taylor & Francis. Publishers Inc.
Labuza, T.P. and Taoukis, P.S. (1990). The relationship between processing and shelf life. In Foods for the ‘90s, ed. G.G. Birch, G. Campbell-platt, M.G. Lindley, 73-106. London: Elsevier Applied Science
18
Martinet, V. (2012). Economic theory and sustainable development: What can we preserve for future generations. Oxford: Taylor and Francis.
Nelson, K.A. Labuza T.P. (1994). Water activity and food polymer science: implications of the state on Arhenius and WLF models in predicting shelf life. Journal of Food Engineering, 22: 271-289.
Parizeau K.,Von Massow M., Martin R.(2014). Household-level dynamics of food waste production and related beliefs, attitudes, and behaviours in Guelph, Ontario. Waste Management 35: 207-217.
Pearson D., Friel S., Lawrence M. (2014). Building environmentally sustainable food systems on informed citizen choices: evidence from Australia. Biological Agriculture & Horticulture 30(3): 183-197.
Schneider F. (2007) Considerations on Food Losses in Life Cycle Approach of Food Supply Chain. In Eidgenössiche Technische Hochschule Zürich: From Analysis to Implementation. 3rd International Conference on Life Cycle Management, 27-29 August 2007, Zurich, Switzerland. Abstract, pp.89-90.
Scott Kantor L., Lipton K., Manchester A., Oliveira V. (1997). Estimating and Addressing America’s Food Losses. Food Review Jenuary-April.
Segrè, A. (2011), What is needed is a more sustainable agro-food system that reduce [sic] waste, in “Fresh Point Magazin”, Il sole 24 Ore, Milan, pp. 3-4.
Stenmarck, Å., Jensen, C., Quested, T., Moates, G., (2016). Estimates of European food waste levels IVL Swedish Environmental Research Institute, Stockholm,
Sweden, Report number: C186, ISBN 978-91-88319-01-2. DOI:
10.13140/RG.2.1.4658.4721.
Toepfer K., (2000). Evaluation of Environmental Impacts in Life Cycle Assessment. UNEP “United Nations Environment Programme Division of Technology, Industry and Economics Production and Consumption Branch.
Verghese, K., Lewis, H., Lockrey, S., Williams, H. (2015) Packaging's Role in Minimizing Food Loss and Waste Across the Supply Chain. Packaging Technology and Science, 28 (7), pp. 603-620.
Waletzko, P and Labuza, T.P. (1976). Accelerated shelf life testing of an intermediate moisture food in air and in oxygen free atmosphere. Journal of Food Science, 41(6): 1338-1344
Wells, H. F. Hyman, J. Buzby, J.C.(2014) Estimated Amount, Value, and Calories of Postharvest Food Losses at Retail and Consumer Levels in the United States. Economic Research Service, Washington, DC.
Sitography
http://www.europarl.europa.eu, 2011
2. SOCIAL IMPACT
In this chapter the author firstly will analyze the social impacts of food losses along the food chain: the methodology is based on the elaboration of a dis-opportunity cost taking into account food waste and losses of Kcals and Kcals/required per day (to cope
19
with the energy expenditure), U.A.A. (Utilized Agricultural Area) cost. Findings are aimed to highlighting how the food losses reduction is crucial for an intra/inter-geninter
rational equity. Secondly belief, attitudes and behaviours releted to food waste at the household level among Italian consumers were analyzed. Furthermore, more insights concernig the possible drivers that influenced consumer behaviour towards food waste were provided.
Some some parts of this research were taken from:
Fiore M., Contò F., Pellegrini G. (2015). Reducing Food Losses: A (Dis)-Opportunity Cost Model. Revue Of Studies On Sustainability 1: 151–166.
2.1- Reducing food losses: a (dis)-opportunity cost model 2.1.1- Introduction
In this session, the authors focus on the social-economic impact of food losses and waste trying to model a possible (dis)-opportunity cost: the starting point of the model starts from the notion of opportunity cost (Buchanan, 1969; Baumol and Blinder, 2007). Basically, the concept expresses the basic relationship between scarcity and choice and the opportunity cost of a choice refers to the value of the next best alternative or opportunity (Buchanan, 1969; Arnold, 2008). In microeconomic theory, the opportunity cost of a choice is the value of the best alternative forgone, in a situation in which a choice needs to be made between several alternatives given limited resources. Indeed, over the centuries scholars and researchers gave insights to deal with the essential problem of scarcity that arises from the impossibility of fitting between the demand of necessary goods and services and the limited resources. In this context of scarcity, it is essential to try to set up a priorities scale between possible alternatives.
Therefore, the opportunity cost is a tool aiming at investigate the real value of the choices in the light of the benefits foregone by the taken decisions and so to measure all the costs of an opportunity foregone, in monetary and non-monetary terms. Other studies define the opportunity cost as an avoided loss or avoided carbon emissions (Damnyag et al., 2011; Golub et al., 2009).
In our study, the (Dis)-opportunity cost model is a theoretical and speculative elaboration taking into account food waste, Kcals/required per day (to cope with the energy expenditure), U.A.A. (Utilized Agricultural Area) cost.
20
2.1.2- Methodology and Results The assumptions are as follows:
- 1 g of food losses can be measured with the lost Kcal/capita/day value (FAOSTAT data);
- the actual daily food requirements range mostly between 1,500–2,000 kcal/capita for adult females and 2,000–2,600 kcal/capita for adult males, and weighted means for entire populations are rarely above 2,000 kcal/person (Smil, 2010);
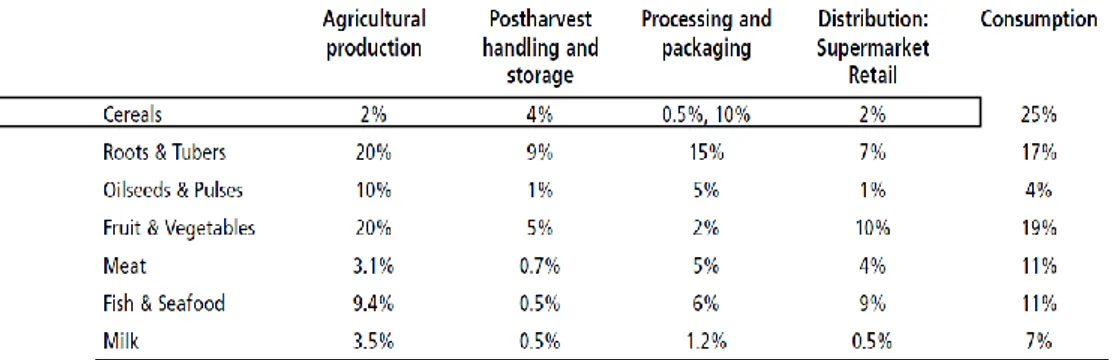
- for each commodity group corresponds a percentage of food waste along the FSC (Gustavsson et al., 2011).
Table 2.1.1 shows estimated/assumed waste percentage for each commodity group of the FSC for Europe incl. Russia. In this study, cereals commodities was considered and the consumption level was the starting point for the assessment of dis-opportunity cost.
Table. 2.1.1 – Estimated/assumed waste percentage for each commodity group of the FSC for Europe incl. Russia
Source: Gustavsson et al., 2011
The following steps were carried out for the calculation of dis-opportunity cost:
1. Food waste amount = 25% of Production for human consumption (FAOSTAT data) [this value was considered per day].
2. Conversion of the total waste amount from ktonnes to grams.
3. Conversion of the total waste amount (in grams) in Protein kcal/g by using Atwater specific factors for selected foods (Merrill & Watt, 1973): in particular, an average equivalent value related to grain products was considered (FAOSTAT, 2003).
4. The amount obtained according to point 3 was rationed at 2.000 kcal that is average daily food requirements for human need (Smil, 2010).
21
2.1.3- Discussion
The results highlight the different steps carried out: in particular, the table below shows considered variables and values, calculated amounts and sources of the variables in order to calculate the (Dis)-opportunity cost(Table 2.1.2).
Table. 2.1.2 – Variables, values, amounts and relative sources to calculate the (Dis)-opportunity cost
Variables Values Amounts Source
Production for
human consumption
126.734,00 ktonnes 126.734,00 ktonnes FAOSTAT (2011) Estimated/assumed waste percentage for cereals 25% 868.041.000,00* g Gustavsson et al., 2011 Average equivalent in proteins related to grain products 3,23 2.803.772.430,00 kcal FAOSTAT (2013) Average daily food
requirements for human need 2.000 kcal/capita/day Slim, 2010 Dis-opportunity cost 1.401.886,2 n°
Source: our processing on indicated source *This value was considered per day in grams
The following steps was carried out for the calculation of U.A.A. cost:
1. European total production and total U.A.A. of cereals amount were considered (FAOSTAT, 2011).
2. Average yield obtained by the ratio between total production and total U.A.A was calculated.
3. U.A.A. cost was accounting by considering the ratio between production for human consumption wasted and average yield above-mentioned.
Table2.1.3 – Variables, values and relative sources to calculate the (Dis)-opportunity cost in terms of UAA cost
Variables Values Source
Total Production 561.729,00 ktonnes FAOSTAT (2011)
Production for human
22
Total U.A.A. 116.270.137,00 ha FAOSTAT (2011)
U.A.A. cost 6.558,046 ha
Source: our processing on indicated source
Finally, if reduction of food waste is implemented along the FSC, the society could obtain a decreasing of undernourishment equal to 1.401.886,2 n° persons with a UAA cost equal to 6.558.046 ha. These values are to be considered very carefully and with much caution; they can represent only the huge extent of the issue of food waste and correlatively of the undernourishment. The research highlights the importance of the intangible aspects of the environmental issues too. Academic and policy implications are related to the advantage deriving from the understanding of the multi-sectorial perspective and scenarios (environmental, economic, social, ethics, human aspects and so on).
The final aim of this study is the measurement in terms of not-possibility to gain a best position of the population well-being: when there are food waste and losses, we give up to feed a share of population. But if the undernourishment decreases by means a re-consideration of the system, therefore the opportunity cost of having a minor undernourishment will be the time I could spend searching new solution to cope the hunger issues and the money I could earn not saving the food from waste and losses along the agri-food chain at consumption and pre-consumption stages.
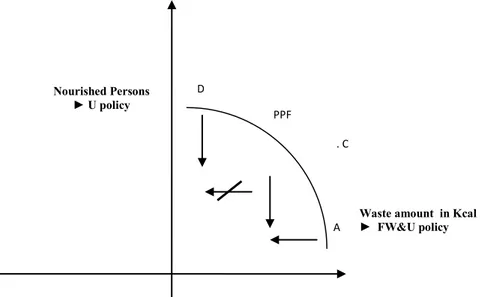
The Fig. 2.1.1 below shows the (Dis)-opportunity cost model in terms of policies. A country can decide to implement either policies to reduce food waste and losses and correlatively the undernourishment (FW&U), or policies to reduce only the undernourishment (U). By devoting all resources to FW&U (A), the country can reduce food waste and undernourishment together not only undernourishment. By devoting all resources to U policy (B), the country can reduce only undernourishment and increases food waste. However, the trade-off, and therefore the opportunity cost, is not here constant. The line that connects the points ‘A’ and ‘B’, which respectively represent the maximum decreasing attainable by devoting all our resources to one end or another, is the production possibility frontier (PPF) which shows the combinations of two policies that can be produced by using all the resources at our disposal (Arnold, 2008).
23
Fig. 2.1.1 – A (Dis)-opportunity cost model in terms of policies. Source: our processing
At the point ‘A’ we implement FW&U policies and none U policy. As we move from ‘A’ to ‘B’ we implement U policies to reduce undernourishment decreasing the percentage of undernourishment at the opportunity cost of FW&U policies that should have the chance to reduce FW+U. Besides some limitations, above highlighted that are largely typical of explorative researches, this paper has the merit of providing some useful insights on the close relations between food waste and undernourishment, between policy choice and ethics behavior.
Finally, the opportunity cost allows to understand the real cost of our choices according to the best possible alternative we have to sacrifice. Opportunity costs are generally not considered as the choice is concentrated on the benefits and direct costs of our choice, without taking into account what we are giving up. Nevertheless, measuring this (Dis)-opportunity cost is not immediate owing to many different factors such as the ability of identifying which is the best alternative to a choice and evaluating all the potential monetary and non-monetary benefits foregone, are to be taken into account. Besides a certain degree of subjectivity is involved in the measurement, because the evaluation is often oriented towards future events whose outcomes are uncertain and because of the different perspective and perception of the stakeholders involved (Buchanan, 1969).
Developing a dis-opportunity cost taking into account waste Kcal and Kcal/per day required (for balanced nutrition of a person) and UAA cost can increases the efficiency of the entire supply chain in terms of production, logistics and distribution,
D
PPF
A Nourished Persons
► U policy
Waste amount in Kcal ► FW&U policy . C
24
quality and healthy food, thus representing an element of improvement as regards the intra/inter- generational equity.
2.1.4- Conclusions
Reducing Food Losses and wastes and optimization of the logistics is for the EU and not only, a key challenge to increase competitiveness, sustainability, equity of the agri-food sector. The consumer and business level approach is essential as agri-food losses and waste occur during the entire supply chain and, in quality of recipients of food products, it is important to take into account specific methods to affect their behaviors. The results of this research can be therefore strategic in the current context. The definition of a (dis)-opportunity cost for the management and reduction of food losses falls within the smart and green Horizon 2020 approach and is functional in order to eliminate an information gap that precludes the implementation of the triple bottom line: social, economic, environmental sustainability. Therefore, the methodological approach presented in this paper is in line with the international and national policies and existing literature (Segrè, 2011a, b; FAO, 2011; BCFN, 2013; NRI, 2009; Parfitt et al., 2010; Schneider, 2007) aiming at analyzing and investigating the food losses challenges and impacts.
Food scraps or losses represent irrational use of resources producing a negative direct impact on the income of entrepreneurs and consumers and in special way on the rate of undernourishment of the population; a coordinated strategy that improves the efficiency of the entire supply chain is, therefore, required. A rational use of resources at consumption level and optimization of production and distribution logistics is an improvement of fundamental usefulness for the companies and for the entire socio-economic system in the light of the intra/inter-generational equity too. In fact, it is clear that we need to find new models to address behavior consumer since even the most health conscious people are not always able to change their eating habits and attitudes which are influenced by advertising and other forms of promotion on a daily basis. Price issues may also influence people’s choices, especially those who are not able to evaluate the alternatives of purchase correctly due to lack of information. A further element of novelty/originality can be arise from the correlation of the shelf life extension with the reduction of food losses; additional steps are related to develop a Model Food Losses Break Point with an index of potential reduction in food losses. The starting point is creating a model with a value indicating the maximum acceptable loss, expressed in volume of production, which is part of the normal management of
25
the firms. The index of potential reduction in food losses is a value (in percent) according to the actual amount of losses and a value that ranges in a predefined range depending on the weight assigned to the relevant sub-fund of the supply chain. Here it is not possible to define this model since available and complete data to be tested and analyzed are necessary.
Intergenerational equity is a key concept articulated as a concern for future generations (Golub et al., 2013) as a global framework for sustainable development is based on its reinterpretation that recognizes the interdependence of humans with the rest of the ecosphere (Imran et a., 2014; Martinet, 2012; Alvarez-Cuadrado and Van Long, 2009). Enhancing the environment, human well-being and social equity could be possible by means an inter-disciplinary approach in a mutual process that emphasizes strategic decision-making. As evocated by all international organizations, food represents the second most important factor of global sustainability (following the energy industry): furthermore, it is therefore a crucial driver to reduce its economic-social-environmental impact since that many issue can be solved taking in account this challenges. In this context, the family, an important access key for addressing the problem, should be supported by other institutions (starting from schools) and private businesses such as food companies and distribution channels, as well as media tool. Reference
Alvarez-Cuadrado, F., & Van Long, N. (2009). A mixed bentham-rawls criterion for intergenerational equity: Theory and implications. Journal of Environmental Economics and Management, 58(2), 154-168.
Arnold, R.A. (2008).Microeconomics. Sixth Edition. Mason, OH: South-Western Cengage Learning.
Baumol, W.J. and Blinder, A.S. (2007). Microeconomics: Principles and policy. Tenth Edition. Mason, OH. Thomson South-Western
BCFN Barilla Center for Food and Nutrition, (2012) Food Waste: causes impact and proposals. Milano: BCFN.
Buchanan, J. M. (1969). Cost and Choice. Chicago: Markham
Damnyag, L., Tyynela, T., Appiah, M., Saastamoinen, O., Pappinen, A. (2011). Economic cost of deforestation in semi-deciduous forests – a case of two forest districts in Ghana. Ecological Economics, 70: 2503–2510.
FAO (2011). The State of Food Insecurity in the World. Rome: FAO. FAO (2013). Food wastage footprint, Summary Report. Rome: FAO.
26
Golub, A., Hertel, T., Lee, H.-L., Rose, S., Sohngen, B. (2009). The opportunity cost of land use and the global potential for greenhouse gas mitigation in agriculture and forestry. Resource and Energy Economics, 31: 299–319.
Golub, A., Mahoney, M., & Harlow, J. (2013). Sustainability and intergenerational equity: Do past injustices matter? Sustainability Science, 8(2): 269-277.
Gustavsson, J., Cederberg, C., Sonesson, U., Otterdijk, R. van & Meybeck, A. (2011). Global Food Losses and Food Waste. Extent, Causes and Prevention. Study conducted for the International Congress Save Food!, at Interpack 2011 Düsseldorf, Germany, Rome: Food and Agriculture Organization of the United Nations.
Imran, S., Alam, K., & Beaumont, N. (2014). Reinterpreting the definition of sustainable development for a more ecocentric reorientation. Sustainable Development, 22(2): 134-144.
Martinet, V. (2012). Economic theory and sustainable development: What can we preserve for future generations. Oxford: Taylor and Francis.
Merrill, A.L. & Watt, B.K. (1973). Energy value of foods: basis and derivation. Agriculture Handbook No. 74. Washington, DC, ARS United States Department of Agriculture.
Natural Resources Institute (2009). Framework paper on postharvest loss reduction in Africa. Rome: NRI.
Parfitt, J., Barthel, M. & Macnaughton, S. (2010). Food waste within food supply chains: quantification and potential for change to 2050, Phil. Trans. R. Soc., 365: 3065-3081.
Schneider, F. (2007) Wasting food – An insistent behavior. BOKU- University of Natural Resources and Applied Life Sciences, Vienna, Austria
Segrè, A. (2011), What is needed is a more sustainable agro-food system that reduce [sic] waste, in “Fresh Point Magazin”, Il sole 24 Ore, Milan: 3-4.
Segrè, A. and L. Falasconi (2011), Il libro nero dello spreco in Italia: il cibo, Edizioni Ambiente.
Smil, V. (2010). Improving Efficiency and Reducing Waste in Our Food System. Environmental Sciences, 1(1): 17-26.
Sitography
27
2.2- Attitude toward food waste reduction: the case of Italian consumers
The purpose of this session is to investigate the dynamics of household food waste, analysing food waste minimization from a food-related Italian behaviour perspective, in order to define which are the principal factors determining food losses. Furthermore, the author wants to verify the influence of Shelf Life Extension (SLE) on food-related behaviour aimed to minimize food waste, as well as to build a consumer behaviour model.
2.2.1Food waste and consumer’s behaviour
There is no doubt that to move towards a sustainable future involves a profound transformation of the food sector, because this food style in our society has proved harmful to health and environment (Pellegrini et al., 2016). Food scraps or losses represent irrational use of resources producing a negative direct impact on the income of entrepreneurs and consumers; therefore, a coordinated strategy that improves the efficiency of the entire supply chain is required (Garnett, 2008). Worldwide, 1.3 billion tonnes of food is lost or wasted annually in production, manufacture, distribution and human consumption (FAO, 2016). There are three broad stages of the food supply chain (i.e., at the farm, retail, and consumption levels). Although many of the causes are similar across developed countries (Quested et al., 2013), such as food that has pass its ‘use-by’ dates, some factors have greater variation, such as the socio-demographic characteristics (Marangon et al., 2014), and cultural traditions manifested through individual behaviour (Nassivera e Sillani, 2015).
Stenmarck et al., (2016) assessed the percentage of food waste in 2012, by sector (among 28 European countries): at households level the higher food waste percentage occurs (53%) following by Processing (11%), Food Service (12%) and Production (11%) phases.
There are several reasons that drive food loss and waste prevention (Buzby et al., 2011). The first reason is due to the growth of world population, thus more food is needed to ensure food security. The second reason is that food waste represents significant economic resources invested throughout food’s entire lifecycle to produce, store, transport, and otherwise handle something that does not ultimately meet its intended purpose of feeding people.
Stenmarck et al. (2016) found that costs associated with edible food (in EU-28, 2012) is equal to 11334 € per tonne. Particularly the cost at households level is equal to 3529 € per tonne (31.1%), 3148 € per tonne (27,8%) for food service phase, 2790 € per
28
tonne (24.4%) in wholesale and retail phase, 1490 € per tonne (13.1%) in processing phase, and 399 € per tonne (3.5%) in production phase. The third reason is that food production generates negative externalities such as production of GHG emissions (Fiore et al., 2015).
According to FAO (2013) and Griffin et al. (2009), consumers are the biggest contributors in the world to the total volume of food waste: the carbon footprint of wastage in the consumption phase reaches 37% of total, whereas consumption only accounts 22% of total food wastage.
Nowadays ethical values guide the behavior of the all kind of buyer (Contò et al. 2015; Burkhardt, 2012; Olsen and Banati, 2013, Olsen et al., 2010); indeed several researches focus on the decisive role of ethics that is health, quality, trust, environmental welfare aspects in influencing consumer behavior (Krystallis et al., 2012; Liu and Kwon, 2013; Mcdonough et al., 2014; Munro, 1995; OECD, 2008; Young et al., 2010). Others (Guido et al., 2010) highlighted ethics personal beliefs on what is right or wrong can be considered the main motivator of purchasing intention. Few authors have investigated the consumer behaviour on food’s choice and the main reasons of wasting food (Doron, 2012; Lyndhurst, 2007; Parfitt et al., 2010; Stefan et al., 2012; Williams et al., 2012), in Italy (Capone et al., 2014; Segrè and Falasconi, 2008 and 2011).
The main reasons of wasting food are attributed to:
shopping routine such as buying and/or cooking too much, failing to compile or comply with a shopping list, failing to carry out a food inventory before shopping, impulse;
planning routines: not planning meals in advance.
purchasing behaviour: price consciousness and sale proneness, store type (food wastage is higher for families that purchase from supermarkets and hypermarkets) (Marangon et al., 2014)
low public awareness of the negative impact of household food waste
Williams et al., (2012), studied the reasons for food waste in household and especially how and to what extent packaging influences the amount of food waste. They found that about 20–25% of the households’ food waste could be related to packaging. It is clear that a significant improvement in the capacity of estimating the food losses is required, protocols and procedures are needed, as well as actions towards the consumers’ education are very crucial (Schneider 2007). In this context, this paper is aimed to study food waste minimization from a food-related behaviour perspective
29
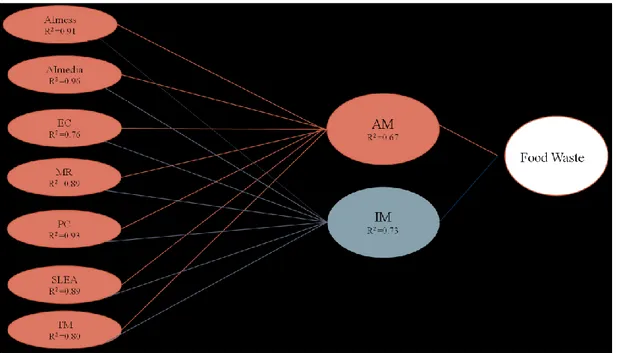
and build a consumer’s behaviour model. According to Purchase Behaviour Model (PBM), Intentions (IM) and Attitude to Minimize (AM) influence consumers’ behaviour and in turn they are influenced by some motivations to minimize food waste (Homer &Kahle, 1988; Thogersen e Grunert-Beckmann, 1997; Bredahl, 2001; Nassivera e Sillani, 2015).
The Social learning theory (Bandura, 1977c) affirms that people observe and imitate social models acquiring some behaviours. According to this theory, behaviours are determined by expectancies and incentives. People will change their behaviour if they appreciate (in terms of threats reduction) perceived effects of changed lifestyle.
The Broken Windows Theory states that people are willing to violate some norms if they observe others are violating norms as well (Keizer et al., 2008; Alford, 2012; Engel et al., 2014; Aiyer et al., 2015). The Theory of Normative Conduct (TNC), discern two types of norms that influence human actions: injunctive norms (what most others approve or disapprove) and descriptive norms (what most others do) (Cialdini et al., 1990). The descriptive norm determines behaviour, but if it contradicts the injunctive norm, the behaviour effect is cancelled.
According to this approach, waste’s absence and the intention to minimize can be considered the injunctive norm, instead observed waste is the descriptive norm. If the consumers waste increases, consumers’ willingness to waste increases as well. In this context, the Theory of Planned Behavior (TPB) can gives important insights concerning the purchase behavior (Ajzen, 1991; Bandura, 1997;a 1997b). According to this theory, human behaviours are managed not only by personal attitudes, but also by social pressures and a sense of control (Ajzen, 2011a; 2011b).
The above-mentioned theories suggest the use of constructs in order to measure observed causes of wasting food. Furthermore, the study is aimed to verify if Shelf Life Extension (SLE), realized by food firms, can have an effect on food-related behavior aimed to food waste minimization. This was realized through the measure of SLE advantages’ awareness. Among household food waste minimization barriers there is a liability waiver (Graham-Rowe et al., 2014); this means that consumers attribute food waste causes to others. According to Graham-Rowe et al., (2014) and Stefan et al., (2012), household food management determines food waste related behaviours. In this paper the authors propose a measure scale for attitude and intention to minimize, referring to food management.
30
2.2.2Material and methods
Data were collected from April 2015 to January 2016 by means of a web-based questionnaire using an on line software. Items were developed by the authors based on previous studies. (Stefan et al. 2012; Spielmann e Richard, 2013; Alford e Biswas, 2002; Balderjahn et al., 2013; Black, 2004; Graham-Rowe et al., 2014; Williams et al., 2012, Nassivera e Sillani, 2015). Pilot test with 12 respondents was developed to support questionnaire design with the objective, to recognize the limits of the questionnaire, and to know whether the participants understand the items. Minor revisions were made to pilot survey before distributing the final questionnaire.
The questionnaire was developed in Italian, translated in English for its replicability, and distributed to Italian consumers through online platforms (Email, Facebook, LinkedIn). The survey was structured into 111 items connected to 9 selected constructs, evaluated with Likert scales from “strongly disagree” to “strongly agree” anchoring the scale. The constructs were selected according the following criteria:
1. Price Consciousness (PC): basing on Neff et al. (2015) study, the attention to waste of money influences consumer behaviour related to food waste. La Price Consciousness was measured with a 10 items scale proposed by Alford e Biswas (2002).
2. Environmental Concern (EC): according to Roberts & Bacon (1997), Williams and Wikström (2011), Williams et al. (2012) e Quested et al. (2013), environmental concern can affect consumer behaviour related to food waste. The intensity of environmental concern was assessed through 8 items scale proposed by Balderjahn et al. (2013).
3. Moral and other-orientated Reasoning (MR): according to Conner and Armitage (1998), Largo-Wight et al. (2012), Graham-Rowe et al. (2015), and The Prosocial Personality Battery of Penner et al. (1995) and Penner (2002) moral and other oriented reasoning can have an effect on consumer behaviour. The degree of influence was calculated using a 6 items scale according to Black (2004).
4. Time Management (TM): according to Marangon et al. (2014), Porpino (2016) time management influence consumer behaviour. The intensity of influence was assessed through 3 items scale proposed by Black (2004).
31
5. SLE Awereness (SLEA): basing on the assumptions of Kantor et al. (1997), Terpstra et al. (2005), Parfitt et al. (2010), Koivupuro et al. (2012), Williams et al. (2012), Abeliotis et al. (2014), Neff et al. (2015) and Porpino et al. (2015), the authors consider the awareness of shelf life extension advantages influence consumer behaviour. This aspect was measured with a 6 items scale according to Graham-Rowe et al. (2014). The objective is to evaluate if technological innovation can be consider as a lever for food firms to influence consumers’ behaviour.
6. Advertising Involvement (AImess) (AImedia): according to Quested et al. (2013), Whitehair et al. (2013) and Porpino (2016) the advertising involvement has an effect on consumer behaviour. This aspect was measured with a scale divided into two subscale: 8 items scale for Advertising Involvement – message involvement (AImess) (Spielmann e Richard, 2013); 6 items scale for the Advertising Involvement – media involvement (AImedia). The objective is to study if:
messages transmitted by adverting influence the consumer behaviour advertising of food items can be a channel to convey messages against food
waste
7. Attitude to Minimize (AM), Intention to Minimize (IM): several authors state that household consumer behavior that determine food waste are principally related to food management (Stefan et al., 2013; Graham-Rowe et al., 2014; Porpino et al., 2015; Porpino, 2016; Stancu, 2016). The authors propose a 6 items scale for measuring attitude to minimize and intention to minimize (Graham-Rowe et al., 2014). Considering that food waste breaks a shared social norm (Cialdini et al., 1990; Cialdini et al., 1991; Cialdini and Goldstein, 2004) to reduce the tendency to give socially desirable responses, the items were carefully built and the questionnaire was individually filled (Paulhus, 1998)
A link was sent to potential respondents who were asked to forward it to friends and acquaintances (Stefan et al., 2012). A total of n=580 Italian consumers participated in the survey. In effect, the questionnaire sent through online platforms presented an initial message that urged to respond only those who were in charge of shopping or cooking (Stefan et al., 2012). During data screening, 3 cases were removed as they did not complete the questionnaire. The resulting final sample was equal to 577
32
respondents. The several steps of data analysis has been performed by using STATA 14 software for the analysis (StataCorp, 2015). Data analysis was carried out through the following steps:
Step A: descriptive statistic analysis.
Step B: internal consistency or reliability was examined considering the Cronbach's alpha coefficient (Gliem and Gliem, 2003) (α ≥ 0.9: excellent; 0.7 ≤ α < 0.9: good; 0.6 ≤ α < 0.7: acceptable; 0.5 ≤ α < 0.6: poor; α < 0.5: unacceptable).
Step C: exploratory factorial analysis (EFA) to identify the number of latent factors for constructs. The least value of the loading retained was 0.45; it was examined the sampling adequacy of items by the Kaiser–Meyer–Olkin (KMO) measure according to Kaiser (1974)(0.5≤KMO≤0.7acceptable, 0.7<KMO≤0.8 good, 0.8<KMO≤0.9 great,KMO>0.9 superb).
Step D: confirmatory factorial analysis (CFA) to test the validity of the resulting latent factors by means of a structural equation model (SEM). In the context of Structural Models of equations, it is recommended a minimum of five sample units for each observed variable up to a maximum of over 50 (Jaccard& Wan, 1996). In this study, the sample size n = 577 satisfies the required limits, for each observed variable.
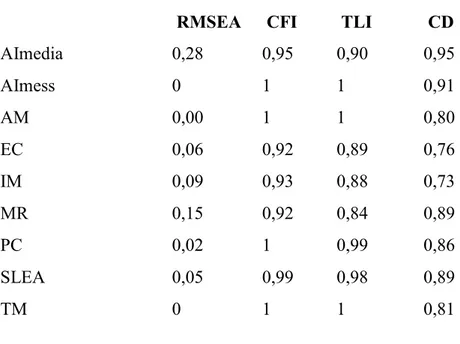
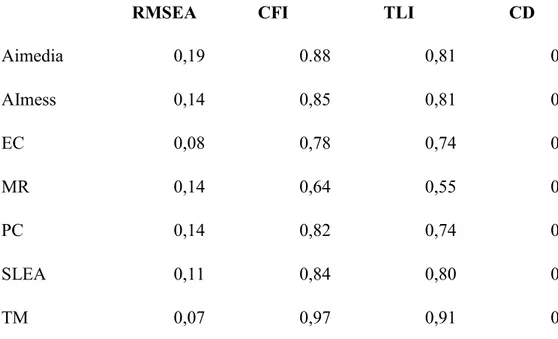
Step F: SEM’s evaluation through indices of goodness fit (1-4) and indices of validity (5-6) (Schumacker & Lomax, 2010).
1. RMSEA: Root mean square error of approximation, with a good fit less than 0.10 (Chen, et al., 2008).
2. TLI : Tucker-Lewis index, with a good fit at least 0.95
3. CD: provides information similar to the R-squared value using OLS and other forms of regression (range 0-1)
4. CFI: a comparative fit index, with a good fit at least 0.95. 5. CR: Composite Reliability, with a good validity > 0.7
33
2.2.3Results and Discussions
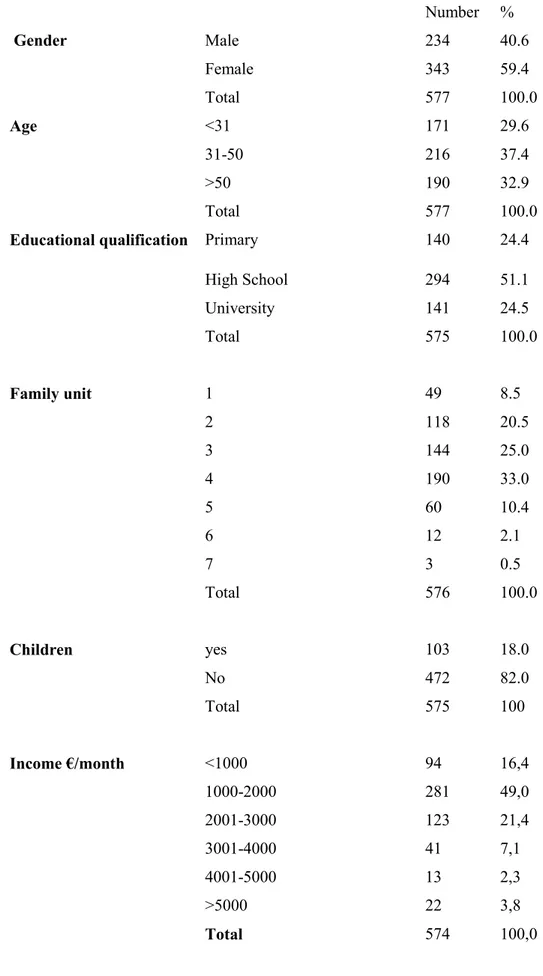
This section gives a sample description of socio-demographic characteristics (as shown in Table 2.2.1). The sample is composed by 40.60% of male and the 59.4% of female with an age ranging from 30 to 50 (37.4% of the sample), above 50 for 32.9% and under 31 for 26.9%. The frequency of interviewed families in which there is the presence of children is 18%. The 30.0% has 4 components in the family, 25.0% has 3 family units and a 20.5% of the families has 2 units. The 51.1% has high school as educational qualification. Finally, the income for 50.0% of sample ranges from 1000 € to 2000 € (Table 2.2.1). Marangon et al., (2014) found that family composition and habits are the main factors that can explaining the wastage of food: families with higher number if children have no enough time to devote to shopping and have to concentrate purchases once a week. Furthermore, consumers with higher educational qualification devote a lot of time to work.
34
Table 2.2.1-Sample description
Number % Gender Male Female Total 234 343 577 40.6 59.4 100.0 Age <31 171 29.6 31-50 >50 Total 216 190 577 37.4 32.9 100.0
Educational qualification Primary 140 24.4 Family unit Children Income €/month High School University Total 1 2 3 4 5 6 7 Total yes No Total <1000 1000-2000 2001-3000 3001-4000 4001-5000 >5000 Total 294 141 575 49 118 144 190 60 12 3 576 103 472 575 94 281 123 41 13 22 574 51.1 24.5 100.0 8.5 20.5 25.0 33.0 10.4 2.1 0.5 100.0 18.0 82.0 100 16,4 49,0 21,4 7,1 2,3 3,8 100,0