Contents lists available atScienceDirect
Tectonophysics
journal homepage:www.elsevier.com/locate/tecto
Strain monitoring of active faults in the central Apennines (Italy) during the
period 2002
–2017
Josef Stemberk
a,⁎, GianCarlo Dal Moro
a, Jakub Stemberk
a,c, Jan Blah
ůt
a, Miroslav Coubal
a,
Blahoslav Ko
šťák
a, Miller Zambrano
b, Emanuele Tondi
baInstitute of Rock Structure and Mechanics, The Czech Academy of Sciences, V Holešovičkách 41, 182 09 Prague, Czechia bSchool of Science and Technology, Geology Division, University of Camerino, Via A. D'Accorso 16, 620 32 Camerino, MC, Italy cDepartment of Physical Geography and Geoecology, Faculty of Science, Charles University, Albertov 6, 128 43 Prague, Czechia
A R T I C L E I N F O
Keywords: Active tectonics 3-D fault slip monitoring Transient fault slip acceleration Switching stress/strain state Earthquakes
The central Apennines
A B S T R A C T
We present the results of 3-D monitoring of strain along active faults outcropping in the central Apennines, where recent and historical strong earthquakes occurred, using TM-71 extensometers during the period 2002–2017. We discuss the fault slip development as well as kinematics particularly in the light of local recent seismicity. The recorded fault slip corresponds to the minimum and maximum principal stress with a SW-NE orientation and slightly dipping to SW. Moreover, the detected fault slip is non-linear and affected by remarkable transient periods of acceleration, which lasted up to several months. The recorded accelerations were induced by alternation of extensional, reverse and horizontal displacement due to switching extensional and compressional stress/strain state and coincide with periods of major seismic events that recently affected the central Apennines. This phenomenon is being investigated. In the case of the moderate L'Aquila 2009 and Norcia 2016 earthquakes, the recorded fault slips can be characterized as pre-seismic.
1. Introduction
The detection and analysis of current crustal deformations can provide valuable information regarding the rheological behaviour of crustal materials and the related seismic activity (e.g.Langbein et al., 1993;Dal Moro and Zadro, 1999;Gao et al., 2000;Liang et al., 2013). Detailed three-dimensional (3-D) monitoring of tectonic displacement on faults is useful for demonstrating the active character of a fault and establishing current displacement rates (Gosar et al., 2011).
Significant historic and recent seismic activity (Tables 1 and 2) and the many available studies on active tectonics (see ahead) make the central Apennines in Italy (Fig. 1) an excellent place to investigate ac-tive tectonic deformation. A series of high resolution 3-D extensometer TM-71 (Košťák, 2006;Klimeš et al., 2012) were installed on three se-lected active faults in this region of central Italy to register their short-term slip and transient state behaviour.
The data recorded during the period 2002–2017 on fault mirrors in the Norcia and Colfiorito areas (Fig. 2), where moderate earthquakes have recently occurred, have permitted to characterize the local recent tectonic regime. The results are discussed particularly in the light of recent seismic activity affecting central Italy (in particular, L'Aquila earthquake in 2009 and the seismic sequence of 2016 described ahead)
during monitoring period. This study was developed as a part of the European monitoring network TecNet (EU TecNet -www.tecnet.cz) set up in the framework of the COST 625 project“3-D monitoring of active tectonic structures” (Borre et al., 2003;Stemberk et al., 2003; Tondi et al., 2005).
2. Methods
The TM-71 optical-mechanical extensometer (Fig. 3) is a device used for measuring the relative 3-D displacement and angular rotation movement between two blocks separated by a discontinuity (Fig. 3b; Košťák, 1969;Klimeš et al., 2012;Marti et al., 2013). The device uses the moiré phenomenon of optical interference (Oster and Nishijima, 1963;Nishijima and Oster, 1964). Moiré patterns (Fig. 3a) appear when two identical overlapping periodic structures (Fig. 3c) undergo a small relative displacement causing the development of a series of char-acteristic macroscopic interference fringes (Košťák and Popp, 1966; Marti et al., 2013). The moiré patterns have to be transformed into the metric system by counting moiré fringes in the displacement and ro-tationfields of the glass plates, identifying the axis of symmetry and then solving a series of equations (Košťák and Popp, 1966). The dis-tance between the centres of the two glass plates is computed using the
https://doi.org/10.1016/j.tecto.2018.10.033
Received 9 April 2018; Received in revised form 28 October 2018; Accepted 31 October 2018
⁎Corresponding author.
E-mail address:[email protected](J. Stemberk).
Tectonophysics 750 (2019) 22–35
Available online 07 November 2018
0040-1951/ © 2018 Institute of Rock Structure and Mechanics, The Czech Academy of Sciences. Published by Elsevier B.V. This is an open access article under the CC BY-NC-ND license (http://creativecommons.org/licenses/BY-NC-ND/4.0/).
number of fringes and the direction of the displacement as indicated by the principal axis of the symmetry pattern (Fig. 3d). The most up-to-date and comprehensive description of the TM-71 device and its ap-plication for active-tectonic purposes was recently presented byKlimeš et al. (2012)andBriestenský et al. (2015, 2018).
Because of its peculiar characteristics, the TM-71 records both lat-eral and shear displacement as well as rotations of the blocks. This represents the fundamental methodical advantage of the TM-71, as all possible relative movements of the blocks are measured with high ac-curacy in the order of 0.0125 mm. The angular deviation between two blocks separated by a discontinuity, i.e. their relative rotation, can be measured at a resolution > 3.2 × 10⁻⁴rad (≈0.018°).
The advantages and limitations of the extensometer are well defined given its installation at a number of sites long since, e.g. in the Czech Republic, Germany, Slovenia, Slovakia, Poland and the Arctic (e.g. Kontny et al., 2005;Gosar et al., 2009;Šebela et al., 2009;Stemberk et al., 2010; Briestenský et al., 2015; Hoppe et al., 2015; Stemberk et al., 2015). It has been shown that seasonal and climatic variations can be detected and separated from the recorded movements (Briestenský et al., 2010). The dilatation and contraction of the TM-71 extensometer is analytically computed and systematically removed. It is possible, therefore, to obtain accurate records of ongoing gravitational or tectonic processes. The suitability of this device for geodynamic monitoring has been corroborated by comparisons with the results obtained using other monitoring methods as horizontal tiltmeters, geodetic measurements, ground water levelling (Košťák et al., 2011).
Recorded fault displacement can be visualized in Cartesian co-ordinate system x,y,z or s,h,p (reference system adapted to individual faults and reflecting fault inclination). The h axis corresponds to the fault direction and represents strike-slip displacement (dextral or si-nistral), axis p is perpendicular to the fault plane and represents the fault (contraction or extension), while the s axis is along the fault plane and represents normal or reverse displacement.
3. Tectonic setting and monitoring sites
3.1. Seismotectonic framework and recent seismic sequences
The central Apennines is the orogenic expression of the convergence and collision between the continental margins of the Corsica-Sardinia block and the Adriatic block taking place since the Oligocene (e.g.Cello et al., 1997and references therein). The compressional features, folds and thrusts, show a general east vergence involving a Meso-Cenozoic succession associated with continental margin sedimentation in the Trias-Paleogene and foredeep-foreland migrating eastward during Miocene-Pliocene (e.g.Bigi et al., 2012;Cosentino et al., 2010;Vezzani et al., 2010). During this period, tectonically-controlled sedimentary basins (i.e. foredeep and piggyback basins) were developed (e.g. Patacca et al., 1992; Cipollari and Cosentino, 1995; Cipollari et al., 1999a, 1999b;Cosentino et al., 2010).
Since the late Messinian, a second stage of later extensional tec-tonics related to crustal thinning processes occurring in the Tyrrhenian-Tuscan area and orogenic collapse of the Apennines, permitted the development of extensional intermontane basins (e.g., including Rieti, Colfiorito, Norcia, Castelluccio, Amatrice and L'Aquila basins) mainly bordered by NW-SE oriented and SW-dipping normal to transtensional faults (e.g.Calamita et al., 1994;Cello et al., 1997;Tondi, 2000;Barchi et al., 2000;Barchi, 2002;Cavinato et al., 2002;Tondi and Cello, 2003; Barchi and Mirabella, 2009;Cosentino et al., 2010; Pierantoni et al., 2013;Villani et al., 2018;Civico et al., 2018;Tondi et al., 2018). These faults represent so called Central Apennines Fault System (CAFS in Cello et al., 2000), overprint and/or invert pre-existing structures of the fold and thrust belt and are characterized by adjacent, and echelon fault segments (Amato et al., 1998;Boncio et al., 2004a;Chiaraluce et al., 2004;Piccinini et al., 2006;Chiarabba et al., 2010). Though fault data and earthquake focal mechanisms indicate a predominant NE-SW ex-tension in the region, strike-slip and even reverse kinematics have also been determined (Cello et al., 1997;Chiaraluce et al., 2004;Piccinini et al., 2006).
The active extension of the central Apennines is also revealed by GPS data. Serpelloni et al. (2005) estimated a strain rate of 3.1 ± 0.8 × 10⁻⁸/y and an extension rate of 2.5 ± 0.6 mm/y across the Apennines. Similarly, Anzidei et al. (2005) reported values of 1.4 ± 1.3 × 10⁻⁸/y and 1.8 ± 1.7 mm/y for strain rate an extension rate, respectively.Devoti et al. (2011) estimated an extension strain rate of 5.0 × 10⁻⁸/y in the central Apennines and a general uplift of 1–2 mm/y interrupted by occasional subsiding intramountain basins (approximately 1 mm/y).D'Agostino et al. (2011)reported a relatively simple pattern of crustal extension with velocities increasing from 2 to 4 mm/yr towards the northeast from the Tyrrhenian to the Adriatic coast converging at the predicted of 2.9 ± 0.1 mm/yr N70E motion (calculated with the Adriatic-Eurasia and Tyrrhenian-Eurasia poles of rotation) of the Adriatic microplate relative to the Tyrrhenian coast. According to the same authors, the crustal extension seems to con-centrate across the alignment of historical and recent seismic events.
Geological data also confirms the active extension of the axial zone of the Apennines during the period Late Pleistocene–Holocene.Selvaggi Table 1
Important historical earthquakes with minimum magnitude 5.8 in central Apennines in period 1279–2009 afterRovida et al. (2016). Me corresponds to the magnitude estimated from the macro-seismic data.
Year Epicentral area Lat. Lon. Io Me (Mw)
1279 Appennino umbro-marchigiano 43.093 12.872 9 6.2 1328 Valnerina 42.857 13.018 10 6.5 1461 Aquilano 42.308 13.543 10 6.5 1599 Valnerina 42.724 13.021 9 6.1 1639 Monti della Laga 42.639 13.261 9–10 6.2 1646 Monti della Laga 42.615 13.247 9 5.9 1703 Valnerina 42.708 13.071 11 6.9 1703 Aquilano 42.434 13.292 10 6.7 1730 Valnerina 42.753 13.12 9 6.0 1747 Appennino umbro-marchigiano 43.204 12.769 9 6.1 1751 Appennino umbro-marchigiano 43.225 12.739 10 6.4 1979 Valnerina 42.73 12.956 8–9 (5.8) 1997 Appennino umbro-marchigiano 43.014 12.853 8–9 (6.0) 2009 Aquilano 42.309 13.51 9–10 (6.3) Table 2
Earthquakes with Mw≥ 5 recorded in central-southern Italy during the 2002–2016 monitoring period (Rovida et al., 2016;Chiaraluce et al., 2017).
Date Location
[Lat.; Long.]
Hypocentral depth (km) Magnitude (Mw)
#1 Molise Oct 31/Nov 1, 2002 41.73 N; 14.89E 25.1 5.8
#2 Aquila Apr 6, 2009 42.35 N; 13.38 E 8.3 6.3
#3 Central Italy Aug 24, 2016 (Amatrice) 42.70 N; 13.23 E 8.1 6.0
Aug 24, 2016 (Norcia) 42.79 N; 13.15 E 8.0 5.3
Oct 26, 2016 (Castelsantangelo sul Nera) 42.88 N; 13.13 E 8.7 5.4
Oct 26, 2016 (Visso) 42.91 N; 13.13 E 7.5 5.9
(1998)using earthquake summation over the last 700 years estimated an extensional rate of 1.6–1.7 mm/yr.Tondi and Cello (2003) specu-lated the displacement rate of the whole CAFS in the last 700 ka to be 1.6 cm/year and the average recurrence time for M > 6.5 events to be about 350 years.Papanikolaou et al. (2005), on the basis of fault scarps investigations, estimated a maximum extension rate over the Late Pleistocene to Holocene of approximately 2 mm/y in the central Apennines.Faure Walker et al. (2010), using the offsets of Late Pleis-tocene-Holocene sediments calculated strain rates about 1.0 to 3.1 mm/ yr depending on the dimensions of the studied area. On the other hand, paleoseismological analyses show a 0.4 to 1.3 mm/yr Quaternary slip rates along the main normal faults of the CAFS (Barchi et al., 2000; Galadini and Galli, 2000; Pizzi et al., 2002; Boncio et al., 2004b; Blumetti et al., 2013;Cinti et al., 2011;Galli et al., 2011;Gori et al., 2011).
The CAFS generate most of the seismicity in the region (Cavinato et al., 2002;Barchi et al., 2000;Tondi and Cello, 2003) making the central Apennines among the most seismically active area of the central Mediterranean region (Amato et al., 1997;Bagh et al., 2007;Falcucci et al., 2011). InFig. 2are reported the main active faults and the three seismic sequences occurred in the area during the last three decades. Earthquakes are distributed over a 50–60 km wide strip, which extends from Tuscany to Abruzzo with a maximum intensity according to his-torical catalogue of X-XI MCS and Mw of 6.9 as proposed by Tondi (2000); Tondi and Cello (2003);Rovida et al. (2016)and Ms of 7.0 proposed byMichetti et al. (1996).
Significant seismic events have been reported with magnitude (Mw) higher than 5.8 in historical records (Table 1,Rovida et al., 2016) as well as significant recent earthquakes. Since 1997, the central Apen-nines area was affected by several moderate earthquakes with a mag-nitude > 5 (Fig. 2). In this period, the most significant earthquakes have been: i) Colfiorito, 26 September 1997; Mw = 6.0, Depth = 9.8 km (Rovida et al., 2016), ii) L'Aquila, 6 April 2009; Mw = 6.3, Depth = 8.3 km (Rovida et al., 2016), iii) Amatrice, 24 August 2016, Mw = 6.0, Depth = 8.0 km (INGV, 2018), iv) Visso, 26 October 2016; Mw = 5.9, Depth = 10 km (INGV, 2018), v) Norcia, 30 October 2016; Mw = 6.5, Depth = 10 km (INGV, 2018).
3.2. Colfiorito 1997 seismic sequence
On September 26, 1997, at 00:33 and 09.40 GMT two moderate earthquakes (Mw = 5.7 and Mw = 6.0) struck the Umbria and Marche regions of central Italy with epicentre close to the town of Colfiorito (Rovida et al., 2016). The two main earthquakes were part of a se-quence which began on September 3 with a Mw = 4.5 significant foreshock and continued with several aftershocks including a third damaging event (Mw = 5.6) on October 14 close to the town of Sellano (Ekström et al., 1998). The seismic sequence caused significant co-seismic surface ruptures cutting both the carbonate bedrock and the unconsolidated debris covers, as well as surface deformation associated
to gravitational phenomena caused by seismic shaking (Basili et al., 1998;Cello et al., 2000;Vittori et al., 2000).Ekström et al. (1998)by analysing the main events (Mw > 4.2) of the sequences indicates that 12 of them presented focal mechanisms of normal faulting on NW-SE striking fault planes with tension axes oriented in the range 40°–60°, roughly perpendicular to the strike of the Apennines. Exceptionally, one of the larger aftershocks (16 October Mw 4.3) in the sequence indicated a strike-slip mechanism corresponding either to right-lateral faulting on an E-W striking plane or left-lateral faulting on a N-S striking surface. Boncio and Lavecchia (2000)reconstructed a structural model for the Colfiorito seismic sequence by integrating seismological data with both surface and subsurface geological data. They confirmed, that the Col-fiorito and Sellano earthquakes can be related to rupture episodes on two major én échelon SW-dipping normal listric faults: the M.Pennino-M.Prefoglio and M.Civitella-Preci faults.
3.3. Molise 2002 seismic sequence
On October 31, 2002, a moderate size earthquake (Mw = 5.8) oc-curred in Molise region, southern Italy. The Molise earthquake was identified as a dextral shear along a roughly E-W oriented fault (Valensise et al., 2004;Chiarabba et al., 2005). The hypocentre depth of the Molise earthquake is controversial, 15 km inDe Natale et al. (2011), and for example 25 km inRovida et al. (2016).
3.4. L'Aquila 2009 seismic sequence
On April 6, 2009, a Mw 6.3 earthquake followed by high magnitude aftershocks (e.g. Mw 5.4 and 5.6) struck central Italy (Rovida et al., 2016), nearby L'Aquila city causing a high number of casualties and significant damage (e.g.Chiarabba et al., 2009). The mainshock gen-erated surface fractures along a structural feature referred to as Paga-nica fault (Boncio et al., 2010; EMERGEO Working Group, 2010; Falcucci et al., 2009;Vittori et al., 2011).
The April 6, 2009 mainshock was preceded by a long sequence of foreshocks, which initiated several months before, ending with a Ml 4.1 shock on March 30 (Chiarabba et al., 2009;Papadopoulos et al., 2010). A considerable number of aftershocks followed the main seismic event, including two earthquakes of Mw 5.6 and Mw 5.4 (e.g.Chiarabba et al., 2009;Cirella et al., 2009;Galli et al., 2011).Chiarabba et al. (2009) reported that the main shock and aftershocks were consistent with predominantly pure normal faulting mechanisms. The distribution of the aftershocks clearly defines a 15–18 km long, NW-SW oriented and nearly 45°SW-dipping fault situated above 10 km depth (Chiarabba et al., 2009).
3.5. Central Italy 2016–2017 seismic sequence
The recent central Italy sequence (i.e. Amatrice-Visso-Norcia earthquakes) initiated in August 2016 and is still active while we are Fig. 1. Map of central Italy with the three main arcs of the Apennine chain and monitoring sites: S1– Colfiorito; S2 – Norcia; S3 – Castel Santa Maria.
writing (October 2018) involving an important part of the CAFS in-cluding Mt. Vettore–Mt. Bove, the Laga Mountains, the Norcia and the Montereale fault systems (Chiaraluce et al., 2017). The seismic se-quence comprised three mainshocks: i) Amatrice Mw 6.0, August 24, ii) Visso Mw 5.9, October 26, and iii) Norcia Mw 6.5, 30 October 2016, the strongest earthquake of the sequence (e.g. Chiaraluce et al., 2017). Complementing the seismic sequence, less destructive events occurred nearby Campotosto on 18 January 2017, with a maximum Mw of 5.5. The aftershocks of the 2016–2017 central Italy seismic sequence,
confined to a maximum depth of 12 km, follow a roughly NW-SE trend for near 80 km between the towns of Camerino and Pizzoli, northern and southern limits respectively (Chiaraluce et al., 2017). The focal mechanism of the main shocks, the distribution of the aftershocks, and significant coseismic ruptures (e.g.EMERGEO Working Group, 2016; Aringoli et al., 2016; Lavecchia et al., 2016;Livio et al., 2016;Galli et al., 2017;Pucci et al., 2017;Civico et al., 2018;Villani et al., 2018) in correspondence with already mapped active faults (e.g.Civico et al., 2018), shows the activation of a system of mainly NNW-SSE striking Fig. 2. Map of the epicentres related to the seismic sequences that affected the central Apennines between 1997 and 2017 (data fromwww.ingv.it). The main active faults (slightly modified fromTondi et al., 2018; fault data fromCalamita et al., 1994;Cello et al., 1997;Tondi, 2000;Tondi and Cello, 2003;Pierantoni et al., 2013; Civico et al., 2018;Villani et al., 2018) and the location of the TM-71 extensometers are also shown.
and WSW dipping normal faults (Cheloni et al., 2017;Chiaraluce et al., 2017;Walters et al., 2018).
Civico et al. (2018) and Villani et al. (2018) reported that the ruptures are generally organized in a systematic pattern of dominantly synthetic (N135°-160° striking, SW-dipping) and subordinately anti-thetic (N320°–345° striking, NE-dipping) components. Generally, the ground ruptures follow the trace of mapped faults (e.g.Pierantoni et al., 2013and references therein), but in particular in some cases, the co-seismic ruptures occurred along fault splays not previously recognized (Civico et al., 2018). The average coseismic throw of the entire se-quence is∼0.3 m. However, > 2 km of the ruptures showed average coseismic throw > 1 m, with maxima of∼2.4–2.6 m along the so-called Cordone del Vettore fault scarp (Civico et al., 2018;Villani et al., 2018). 3.6. Monitoring sites
Between 2002 and 2003, a network of three extensometers was installed in three locations, i.e. Colfiorito, Castel Santa Maria, and Norcia (Fig. 4andTable 3). In order to avoid major climatic effects, the devices were installed in shallow covered trenches approximately 0.75 m deep (Colfiorito and Castel Santa Maria sites) or in the cellar of a house in the Norcia site.
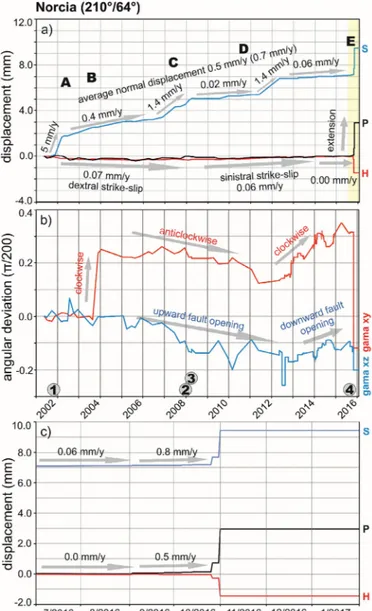
The Colfiorito site (S1) is located in the axial zone of the central Apennines in the central part of the ridge slope to the south of the Colfiorito intermountain basin, approximately 30 km NNW of Norcia (Fig. 2). A TM71 extensometer was installed across a NNW-SSE trending normal fault scarp, which dips to the WSW (240°/70°) and follows the local slope (Fig. 4c,d). Regular monitoring began in April 2003 (Fig. 5). The Norcia site (S2) is situated in a cellar of a house constructed across a normal fault generally striking NNW–SSE inside the Norcia intra-mountain basin. In the immediate vicinity of the monitoring site the fault curves to strike approximately WNW–ESE and dips to SSW (210°/64°). Regular monitoring began in May 2002 (Fig. 4e,f). Since May 2013, data have been digitally acquired on a daily basis, while before then they were manually recorded quarterly (Fig. 6).
The Castel Santa Maria site (S3) is located in the axial zone of the central Apennines, approximately 10 km to the SSE of Norcia (Fig. 2). A TM71 extensometer was installed across a normal fault scarp in the carbonate bedrock reactivated during the Norcia earthquake of 9 Sep-tember 1979 (Calamita et al., 1994). The fault scarp is NNW-SSE trending and dips to the WSW (243°/63°) along with the local slope (Fig. 4a,b). The site is situated in the upper part of the ridge to the south
of the Norcia basin, on the outskirts of Castel Santa Maria village, which was almost completely destroyed during the Norcia 1979 earthquake. Regular monitoring began in May 2002 (Fig. 7).
The data from Colfiorito, Castel Santa Maria and Norcia (until June 2013) were manually recorded by means of a digital camera with a quarterly frequency. Moreover, complementary data were recorded after the moderate earthquakes that affected central Italy as soon as possible. Since 2013, the Norcia extensometer has been equipped with two electronic photo cameras, which automatically capture locally-stored images of the detection planes. The extensometer is remotely accessible via the internet for data download and analysis. Interference pictures from the last 30 days can be found athttp://www.tecnet.cz/ index.php?page=online_en. All data (displacement, temperature, hu-midity, air pressure) are taken daily (at 24:00 GMT) and transferred and saved in the IRSM server.
Detailed data from all the monitoring sites are presented and dis-cussed below.
4. Results of fault slip monitoring 4.1. Colfiorito site
The total fault slip recorded until January 2017 corresponds to approximately 0.5 mm north-eastward reverse displacement with a minor dextral strike-slip component (Fig. 5). Nevertheless, the slip de-veloped non-linearly and resulted mostly fromfive dominant transient events recorded in 2003, 2004, 2008 and 2011 (Fig. 5a). Thefirst event (A) occurred in June 2003 and corresponds to a dextral reverse dis-placement of approximately 2 mm to the NNE. The second event (B) occurred in September–October 2004 and corresponds to a transient reversible sinistral normal displacement of approximately 0.5 mm. The third event (C) was recorded in July–September 2008 and corresponds to a sinistral normal displacement of approximately 2.8 mm to the S. Finally, a fourth event (D) was recorded in June–October 2011 and corresponds to a dextral reverse displacement of approximately 1.7 mm to the NE. A remarkable fault extension (E) occurred at the end of 2016/beginning of 2017. The rest of the monitored period can be characterized as being calm, affected by very slow normal displacement with an average velocity of 0.04–0.07 mm/y. The minor strike-slip component of the normal displacement changed from dextral to sinis-tral at the beginning of 2009 and continues to-date.
The stress mode of the fault slip is affected by several remarkable Fig. 3. The TM-71 optical-mechanical extensometer and its basic characteristics: the 3-D displacement between the two blocks is inferred from the moiré patterns recorded along three perpendicular planes. a) example of a photograph of a moiré pattern between two glass plates withfine engraved spirals; b) schematic drawing of the TM-71 extensometer. All grey parts are attached to block 1, all white to block 2. Arrows indicate the possible movements of the components; c) spiral similar to those of the engraved glass plate of TM-71 (much less dense); d) Two overlapping concentric spirals displaced with respect to one another. Picture moved hor-izontally by the distance indicated by the arrow– now the moiré effect is observable.
transient compression events, particularly in June 2003 (A), September–October 2004 (B) and July–September 2008 (C). On the contrary remarkable extension events occurred after event C and par-ticularly at the end of 2016 (E).
Regarding the block's horizontal rotation (Fig. 5b), the footwall block mostly rotated in an anticlockwise direction. Three short periods of clockwise rotation were recorded in 2003, 2008 and 2016 and cor-respond to the dominant fault slip events A, C and E. On the vertical plane, only one remarkable event was recorded in 2008, corresponding to a downward fault opening.
4.2. Norcia site
The dominant recorded fault slip corresponds to a SSW normal displacement with a total value until August 2016 of 7.2 mm, which corresponds to an average velocity of approximately 0.5 mm/y (Fig. 6). Since September 2016, after the Amatrice 2016 earthquake and during the Norcia 2016 earthquakes, the total normal displacement has in-creased up to 9.6 mm. Overall, this corresponds to an increase in the average velocity to approximately 0.7 mm/y.
Normal displacement development is mostly linear with an average velocity ranging from 0.04 to 0.06 mm/y. Linear development is in-terrupted by four periods of accelerated slip recorded at the end of 2002/beginning of 2003, during 2008 and the end of 2012/beginning of 2013 (Fig. 6a). The latest acceleration has occurred since 2 Sep-tember 2016 and resulted in two remarkable normal displacement events with values of 0.5 mm and 1.9 mm recorded on 26 and 30 Oc-tober 2016, respectively (Fig. 6c).
In the strike-slip mode, a predominantly dextral strike-slip with an average velocity of 0.07 mm/y was recorded until April 2009. Similar to the Colfiorito site, the strike-slip mode changed to sinistral with an average velocity of 0.06 mm/y and lasted until the end 2014 when it stopped (Fig. 6a). Two remarkable dextral strike-slips with values of Fig. 4. Schemes of the faults across which the TM-71 extensometers were installed at the three monitoring sites in central Italy (Castel Santa Maria, Colfiorito and Norcia).
Table 3
Monitoring sites in central Apennines.
Site Geological structure Location
[Lat.; long.; altitude] S1: Colfiorito Colfiorito normal fault 43.00 N; 12.93 E; 1080 m a.s.l. S2: Norcia Norcia normal fault 42.80 N; 13.10 E; 610 m a.s.l. S3: Castel Santa Maria Norcia normal fault 42.71 N; 13.12 E; 1140 m a.s.l.
approximately 0.3 mm and 1.3 mm were recorded on 26 and 30 Oc-tober 2016, respectively (Fig. 6c).
The stress mode is predominantly compressive, with the fault only being affected by transient several-month-lasting transient extensions at the end of 2002/beginning of 2003 and the start of 2008/beginning of 2009 (Fig. 6a). A significant accelerated fault extension has been re-corded since 2 September 2016 and resulted in two fault opening events on 26 and 30 October 2016. Since September 2016, the total fault opening has reached a value of 3 mm. No fault slip was recorded be-tween 31 October 2016 and the end of January 2017 (Fig. 6c).
Regarding the block's horizontal rotation (Fig. 6b) almost no rota-tion was recorded apart from two specific events. The first event oc-curred in September–October 2004 when a clockwise rotation of the footwall block was recorded with a value of approximately 0.25 grad, which corresponds to 0.225°. The second event started at the end of 2013, when another clockwise rotation of the footwall block occurred and lasted until 29 October 2016 with average velocity of approxi-mately 0.1 grad/y. In addition, a remarkable anticlockwise rotation with a value of 0.44 grad was recorded on 30 October 2016. No rotation was recorded between 31 October 2016 and the end of January 2017.
4.3. Castel Santa Maria site
The total fault slip recorded until January 2017 corresponds to a dextral strike-slip with a total value of approximately 0.5 mm (Fig. 7). Three remarkable events can be recognized from the fault slip records of 2003, the end of 2011/beginning of 2012 and during 2016 (Fig. 7a). In 2003 and the end of 2011/beginning of 2012 the recorded events correspond to dextral normal displacement with values of 0.3 and 0.6 mm, respectively. The latest event in 2016 corresponds to a north-eastward dextral reverse displacement with a value of approximately 0.5 mm. The reverse displacement dropped after 6 November 2016. Fig. 5. Cumulative curve of the fault slip (a) and block rotations (b) recorded at
the Colfiorito site (S1 inFigs. 1 and 2) in 2003–2017. (a) fault slip orientation +s = normal displacement,−s = reverse displacement; +h = sinistral strike-slip,−h = dextral strike-slip; +p = fault extension, −p = fault contraction. (b) relative block rotations along plane xy and xz in the Cartesian system: +gamma xy = footwall block clockwise rotation, −gamma xy = footwall block anticlockwise rotation; +gamma xz = upward fault opening,−gamma xz = downward fault opening. The period of remarkable slip is marked– A: dextral reverse displacement in June 2003; B: reversible sinistral normal dis-placement in September/October 2004; C: sinistral normal disdis-placement in August/September 2008; D: dextral reverse displacement in May/October 2011; E: fault extension November 2016/January 2017. Major earthquakes are marked (see alsoTable 1): (1) Molise earthquake on 31 October/1 November 2002 (Mw = 5.7); (2) Perugia earthquake on 15 December 2008 (Mw = 4.2); (3) L'Aquila earthquake on 6 April 2009 (Mw = 6.3); (4) August/October 2016 Marche earthquakes (Mw = 6 and 6.5).
Fig. 6. Cumulative curve of the fault slip (a) and block rotations (b) recorded at the Norcia site (S2 inFigs. 1 and 2) in 2003–2017 and detail (c) of the two co-seismic signals recorded for the 26 and 30 October events (seeTable 1). (a) and (c) fault slip orientation +s = normal displacement,−s = reverse displace-ment; +h = sinistral strike-slip,−h = dextral strike-slip; +p = fault exten-sion,−p = fault contraction. (b) relative block rotations along plane xy and xz in the Cartesian system: +gamma xy = footwall block clockwise rotation, −gamma xy = footwall block anticlockwise rotation; +gamma xz = down-ward fault opening,−gamma xz = upward fault opening. Major earthquakes are marked (see alsoTable 1): (1) Molise earthquake on 31 October/1 No-vember 2002 (Mw = 5.7); (2) Perugia earthquake on 15 December 2008 (Mw = 4.2); (3) L'Aquila earthquake on 6 April 2009 (Mw = 6.3); (4) August/ October 2016 Marche earthquakes (Mw = 6 and 6.5). Slip periods recorded at the Colfiorito site are marked A, B, C, D, E.
In the strike-slip mode, a remarkable dextral strike-slip development began around 2011 and lasted until January 2017. The average velocity of the strike-slip was approximately 0.02 mm/y for the period 2002–2010, approximately 0.3 mm/y in 2011 and approximately 0.1 mm/y since 2013.
A remarkable and extraordinary contraction value was recorded during 2016. Since March 2016, the fault aperture has closed
approximately 0.35 mm. To show the fault slip recorded in 2016 we also used the graph of cumulative fault slip in Cartesian coordinates x,y,z (Fig. 7c). Compared to the previous data, the extraordinary values in the development of the vertical coordinate z were measured since March 2016. Compression as well as the vertical component dropped after 9 November 2016.
Regarding the block's horizontal rotation (Fig. 7b), the footwall block rotated clockwise until 2012 with an average velocity of ap-proximately 0.02 grad/y. From 2012 to beginning of 2014, the rotation changed to being mostly anticlockwise with an average velocity of 0.1 grad/y. Afterwards, the rotation turned back to the clockwise mode. The anticlockwise rotation of the footwall block was recorded again during the 2016 Norcia earthquakes. The rotation in the vertical plane corresponds to the downward fault opening, which has remarkably accelerated since October 2016.
5. Discussion 5.1. Exogenic influences
Due to installation of the extensometers on the surface, the data could reflect not only endogenic processes but also exogenic processes. There are several exogenic processes that may potentially affect the measurements, the most significant of which are thermo-elastic effects due to yearly temperature changes and surface processes like e.g. landslides or slope debris creep or subsurface processes related to karst phenomena.
5.1.1. Temperature influence
The position of the extensometers in covered trenches and house cellar significantly reduces the effects of yearly temperature changes as well as direct sunlight. Seasonal temperature changes are relatively low during the year, up to 20°–25 °C in Colfiorito and Castel Santa Maria (on direct sunlight the temperature range can exceed 50 °C) and up to 5 °C in Norcia due to installation in the house cellar.
The amplitude of seasonal thermo-elastic effects in Colfiorito can be estimated up to 0.4 mm from component p (width of the fault), which is the component mostly affected by yearly temperature changes. The other components h and s are not significantly affected by cyclic (yearly) changes (Fig. 5).
There is no evidence of any cyclic changes in fault slip development in Norcia (Fig. 6) due to very low temperature changes inside the cellar. Due to the low magnitude of the recorded fault slips, the most af-fected slip in terms of temperature changes is observed in Castel Santa Maria (Fig. 7). The yearly effect seemingly occurred in all three com-ponents. The yearly amplitude of elastic slip in component p reached approximately 0.3 mm, in component s approximately 0.2 mm and in component h approximately 0.1 mm. Nevertheless, regular yearly changes cannot be detected from the fault displacement records. Moreover, all of the above-described extreme slips had a magnitude 2–3 times greater than the supposed yearly amplitude.
5.1.2. Surface processes
As mentioned before, the Colfiorito site is situated in the central part of the western-oriented steep slope of the Monte Tolagna (1404 a.s.l.). According to the landslides inventory map of the Umbria region com-piled by Guzzetti and Cardinali (1989), by ISPRA (http://www. isprambiente.gov.it/it/progetti/suolo-e-territorio-1/i ffi-inventario-dei-fenomeni-franosi-in-italia) and Autoritá di Bacino de Fiume Tevere (http://www.abtevere.it/node/141?q=node/142) as well as ourfield investigation, there is no evidence of significant indicators of gravita-tional slope movements affecting just the monitored site. Nevertheless, there is evidence of a shallow landslide to the south of the site. A small landslide destroyed a tourist shelter situated approximately 200 m to the south of the site in 2009. A very slow and normal displacement movement with a velocity of approximately 0.04–0.07 mm/y was in Fig. 7. Cumulative curve of the fault slip (a) and block rotations (b) recorded at
the Castel Santa Maria site (S1) in 2003–2017 and the cumulative curve of the fault slip in the Cartesian system (c). (a) fault slip orientation +s = normal displacement, −s = reverse displacement; +h = sinistral strike-slip, −h = dextral strike-slip; +p = fault contraction, −p = fault extension. (b) relative blocks rotation along plane xy and xz in the Cartesian system: +gamma xy = footwall block anticlockwise rotation, −gamma xy = footwall block clockwise rotation; +gamma xz = upward fault opening, −gamma xz = downward fault opening. (c) + x = contraction, −x = extension; +y = sinistral strike-slip, −y = dextral strike-slip; +z = uplift of hanging block/subsidence of footwall block;−z = subsidence of hanging block/uplift of footwall block. Remarkable slips are marked - A: dextral normal displacement in April/June 2003; B: dextral normal displacement in January/April 2012; C: dextral reverse displacement in March/November 2016. Major earthquakes are marked (see alsoTable 1): (1) Molise earthquake on 31 October/1 November 2002 (Mw = 5.7); (2) Perugia earthquake on 15 December 2008 (Mw = 4.2); (3) L'Aquila earthquake on 6 April 2009 (Mw = 6.3); (4) August/October 2016 Marche earthquakes (Mw = 6 and 6.5). Slip periods recorded at the Colfiorito site are marked A, B, C, D, E.
fact recorded (Fig. 5a), and may correspond to slope debris creep. In addition, two remarkable normal displacement events were recorded in September–October 2004 (reversible with a magnitude of approxi-mately 0.5 mm) and August–September 2008 (irreversible with a magnitude of approximately 1.5 mm). Nevertheless, both events were connected with a remarkable fault transient contraction. As discussed later, it is difficult to explain these events as slope movements alone.
The Norcia site is situated at the bottom of a basin, so we can ex-clude the effects of several slope movements in the fault slip record. However, Aringoli et al. (2016)reported a possible relationship be-tween coseismic surface ruptures and deep-seated gravitational slope deformation along the southern and western slope of Monte Vettore (approximately in the middle of the Norcia and Castel Santa Maria sites).Civico et al. (2018)documented surface ruptures occurred near Norcia andFerrario and Livio (2018)analysed the spatial pattern and geometric characteristics of distributed faulting during the October 30, 2016 Mw 6.5 earthquake.
The Castel Santa Maria site is situated in the upper part of a low gentle slope. According to the landslides inventory map of the Umbria region (Guzzetti and Cardinali, 1989) as well as to ISPRA (http://www. isprambiente.gov.it/it/progetti/suolo-e-territorio-1/iffi-inventario-dei-fenomeni-franosi-in-italia) and Autoritá di Bacino de Fiume Tevere (http://www.abtevere.it/node/141?q=node/142 and our field in-vestigation, there is no evidence of significant indicators of gravita-tional slope movements. Moreover, there is no visible trend in the vertical or horizontal components of the recorded slip, which could be connected with slope movement (Fig. 7a). The dominant component of the fault slip is a dextral strike-slip. Nevertheless, two transient re-versible normal displacement events were recorded in April–June 2003 and January–April 2012 with magnitudes of approximately 0.3 mm and 0.6 mm, respectively. Both events had minor sinistral strike-slip com-ponents.
The influence of precipitation on the recorded events as well as possible deep-seated slope deformation processes was studied using monthly rainfall data for the period from January 2002 to December 2016 (Fig. 10). Data used in the analysis were provided by www. meteoblue.comfor the Colfiorito and Norcia sites. The monthly average precipitation in Colfiorito reaches 83 mm, while in Norcia it reaches 86 mm. The mean annual precipitation in the studied period (2002–2016) reached 994 mm in Colfiorito and 1028 mm in Norcia.
To investigate the possible influence of precipitation on the events recorded in Colfiorito and Castel Santa Maria, differences between monthly cumulated precipitation and long-term monthly average were calculated. This method wasfirstly used byZáruba and Mencl (1987) and applied for landslide activity in different regions. The rising part of the curve represents the wet period, which is prone to landslide ac-celeration, while the decreasing trend show dry periods.
For the studied period, two wet periods can be identified at both analysed sites. Thefirst one started in January 2009 and ended in April 2011 and the second wet period started in August 2012 and ended in May 2015. None of the recorded normal displacement events at Colfiorito, Norcia or Castel Santa Maria can be attributed to the wet periods. Therefore, it can be concluded that the recorded normal dis-placement events were not influenced by gravitational movements triggered by precipitation.
5.1.3. Karst processes
Karst processes are common in the Umbria-Marche Apennines be-cause of the widespread strongly fractured carbonatic rocks. In some cases, such processes have contributed to surface lowering of the intra-mountain basins (Soldati and Marchetti, 2017). The Colfiorito mon-itoring site is situated in the karst area called Altipiani di Colfiorito formed by a system of tectonic and karst-valleys. Norcia and Castel Santa Maria sites are situated in the karst area of Sibillini mountain chain, Monti Sibillini. Thus, it is impossible to rule out karst influence. Nevertheless, there is no detailed information about underground karst
phenomena close to the monitored sites. So, it is very difficult to quantify their influence on the stability of monitored sites. However, having the fault slip accelerations roughly occurred synchronously on all distant monitored faults, the influence of karst processes, if any, must be minimal and therefore can be ignored.
5.2. Fault kinematics and dynamics
As described above, the results from the TM-71 extensometer measurements clearly show (Figs. 5–7) events of larger, accelerated slips, which were unusual compared to the normally registered on the faults. The large slips were usually accompanied by series of smaller slips. During these slips, the kinematics (orientation) and dynamics of the studied faults changed rapidly. Periods of larger, accelerated slips are described as events A to E inFigs. 5–7. The analysis revealed that events of larger slips were more or less regular during the studied period and roughly occurred synchronously on all the studied faults.
5.2.1. Fault kinematics
The slips on the studied faults recorded during the events are de-scribed by total slip vectors. Their components u, v, and w (corre-sponding to s, h, p in Figs. 5–7) are measured by the TM-71 ex-tensometers. The orientation and sense of all the shear slips during the events for each fault are shown onFig. 8. On the Colfiorito and Castel Santa Maria faults both normal and reverse slips were observed. No-tably, the direction of slip has remained similar during the different slip events. The Colfiorito and Castel Santa Maria faults were repeatedly revived as oblique dextral reverse or normal faults, while the Norcia fault was revived as a normal fault with variable strike-slip components.
5.2.2. Fault dynamics
The basis of stress estimates (inducing the recorded slips) and the shear movement orientations on the studied faults were analysed by well-established methods of fault slip data study (Angelier and Mechler, 1977;Marrett and Allmendinger, 1990). Dilation of the fault was also recorded in addition to movements with a prevailing shear component. During periods with a ratio of both types of movement above 2.9 (i.e. the vector of the total movement makes an angle of > 70° with the fault plane) the fault was reactivated as a contractional or extensional fault (c.f.Fossen, 2010). In these movements, the orientation of the domi-nant/main stress is considered to be close to the orientation of the fault plane (close to the pole of the plane in the graphs). The results of the estimation of the principal stresses for the slip events on all the studied faults are shown inFig. 9. According to the known changes in polarity of the slip senses (reverse/normal), a similar repeated stress regime change (contraction/extension) occurred on all three faults. As well, the stresses inducing the slips on the faults had a similar orientation. The directions/orientations of the dominant principal stresses in both al-ternating episodes (i.e. highest principal stressσ1 – pressure orientation during a compressional regime, and lowest principal stressσ3 – pull orientation during an extensional regime) also have a comparable or-ientation. These are stress pulses of a similar direction and reverse polarity, or inversions of theσ1/σ3 principal stresses.
Movements on the three faults were induced by repeated switches between two stress states. Thefirst of them is extension generally NE-SW and slightly inclined to the NE-SW in Anderson's normal-fault stress regime (c.f. Fossen, 2010). The second stress state represents com-pression oriented NE-SW in the reverse-fault regime (Fig. 9), slightly inclined to the SW, too. During the same events similar stress field parameters (e.g. direction and inclination) were observed on all three faults. Small differences in orientation (Fig. 8) could be caused by the effect of slight alterations in local stress/strain field in surrounding faults (Faulkner et al., 2007).
5.3. Local and regional seismicity
During the studied period (2002–2017), central Italy was affected by several seismic events with magnitudes larger than 5, i.e. Molise 2002, Mw = 5.8; L'Aquila 2009, Mw = 6.3; Amatrice-Visso-Norcia 2016, Mw up to 6.5 (Table 1); one weak earthquake (15 December 2008, Mw = 4.2, Perugia) struck the area very close to the Colfiorito monitoring site. Instead,five events (A, B, C, D, E in graphs) of extra-ordinary transient accelerated fault displacement have been recorded
since 2002, which roughly coincide with the major earthquakes that affected central Italy.
5.3.1. Event A (San Giuliano di Puglia, Molise earthquake 31 October/1 November 2002; Mw = 5.8)
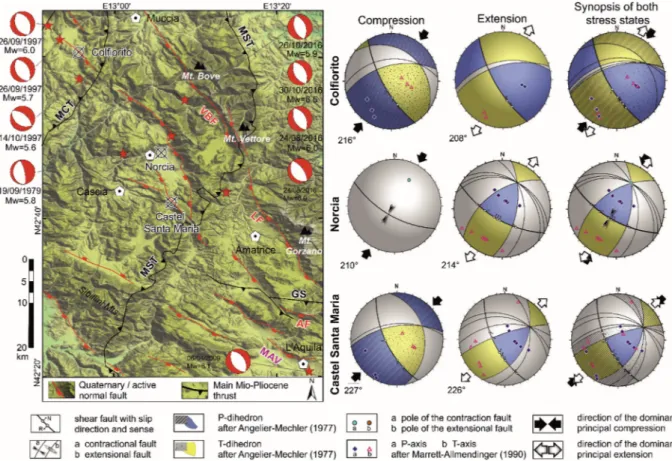
Event A occurred between 20 November 2002 and 25 July 2003, approximately one month after the Molise earthquake, whose epicentre was approximately 160 km to the SE of the southernmost Castel Santa Maria site. Extraordinary fault displacement affected the three Fig. 8. Overall character of the observed compressional and extensional episodes (2002–2017). Left part: Seismotectonic sketch of the central Apennines the main Neogene thrusts (black lines) and Quaternary/active normal fault systems (red lines). The Mt. Cavallo (MCT), Sibillini Mts. (MST) and Gran Sasso (GS) thrust ramps are oblique to the main (N)NW–(S)SE trend of the normal fault systems (modified fromDi Domenica and Pizzi, 2017). Right part: Beach ball charts showing the orientation of P- and T-axes and resulting P- and T- dihedrons constructed for measured fault slips during compressional and extensional episodes separately for each monitored fault, complemented with a synoptic chart combining both stress states. These synoptic charts show that on all faults both stress states (compression and extension) occur in very similar directions. This indicates that both compression and extension have the same genetic origin. On the contrary, the direction of compression/extension differs slightly from the average compression/extension direction (seeFig. 9) and also among the three observed faults. (For interpretation of the references to colour in thisfigure legend, the reader is referred to the web version of this article.)
Fig. 9. Principal stress summary. Beach ball charts of the orientation of P- and T-axes and resulting P- and T- dihe-drons, constructed for measured fault slips during compres-sional (A) and extencompres-sional (B) episodes. Each chart shows compression/extension for all three faults. The charts show that the general direction of compression/extension in all cases corresponds to the orientation of the dominant prin-cipal stressfield (azimuth approximately 218°).
monitoring sites. Dextral normal displacement was recorded in Castel Santa Maria, accelerated normal displacement with minor dextral horizontal displacement was recorded in Norcia and finally dextral reverse displacement was recorded in Colfiorito. The Molise earthquake was identified as a dextral shear along a roughly E-W oriented fault by Valensise et al. (2004) andChiarabba et al. (2005) nevertheless the hypocentre depth is controversial, 15 km according toDe Natale et al. (2011)or 25 km according toRovida et al. (2016). There is no visible correlation between the focal mechanism and the kinematics of fault displacement.
5.3.2. Event B (no major earthquake in central Italy)
Event B occurred in September/October 2004. Transient sinistral normal displacement and extraordinary horizontal rotation were re-corded in Colfiorito and Norcia, respectively.
5.3.3. Event C (L'Aquila earthquake 6 April 2009; Mw = 6.3)
During event C, an accelerated dextral normal displacement to SW was recorded between 15 November 2007 and 23 February 2009 in Norcia and transient sinistral normal displacement to the SW between 20 June 2008 and 19 September 2008 in Colfiorito. No extraordinary fault slip was recorded in Castel Santa Maria during that period. Approximately two months after the extraordinary fault slip in Colfiorito, one earthquake occurred on 15 December 2008 with its epicentre very close to the Colfiorito site (Perugia, 15 December 2008, Ms = 4.2). Moreover, approximately 45 days after the accelerated normal displacement in Norcia a major earthquake in L'Aquila (Ms = 6.3) occurred on 6 April 2009.Walters et al. (2009) reported predominantly normal faulting mechanisms on fault planes striking NW-SE dipping 54° to the SW, with a minor right-lateral component. Many foreshocks were recorded before the L'Aquila earthquake from December 2008. Both recorded fault slips can be characterized as pre-seismic and normal faulting to the SW, corresponding to the L'Aquila earthquake focal mechanism. No other remarkable displacement was recorded during or after the L'Aquila earthquake.
5.3.4. Event D (no major earthquake in central Italy)
Event D was gradually recorded between 1 June 2011 and 8 November 2011 in Colfiorito (dextral reverse displacement), and then between 7 November 2011 and 21 May 2012 in Castel Santa Maria (dextral normal displacement), andfinally between 21 May 2012 and 11 May 2013 in Norcia (accelerated normal displacement with a minor sinistral component). No remarkable earthquake was recorded in cen-tral Italy during that period. Actually, the Emilia-Romagna earthquake Mw = 6.1 affected northern Italy on 20 May 2012. Nevertheless, its epicentre was about 300 km north of Colfiorito.
5.3.5. Event E (Amatrice–Norcia earthquakes sequence, August/October 2016; Mw = 5.3–6.5)
Event E was recorded between 19 December 2015 and 9 November 2016 in Castel Santa Maria and between 2 September 2016 and 30 October 2016 in Norcia. Subsequently, a remarkable fault extension was recorded in Colfiorito from November 2016. The dominant focal mechanism of the earthquake sequence is normal faulting along NNW–SSE trending faults.
Colfiorito site: No significant fault slip was recorded before or during a seismic sequence. The fault slip corresponds to very slow si-nistral normal displacement, which was monitored from the end of 2011. Only a minor fault extension was recorded in October 2016 and a sharp change of footwall block rotation, from anticlockwise monitored from the end of 2008 to clockwise after October 2016. A remarkable fault extension was later recorded from November 2016.
Norcia site: After a period of very slow normal displacement with an average velocity of approximately 0.06 mm/y recorded from 2013, an accelerated fault extension (from 0 mm/y to 0.5 mm/y) and normal displacement (average velocity increased from 0.06 mm/y to 0.8 mm/ y) began on 2 September 2016, i.e. eight days after the Amatrice earthquake. Slip development resulted to two co-seismic dextral normal displacements and remarkable fault extension recorded during the Norcia earthquakes on 26 and 30 October 2016. This corresponds to an approximately SW-NE extension during the earthquakes (see alsoGalli et al., 2018). Clockwise block rotation recorded from the end of 2013 finished during the earthquake of 30 October 2016 by remarkable an-ticlockwise rotation. No slip or rotation was recorded between then and the end of January 2017.
Castel Santa Maria site: Extraordinary contraction and dextral re-verse displacement was recorded between March 2016 and 11 November 2016. Contraction as well as reverse displacement dropped at the end of 2016/beginning of 2017. Extreme development is visible in both fault slip coordinate systems during 2016– as contraction and reverse displacement in the s,h,p system or an increasing vertical component in the x,y,z system.
The fault slip data recorded in Norcia and Castel Santa Maria sug-gest that the main earthquakes of the seismic sequence of central Italy in 2016 were preceded by a large deformational process affecting the central Apennines fault system between Amatrice and Camerino. It is supported by an earthquake Mw = 5.3 reported byLivio et al. (2016) with its epicentre close to Norcia, which occurred only 1 h after the Amatrice earthquake. From the long-term fault slip development, it is evident that this process started as soon as 2013 or 2009, after the L'Aquila earthquake when the strike-slip mode changed from dextral to sinistral in Norcia and dextral strike-slip development started in Castel Santa Maria. Moreover, an extraordinary contraction and dextral re-verse displacement were recorded in Santa Maria from the beginning of 2016 (at least from March), lasted until November 2016 and dropped at Fig. 10. Monthly and cumulative precipitation recorded in the Colfiorito and Norcia areas since 2002.
the end of 2016/beginning of 2017, i.e. approximately 2 months after the strongest earthquakes. Co-seismic fault slips recorded in Norcia and Castel Santa Maria correspond to the dextral normal displacement within the Norcia basin and the dextral reverse displacement in Castel Santa Maria. While a remarkable fault opening was recorded during the second earthquake of 30 October 2016, the Castel Santa Maria site was affected by compression which produced ENE oriented reverse dis-placement until mid-November 2016. Footwall block anticlockwise rotation was recorded during both the earthquakes in Norcia as well as in Castel Santa Maria. Rotation stopped during the last earthquake of 30 October as did the slip in Norcia. No other slips or rotations were re-corded there as of the end of January 2017.
5.4. Current tectonic regime
The results of the fault slip monitoring in central Apennines since 2002 has documented a generally switching extensional and compres-sional character. A causative local stress field (maximum horizontal compression) has an approximately SW-NE orientation. In addition, a period of remarkable extension was recorded during (in Norcia) and after (in Castel Santa Maria and Colfiorito) the Amatrice-Visso-Norcia earthquakes in 2016. These results seem to be in agreement with:
i) Fault data and earthquake focal mechanisms, which indicate a predominant NE-SW extension in the region, strike-slip and even reverse kinematics have also been determined (e.g. Cello et al., 1997;Ekström et al., 1998;Chiaraluce et al., 2004)
ii) The active extension of the central Apennines monitored by GPS (e.g.Serpelloni et al., 2005;Anzidei et al., 2005;Devoti et al., 2011; D'Agostino et al., 2011) as well as uplift of the Apennines chain (1–2 mm/y) and subsidence of the intramountain basins, approxi-mately 1 mm/y (Devoti et al., 2011).
iii) Geological data (i.e. preserved fault scarps, recent sediment offsets) also confirm the active extension rate of 1.0 to 3.1 mm/yr for the central Apennines during the period Late Pleistocene–Holocene (Papanikolaou et al., 2005;Faure Walker et al., 2010). The Qua-ternary slip rates have been estimated in the range 0.4- to 1.3-mm/ yr using paleoseismological analyses along the main normal faults (Barchi et al., 2000;Galadini and Galli, 2000; Pizzi et al., 2002; Boncio et al., 2004b;Blumetti et al., 2013;Cinti et al., 2011;Galli et al., 2011;Gori et al., 2011). Using earthquake displacement es-timation, Selvaggi (1998) estimated an extensional rate of 1.6–1.7 mm/yr, whereas Tondi and Cello (2003) speculated the displacement rate of the whole CAFS in the last 700 ka to be 1.6 cm/ year.
The dominant long-term anticlockwise horizontal block rotations recorded in Colfiorito and Norcia may correspond to the N-S oriented sinistral strike-slip mode in the broad fault zone close to or deeper part of the monitored faults (Cello et al., 1997). Moreover, these results agree or may explain strike-slip mechanism previously reported in the Colfiorito area, for instance the focal mechanism of the October 16 (Mw 4.3) aftershock documented byEkström et al. (1998).
6. Conclusions
The analyses of 3-D monitoring of strain along active faults out-cropping in the central Apennines during the period 2002–2017 re-vealed that recorded fault slips correspond to the principal stress with a SW-NE orientation and slightly dipping to the SW. It is in agreement to previous published results based on focal mechanisms analyses, GPS monitoring as well as geological data.
Moreover, the analyses revealed that fault slip development is non-linear and it is affected by remarkable transient periods of acceleration, which lasted up to several months. The recorded accelerations were induced by switching extensional and compressional stress/strain state
corresponding to the principal SW-NE stress.
Fault slip accelerations coincide with the periods of major seismic events that recently affected the central Apennines like the moderate L'Aquila 2009 and Norcia 2016 earthquakes. Regarding to these two earthquakes the recorded fault slips can be characterized as pre-seismic preceding both events.
Acknowledgements
This research was carried out in the framework of a series of projects focused on the monitoring of active tectonic structures and supported from the long term conceptual development research organisation RVO: 67985891. Initially, the work wasfinanced through an international European Science Foundation action COST 625 (3-D monitoring of active tectonic structures) supported by the Czech Ministry of Education, Youth and Sport for the period 2000–2006. The work then continued thanks to the project No. 205/06/1828 (3-D monitoring of micro-movements in the collision zone between African and Euro-Asian tectonic plates - 2006–2008) of the Grant Agency of the Czech Republic and, successively, though the project No. 205/09/2024 (Time-devel-opment analyses of micro-displacements monitored in the collision zone between African and Euro-Asian plates) and the infrastructural project CzechGeo/EPOS No. LM 2010008 (2010–2015) and No. LM 2015079 since 2016. The authors would also like to express their gra-titude to Professor G. Cello, for his assistance in the identification of suitable monitoring sites. Our special thanks go also to Mrs. and Mr. Gasperi, the land owners who gave us the permission to install our gauge in the cellar of their house in Norcia. Andfinally, the authors would like to thank the reviewers for their constructive comments which have served to greatly improve the clarity of the manuscript. References
Amato, A., Chiarabba, C., Selvaggi, G., 1997. Crustal and deep seismicity in Italy (30 years after). Ann. Geofis. 40, 981–993.
Amato, A., Azzara, R., Chiarabba, C., Cimini, G.B., Cocco, M., Di Bona, M., Margheriti, L., Mazza, S., Mele, F., Selvaggi, G., Basili, A., Boschi, E., Courboulex, F., Deschamps, A., Gaffet, S., Bittarelli, G., Chiaraluce, L., Piccinini, D., Ripepe, M., 1998. The 1997 Umbria-Marche, Italy, earthquake sequence: afirst look at the main shocks and aftershocks. Geophys. Res. Lett. 25, 2861–2864.
Angelier, J., Mechler, P., 1977. Sur une methode graphique de recherche des contraintes principales egalement utilisable en tectonique et en seismologie: la methode des diedres droits. Bull. Soc. Geol. Fr. 7 (6), 1309–1318.
Anzidei, M.P., Baldi, A., Pesci, A., Esposito, A., Galvani, F., Loddo, P., Cristofoletti, A., Massucci, S., Mese, Del, 2005. Geodetic deformation across the central Apennines from GPS data in the time span 1999-2003. Ann. Geophys. 48 (2), 259–271. Aringoli, D., Farabolini, P., Giacopetti, M., Materazzi, M., Paggi, S., Pambianchi, G.,
Pierantoni, P.P., Pistolesi, E., Pitts, A., Tondi, E., 2016. The August 24th 2016 Accumoli earthquake: surface faulting and Deep-Seated Gravitational Slope Deformation (DSGSD) in the Monte Vettore area. Ann. Geophys. 59https://doi.org/ 10.4401/ag-7199.Fast Track 5.
Bagh, S., Chiaraluce, L., De Gori, P., Moretti, M., Govoni, A., Chiarabba, C., Di Bartolomeo, P., Romanelli, M., 2007. Background seismicity in the central Apennines of Italy: the Abruzzo region case study. Tectonophysics 444, 80–92.https://doi.org/ 10.1016/j.tecto.2007.08.009.
Barchi, M., 2002. Lithological and structural controls on the seismogenesis of the Umbria region: observations from seismic reflection profiles. Boll. Soc. Geol. Ital., 1 (special volume), 855–864.
Barchi, M.R., Mirabella, F., 2009. The 1997–98 Umbria–Marche earthquake sequence: “Geological” vs. “seismological” faults. Tectonophysics 476, 170–179.https://doi. org/10.1016/j.tecto.2008.09.013.
Barchi, M., Galadini, F., Lavecchia, G., Messina, P., Michetti, A.M., Peruzza, L., Pizzi, A., Tondi, E., Vittori, E. (Eds.), 2000. Sintesi delle Conoscenze sulle Faglie Attive in Italia Centrale: Parametrizzazione ai Fini della Carattrizzazione della Pericolosità Sismica. CNR-GNDT, Rome, pp. 62.
Basili, R., Bosi, V., Galadini, F., Galli, P., Meghraoui, M., Messina, P., Sposato, A., 1998. The Colfiorito earthquake sequence of September-October 1997: Surface breaks and seismotectonic implications for the central Apennines (Italy). J. Earthq. Eng. 2, 291–302.
Bigi, S., Casero, P., Chiarabba, C., Di Bucci, D., 2012. Contrasting surface active faults and deep seismogenic sources unveiled by the 2009 L'Aquila earthquake sequence (Italy). Terra Nova 25, 21–29.https://doi.org/10.1111/ter.12000.
Blumetti, A.M., Guerrieri, L., Vittori, E., 2013. The primary role of the Paganica-San Demetrio fault system in the seismic landscape of the middle Aterno Valley basin (central Apennines). Quat. Int. 288, 183–194.https://doi.org/10.1016/j.quaint.
2012.04.040.
Boncio, P., Lavecchia, G., 2000. A geological model for the Colfiorito earthquakes (September–October 1997, central Italy). J. Seismol. 4, 345–356.
Boncio, P., Lavecchia, G., Pace, B., 2004a. Defining a model of 3D seismogenic sources for Seismic Hazard Assessment applications: the case of central Apennines (Italy). J. Seismol. 8 (3), 407–425.
Boncio, P., Lavecchia, G., Milana, G., Rozzi, B., 2004b. Seismogenesis in central Apennines, Italy: an integrated analysis of minor earthquake sequences and structural data in the Amatrice-Campotosto area. Ann. Geophys. 47, 1723–1742.
Boncio, P., Pizzi, A., Brozzetti, F., Pomposo, G., Lavecchia, G., Di Naccio, D., Ferrarini, F., 2010. Coseismic ground deformation of the 6 April 2009 L'Aquila earthquake (central Italy, Mw 6.3). Geophys. Res. Lett. 37, L06308.https://doi.org/10.1029/ 2010GL042807.
Borre, K., Cacoń, S., Cello, G., Kontny, B., Košťák, B., Likke Andersen, H., Moratti, G., Piccardi, L., Stemberk, J., Tondi, E., Vilímek, V., 2003. The COST project in Italy: analysis and monitoring of seismogenic faults in the Gargano and Norcia areas (central-southern Apennines, Italy). J. Geodyn. 36, 3–18.
Briestenský, M., Košťák, B., Stemberk, J., Petro, L., Vozár, J., Fojtíková, L., 2010. Active tectonic fault microdisplacement analyses: a comparison of results from surface and underground monitoring in western Slovakia. Acta Geodyn. Geomater. 7 (4), 387–397.
Briestenský, M., Rowberry, M.D., Stemberk, J., Stefanov, P., Vozar, J.,Šebela, S., Petro, L., Bella, P., Gaal, L., Ormukov, C., 2015. Evidence of a plate-wide tectonic pressure pulse provided by extensometric monitoring in the Balkan Mountains (Bulgaria). Geol. Carpath. 66, 427–438.https://doi.org/10.1515/geoca-2015-0035. Briestenský, M., Hochmuth, Z., Litva, J., Hók, J., Dobrovič, R., Stemberk, J., Petro, L´.,
Bella, P., 2018. Present-day stress orientation and tectonic pulses registered in the caves of the Slovenský kras Mts. (South-Eastern Slovakia). Acta Geodyn. Geomater. 15 (2), 93–103.https://doi.org/10.13168/AGG.2018.0007.
Calamita, F., Colforti, M., Farabollini, P., Pizzi, A., 1994. Le faglie normali quaternarie nella Dorsale appenninica umbro-marchigiana. Proposta di un modello di tettonica d'inversione. Studi Geol. Camerti 211–225.
Cavinato, G.P., Carusi, C., Dall'Asta, M., Miccadei, E., Piacentini, T., 2002. Sedimentary and tectonic evolution of Plio-Pleistocene alluvial and lacustrine deposits of Fucino Basin (central Italy). Sediment. Geol. 148, 29–59. https://doi.org/10.1016/S0037-0738(01)00209-3.
Cello, G., Mazzoli, S., Tondi, E., Turco, E., 1997. Active tectonics in the central Apennines and possible implications for seismic hazard analysis in peninsular Italy. Tectonophysics 272, 43–68.
Cello, G., Deiana, G., Ferelli, L., Marchegiani, L., Maschio, L., Mazzoli, S., Vittori, T., 2000. Geological constraints for earthquake faulting studies in the Colfiorito area (central Italy). J. Seismol. 4, 357–364.
Cheloni, D., De Novellis, V., Albano, M., Antonioli, A., Anzidei, M., Atzori, S., Avallone, A., Bignami, C., Bonano, M., Calcaterra, S., Castaldo, R., Casu, F., Cecere, G., De Luca, C., Devoti, R., Di Bucci, D., Esposito, A., Galvani, A., Gambino, P., Giuliani, R., Lanari, R., Manunta, M., Manzo, M., Mattone, M., Montuori, A., Pepe, A., Pepe, S., Pezzo, G., Pietrantonio, G., Polcari, M., Riguzzi, F., Salvi, S., Sepe, V., Serpelloni, E., Solaro, G., Stramondo, S., Tizzani, P., Tolomei, C., Trasatti, E., Valerio, E., Zinno, I., Doglioni, C., 2017. Geophys. Res. Lett. 44, 6778–6787.https://doi.org/10.1002/2017GL073580. Chiarabba, C., De Gori, P., Chiaraluce, L., Bordoni, P., Cattaneo, M., De Martin, M.,
Frepoli, A., Michelini, A., Monachesi, A., Moretti, M., Augliera, G.P., D'Alema, E., Frapiccini, M., Gassi, A., Marzorati, S., Di Bartolomeo, P., Gentile, S., Govoni, A., Lovisa, L., Romanelli, M., Ferretti, G., Pasta, M., Spallarossa, D., Zunino, E., 2005. J. Seismol. 9, 487.https://doi.org/10.1007/s10950-005-0633-9.
Chiarabba, C., Amato, A., Anselmi, M., Baccheschi, P., Bianchi, I., Cattaneo, M., Cecere, G., Chiaraluce, L., Ciaccio, M.G., De Gori, P., De Luca, G., Di Bona, M., Di Stefano, R., Faenza, L., Govoni, A., Improta, L., Lucente, F.P., Marchetti, A., Margheriti, L., Mele, F., Michelini, A., Monachesi, G., Moretti, M., Pastori, M., Piana Agostinetti, N., Piccinini, D., Roselli, P., Seccia, D., Valoroso, L., 2009. The 2009 L'Aquila (central Italy) Mw 6.3 earthquake: main shock and aftershocks. Geophys. Res. Lett. 36 (18), 1–6.https://doi.org/10.1029/2009GL039627.
Chiarabba, C., Bagh, S., Bianchi, I., De Gori, P., Barchi, M., 2010. Deep structural het-erogeneities and the tectonic evolution of the Abruzzi region (Central Apennines, Italy) revealed by microseismicity, seismic tomography, and teleseismic receiver functions. Earth Planet. Sci. Lett. 295, 462–476.
Chiaraluce, L., Amato, A., Cocco, M., Chiarabba, C., Selvaggi, G., Di Bona, M., Piccinini, D., Deschamps, A., Margheriti, L., Courboulex, F., Ripepeet, M., 2004. Complex normal faulting in the Apennines thrust-and-fold belt: the 1997 seismic sequence in central Italy. Bull. Seismol. Soc. Am. 94, 99–116.https://doi.org/10.1785/ 0120020052.
Chiaraluce, L., Di Stefano, R., Tinti, E., Scognamiglio, L., Michele, M., Casarotti, E., Cattaneo, M., De Gori, P., Chiarabba, C., Monachesi, G., Lombardi, A.M., Valoroso, L., Latorre, D., Marzorati, S., 2017. The 2016 central Italy seismic sequence: afirst look at the mainshocks, aftershocks and source models. Seismol. Res. Lett. 88 (3), 1–15.
https://doi.org/10.1785/0220160221.
Cinti, F.R., Pantosti, D., De Martini, P.M., Pucci, S., Civico, R., Pierdominici, S., 2011. Evidence for surface faulting events along the Paganica fault prior to the 6 April 2009 L'Aquila earthquake (central Italy). J. Geophys. Res. 116, B07308.https://doi.org/ 10.1029/2010JB007988.
Cipollari, P., Cosentino, D., 1995. Miocene unconformities in central Apennines: geody-namic significance and sedimentary basin evolution. Tectonophysics 252, 375–389.
https://doi.org/10.1016/0040-1951(95)00088-7.
Cipollari, P., Cosentino, D., Gliozzi, E., 1999a. Extension and compression related basins in central Italy during the Messinian Lago-Mare event. Tectonophysics 315, 163–185.
https://doi.org/10.1016/S0040-1951(99)00287-5.
Cipollari, P., Cosentino, D., Esu, D., Girotti, O., Gliozzi, E., Praturlon, A., 1999b.
Thrust-top lacustrine - lagoonal basin development in accretionary wedges: late Messinian (Lago-Mare) episode in the central Apennines (Italy). Palaeogeogr. Palaeoclimatol. Palaeoecol. 151, 149–166.https://doi.org/10.1016/S0031-0182(99)00026-7. Cirella, A., Piatanesi, A., Cocco, M., Tinti, E., Scognamiglio, L., Michelini, A., Lomax, A.,
Boschi, E., 2009. Rupture history of the 2009 L'Aquila (Italy) earthquake from non-linear joint inversion of strong motion and GPS data. Geophys. Res. Lett. 36 (19).
https://doi.org/10.1029/2009GL039795.
Civico, R., Pucci, S., Villani, F., Pizzimenti, L., De Martini, P.M., Nappi, R., Open EMERGEO Working Group, 2018. Surface ruptures following the 30 October 2016 Mw 6.5 Norcia earthquake, central Italy. J. Maps 14 (2), 151–160.
Cosentino, D., Cipollari, P., Marsili, P., Scrocca, D., 2010. Geology of the central Apennines: a regional review. In: Beltrando, M., Peccerillo, A., Mattei, M., Conticelli, S., Doglioni, C. (Eds.), The Geology of Italy. Journal of the Virtual Explorer (Electronic Edition). 36. pp. 11.
D'Agostino, N., Mantenuto, S., D'Anastasio, E., Giuliani, R., Mattone, M., Calcaterra, S., Gambino, P., Bonci, L., 2011. Evidence for localized active extension in the central Apennines (Italy) from global positioning system observations. Geology 39 (4), 291–294.https://doi.org/10.1130/G31796.1.
Dal Moro, G., Zadro, M., 1999. Remarkable tilt-strain anomalies preceding two seismic events in Friuli (NE Italy): their interpretation as precursors. Earth Planet. Sci. Lett. 170, 119–129.
De Natale, G., Crippa, B., Troise, C., Pingue, F., 2011. Abruzzo, Italy, earthquakes of April 2009: Heterogeneous fault-slip models and stress transfer from accurate inversion of ENVISAT-InSAR data. Bull. Seismol. Soc. Am. 101 (5), 2340–2354.https://doi.org/ 10.1785/0120100220.
Devoti, R., Esposito, A., Pietrantonio, G., Pisani, A.R., Riguzzi, F., 2011. Evidence of large scale deformation patterns from GPS data in the Italian subduction boundary. Earth Planet. Sci. Lett. 311, 230–241.https://doi.org/10.1016/j.epsl.2011.09.034. Di Domenica, A., Pizzi, A., 2017. Defining a mid-Holocene earthquake through
speleo-seismological and independent data: implications for the outer central Apennines (Italy) seismotectonic framework. Solid Earth 8, 161–176.https://doi.org/10.5194/ se-8-161-2017.
Ekström, G., Morelli, A., Boschi, E., Dziewonski, A.M., 1998. Moment tensor analysis of the central Italy earthquake sequence of September-October 1997. Geophys. Res. Lett. 25 (11), 1971–1974.
EMERGEO Working Group, 2010. Evidence for surface rupture associated with the Mw 6.3 L'Aquila earthquake sequence of April 2009 (central Italy). Terra Nova 22 (1), 43–51.https://doi.org/10.1111/j.1365-3121.2009.00915.x.
EMERGEO Working Group, 2016. Coseismic effects of the 2016 Amatrice seismic se-quence:first geological results. Ann. Geophys. 59, 5. https://doi.org/10.4401/ag-7195.
Falcucci, E., Gori, S., Peronace, E., Fubelli, G., Moro, M., Saroli, M., Galadini, F., 2009. The Paganica fault and surface coseismic ruptures caused by the 6 April 2009 earthquake (L'Aquila, central Italy). Seismol. Res. Lett. 80 (6), 940–950.https://doi. org/10.1785/gssrl.80.6.940.
Falcucci, E., Gori, S., Moro, M., Pisani, A.M., Melini, D., Galadini, F., Fredi, P., 2011. The 2009 L'Aquila earthquake (Italy): What's next in the region? Hints from stress dif-fusion analysis and normal fault activity. Earth Planet. Sci. Lett. 305, 350–358.
https://doi.org/10.1016/j.epsl.2011.03.016.
Faulkner, D.R., Mitchell, T.M., Healy, D., Heap, M.J., 2007. Slip on weak fault by the rotation of regional stress in the fracture damage zone. Nature 444, 922–925.https:// doi.org/10.1038/nature05353.
Faure Walker, J.P., Roberts, G.P., Sammonds, P.R., Cowie, P., 2010. Comparison of earthquake strains over 102 and 104 year timescales: Insights into variability in the seismic cycle in the central Apennines, Italy. J. Geophys. Res. Solid Earth 115 (10), 1–26.https://doi.org/10.1029/2009JB006462.
Ferrario, M.F., Livio, F., 2018. Characterizing the distributed faulting during the 30 October 2016, central Italy earthquake: a reference for fault displacement hazard assessment. Tectonics 37 (5), 1256–1273.https://doi.org/10.1029/2017TC004935.
Fossen, H., 2010. Extensional tectonics in the North Atlantic Caledonides: a regional view. In: Law, R., Butler, R., Holdsworth, B., Krabbendam, R.A., Strachan, M. (Eds.), Continental Tectonics and Mountain Building: The Legacy of Peach and Horn. 335. Geological Society Special Publication, pp. 767–793.
Galadini, F., Galli, P., 2000. Active tectonics in the central Apennines (Italy) - input data for seismic hazard assessment. Nat. Hazards 22 (3), 225–268.https://doi.org/10. 1023/A:1008149531980.
Galli, P., Giaccio, B., Messina, P., Peronace, E., Zuppi, G.M., 2011. Palaeoseismology of the L'Aquila faults (central Italy, 2009, Mw 6.3 earthquake): implications for active fault linkage. Geophys. J. Int. 187 (3), 1119–1134. https://doi.org/10.1111/j.1365-246X.2011.05233.x.
Galli, P., Castenetto, S., Peronace, E., 2017. The macroseismic intensity distribution of the 30 October 2016 earthquake in central Italy (Mw 6.6): seismotectonic implications. Tectonics 36 (10), 2179–2191.
Galli, P., Galderisi, A., Ilardo, I., Piscitelli, S., Scionti, V., Bellanova, J., Calzoni, F., 2018. Holocene paleoseismology of the Norcia fault system (central Italy). Tectonophysics 745, 154–169.https://doi.org/10.1016/j.tecto.2018.08.008.
Gao, S., Silver, P.G., Linde, A.T., 2000. Analysis of deformation data at Parkfield, California: detection of a long-term strain transient. J. Geophys. Res. 105 (B2), 2955–2967.
Gori, S., Giaccio, B., Galadini, F., Falcucci, E., Messina, P., Sposato, A., Dramis, F., 2011. Active normal faulting along the Mt. Morrone south-western slopes (central Apennines, Italy). Int. J. Earth Sci. 100 (1), 157–171.https://doi.org/10.1007/ s00531-009-0505-6.
Gosar, A.,Šebela, S., Košťák, B., Stemberk, J., 2009. Surface versus underground mea-surements of active tectonic displacements detected with TM-71 extensometers in western Slovenia. Acta Carsol. 38, 213–226.