RICERCA E
SPERIMENTAZIONE/
RESEARCH AND
EXPERIMENTATION
[email protected] [email protected] [email protected] [email protected]Maria Federica Ottone, Roberta Cocci Grifoni, Graziano Enzo Marchesani, Dajla Riera, Facoltà di architettura, Università degli studi di Camerino, Italia
Densità - intensità. Elementi materiali ed immateriali per
una valutazione della qualità urbana
Abstract. La ricerca si pone come obiettivo quello di pervenire ad un bilancio critico scientifico su alcuni aspetti relativi al tema della “resilienza urbana”, per offrire a pianificatori e decisori uno strumento agile di intervento per la mitiga-zione delle temperature nelle aree urbane: densificamitiga-zione, morfologia, materiali sono criteri utilizzati per suggerire strategie volte a migliorare la qualità della vita nelle città. Il punto di vista indagato analizza il cambiamento climatico e la sua connessione antropica, la densità urbana e la sua valenza energetica, l’evolu-zione materica e la gestione del comfort ambientale, considerando il rapporto orizzontale/ verticale come uno dei parametri morfologici capaci di determinare la relazione tra densità, forma degli spazi e isola di calore urbana.
Parole Chiave: Cambiamenti climatici; Tecnologie per l’ambiente costruito; Isola di calore urbano.
Il tema della sostenibilità
am-bientale dei processi di
trasfor-mazione urbana ha modificato in modo sostanziale la
tradizio-nale visione della città. L’architetto/urbanista sta perdendo
pro-gressivamente il ruolo di “regista” delle trasformazioni urbane,
nel momento in cui le problematiche ambientali hanno
intro-dotto nuovi temi da affrontare e risolvere. Nei paesi in via di
svi-luppo, dove più alta è la presenza di disuguaglianze e di anomalie
nella crescita delle città, è ormai acquisita la consapevolezza di
dover affrontare il progetto urbano con un’ottica
multidisciplina-re più spinta (Balbo, 2005).
«La prevalenza delle tematiche legate ai processi economici,
so-ciali e ambientali, ai problemi della salute e della sicurezza, è un
dato di fatto e rischia di rendere il contributo
dell’architetto-ur-banista poco significativo e, in qualche caso, inutile» (Waldheim,
2006).
C’è bisogno dunque di un aggiornamento culturale complessivo
che preveda da una parte che non venga perduto un patrimonio
prezioso di contributi specifici che hanno definito nel passato i
caratteri qualitativi delle città (forma, funzione, ecc). Dall’altra
che la disciplina dell’architettura modifichi e aggiorni le proprie
metodologie di indagine rivedendo e reinterpretando i termini e i
parametri che hanno costituito per molti anni un sicuro appoggio
disciplinare, appannaggio esclusivo delle discipline urbanistiche.
Le teorie urbane, a partire dall’800 con i testi di Camillo Sitte
(Sitte, 1981), fino ad arrivare ai giorni nostri con le teorizzazioni
di Rem Koolhaas (Koolhaas, 2006) e di Bernardo Secchi
(Sec-chi, 2009), hanno progressivamente descritto i fenomeni urbani
come un “disegno” più o meno definito e più o meno flessibile,
nel quale l’architetto urbanista appare come il fautore principale
(o la vittima nel caso di Koolhaas) delle trasformazioni.
Queste teorie, con differenti accezioni ed equilibri, si basavano
principalmente su parametri di lettura riferiti alla forma e alla
funzione:
– forma e dimensione degli spazi aperti;
– forma e disposizione degli edifici;
– vie di comunicazione e infrastrutture;
– destinazioni d’uso delle aree (zoning), definite in base ad
equilibri tra le diverse funzioni (aree residenziali,
industria-li, terziarie, ecc). Negli anni ‘70, le teorie di architetti come
Aldo Rossi (Rossi, 1966), Robert Venturi & Denise Scott
Brown (Venturi, 1977), e altri importanti figure di
architetti-intellettuali, hanno influenzato intere generazioni di studiosi,
ricercatori e progettisti che hanno realizzato progetti
secon-do un’ottica one-eyed approach.
Introduzione
Density - intensity.
Material and immaterial
elements in assessing
urban quality
Abstract. The objective of this research is to produce a critical scientific analysis of some aspects related to urban resilience to offer planners and decision-makers a deft intervention tool to mitigate high temperatures in urban areas. Densifica-tion, morphology, and materials are used to suggest strategies aimed at improv-ing the quality of life in cities. This point of view analyses climate change and its connection to humans, urban den-sity and its energy value, the evolution of materials, and the management of environmental comfort, considering the horizontal/vertical relationship as one of the morphological parameters capable of determining the connections between density, the form of the spaces, and the urban heat island.
Keywords: Climate change; Technolo-gies for the built environment; Urban heat island.
Introduction
The theme of environmental sustain-ability in urban transformation pro-cesses has substantially modified the traditional view of cities. Architects/ urban planners are progressively los-ing their role as directors of urban transformations, since environmental problems have introduced new aspects to address and resolve. In developing countries, where there is greater in-equality and anomalies in city growth, there is now an awareness that urban design must be undertaken with a more explicit multidisciplinary view (Balbo, 2005). ‘The process of urbani-zation, capital accumulation, deregu-lation, globalization, environmental protection, and so on, are much more significant for the shaping of urban relationship than are the spatial forms of urbanism in and of themself.’ (Wald-heim, 2006).
There is thus a need for an overall cul-tural renewal that ensures, on the one hand, that a precious heritage of spe-cific contributions that have defined the qualitative characteristics of cities (form, function, etc.) in the past are not lost. On the other hand, architec-ture as a discipline should modify and update its own investigation methods, reviewing and reinterpreting the terms and parameters that have constituted reliable disciplinary support for many years, the exclusive prerogative of urban-planning disciplines.ùStarting in the 1800s with the texts by Camillo Sitte (Sitte, 1981), and continuing to-day with the work by Rem Koolhaas (Koolhaas, 2006) and Bernardo Sec-chi (SecSec-chi, 2009), urban theories have increasingly described urban phenomena as a more or less definite and flexible ‘design’ in which the urban architect is the main advocate (or
vic-Oggi questo approccio non è sufficiente per rendere efficaci gli
interventi sulle città. La sempre maggiore incidenza dei temi
le-gati alla sostenibilità ambientale nei processi di crescita e di
tra-sformazione urbana, richiede uno sforzo nella direzione di una
disponibilità alla contaminazione culturale e al rinnovo delle
discipline.
Lo studio evidenzia come i nuovi strumenti di indagine
preco-ce, basati su programmi parametrici e modelli di
ottimizzazio-ne, possono essere piegati per costruire piattaforme di lavoro
condivise che rendono estremamente rapida, efficace e mirata
l’indagine su tessuti urbani complessi, con l’obiettivo precipuo di
pervenire al miglioramento della qualità della vita nelle città. Si
ritiene infatti che vadano implementate e arricchite quelle
inda-gini che tendono ad evidenziare una sincronizzazione tra basso
impatto energetico e qualità della vita, dimostrando che dove
vengono adottate misure passive con il fine di ridurre l’impatto
energetico, si vive meglio termini di comfort urbano.
Il clima e i cambiamenti
clima-tici hanno da sempre
rappre-sentato uno dei fattori principali di mutamento non solo della
società ma anche nell’aspetto delle città stessa (Behringer, 2013).
Nel corso dei millenni i cambiamenti climatici si sono verificati
molte volte nella storia determinando evoluzioni della società,
delle città e dei paesaggi, che si sono ri-adattati e ri-plasmatI
in base ai nuovi scenari che si stavano prospettando (Scuderi,
2014).
Oggi non si può progettare il nuovo o agire sull’esistente senza la
presa di coscienza che il raggiungimento del comfort urbano sia
un obiettivo imprescindibile al pari della forma,
dell’organizza-zione funzionale e della dimensione/propordell’organizza-zione del costruito.
Da questo punto di vista, un progetto urbano e/o
architettoni-co può riuscire a architettoni-controllare la architettoni-complessità derivante dalla presa
d’atto in contemporanea dei parametri individuati come
impre-scindibili, considerando tutte le possibili variabili. La ricerca
svolta si propone di delineare un abaco di città caso studio, la
cui analisi viene condotta tenendo in considerazione tre
fatto-ri fatto-ritenuti determinanti nella valutazione della qualità’ urbana:
climatico, empatico, tecnologico. La metodologia sviluppata
consentirà di gestire la complessità delle relazioni non lineari
tra le variabili meteorologiche e i rapporti geometrici della
cit-tà che caratterizzano il microclima urbano (definendo l’impatto
dell’urbanizzazione sulle condizioni climatiche locali e fattori di
mitigazione), i possibili interventi tecnologici tesi a modificare
i rapporti tra superfici permeabili/impermeabili, i valori di
al-bedo e la gestione dei flussi termici ed infine le questioni legate
all’aspetto empatico dell’architettura inteso come «catalizzatore
emozionale e veicolo di trasmissione ideale di contenuti
social-mente condivisi» (Garramone, 2013) e misurabile attraverso gli
indici di Comfort.
Oltre a considerare «[…] imprescindibile il ricorso
all’immis-sione di nuovi strumenti e nuovi dati all’interno dei parametri
progettuali contemporanei» (Scuderi, 2014), si è ritenuto
ope-rare un primo studio all’interno di una gamma di indicatori che
fanno riferimento specifico ai temi del cambiamento climatico
e del consumo di suolo, intrecciandoli con i fattori di forma e
dimensionali del costruito.
Si parte dal concetto che l’individuo stabilisce inevitabilmente un
rapporto empatico con l’ambiente che lo circonda. Non si parla
più di spazio urbano di reminiscenza modernista, ossia
conce-Evoluzione in atto
tim, as in the case of Koolhaas) of the transformations.
Albeit with different meanings and balances, such theories are mainly based on interpretational parameters referring to the form and function: - form and dimensions of open spaces; - form and arrangement of buildings; - communication and infrastructure
routes;
- the permitted use of areas (zoning), defined based on balances among different functions (residential, in-dustrial, service, etc.). In the 1970s, theories by architects such as Aldo Rossi (Rossi, 1966), Robert Venturi & Denise Scott Brown (Ven-turi,1977), and other important architect/intellectual figures influ-enced entire generations of schol-ars, researchers, and designers who realized projects according to a one-eyed approach.
Today, this approach is no longer suf-ficient for making efsuf-ficient interven-tions on cities. The increasing inci-dence of topics tied to environmental sustainability in processes of growth and urban transformation requires an effort to be open to cultural in-fluence and disciplinary renewal. This study highlights how new early-investigation tools based on paramet-ric programmes and optimization models can be moulded to build plat-forms of shared work that make the investigation of complex urban fabrics extremely quick, effective, and focused, with the primary goal of improving the quality of life in cities. In fact, it is be-lieved that the investigations that are implemented and enriched are those that tend to highlight synchronization between low energy impact and qual-ity of life, demonstrating that where passive measures are adopted to
re-duce the energy impact, people live better in terms of urban comfort.
Current evolution
The climate and climate change have always represented primary factors of change, not only with respect to soci-ety, but also in the appearance of the city itself (Behringer, 2013). Climate change has occurred many times throughout history, leading to changes in society, cities, and landscapes, which have been readapted and reshaped based on new scenarios that were be-ing projected (Scuderi, 2014). Today, nothing new can be designed or existing aspects intervened on with-out being aware that achieving urban comfort is an unavoidable objective, just like the form, functional organiza-tion, and dimension/proportion of the built area. From this point of view, an urban and/or architectural design can
control the complexity deriving from simultaneously implementing the nec-essary parameters and considering all the possible variables.
This research aims to delineate a ma-trix of case studies — cities — whose analysis is performed in consideration of three factors deemed decisive in the evaluation of urban quality: cli-mate, empathy, and technology. The methodology developed will allow designers to manage the complexity of non-linear relationships among the meteorological variables and geomet-ric ratios that characterize the urban microclimate (defining the impact of urbanization on local climate condi-tions and mitigation factors). It will also for the management of possible technological interventions designed to modify the relationships between surface permeability/impermeability, albedo values, and thermal fluxes.
pito prevalentemente come spazio destinato allo spostamento di
mezzi di trasporto che ha caratterizzato gli ultimi 150 anni di
pianificazione. Oggi prevale il concetto di “città per le persone”
(Gehl, 2017) puntualizzando su «[...] quanto sia importante dare
attenzione alle persone in città per avere città vivaci, sicure,
so-stenibili e sane, tutti obiettivi importanti per il XXI secolo».
Un esempio concreto di questa inversione di tendenza, la si può
identificare nelle diverse operazioni che la città di Copenaghen
sta mettendo in atto.
Attraverso strategie di pianificazione e progettazione urbana il
fulcro dello spazio costruito si sposta dal traffico di veicoli alla
persona, al traffico lento, agli spazi di aggregazione, allo sviluppo
dell’infrastruttura verde, non solo sul piano orizzontale a quota
zero, ma anche al di sopra degli edifici, “green roof”
1.
Un caso studio che unisce i vari parametri descritti possono
essere racchiusi nel progetto del 2013/2014 di Philippe Rahm
“Public Air” dove la città di Copenaghen chiede di riprogettare
l’intera rete ciclabile e pedonale, cercando di separarla dal
flus-so dei veicoli e prendendo in considerazione parametri come i
materiali del suolo e delle facciate e la relazione che
quest’ulti-me con l’uomo. «[...] ad esempio le facciate potrebbero assorbire
il suono o i materiali potrebbero essere riscaldati in inverno o
comunque apportare del comfort alle persone» (Scuderi, 2014).
Il tema del controllo dell’isola di calore urbana associato ad una
maggiore attenzione ai parametri di vivibilità strettamente legati
alla persona possono generare interventi interessanti con punti
di vista alternativi e innovativi.
Non sempre, però, si necessita di pesanti interventi architettonici
per migliorare il comfort urbano. Con un’attenta lettura e corretti
strumenti di analisi, si può capire nel dettaglio dove e come agire.
Un esempio di intervento leggero a livello di impatto sulla città
lo ritroviamo a New York, NYC° COOL ROOFS
2. Questo
pro-gramma, svolto in collaborazione tra NYC Service e NYC
De-partment of Buildings, ha coinvolto un gruppo di volontari e
proprietari di edifici che per migliorare il comfort urbano hanno
deciso di dipingere i tetti di alcune costruzioni con un
materia-le rifmateria-lettente, bianco, riducendo l’assorbimento del calore solare,
con la conseguente diminuzione fino al 30% delle temperature
all’interno dell’edificio. Grazie all’alta riflettanza del colore si
ri-duce anche la temperatura nelle zone circostanti, contribuendo
a contrastare l’isola di calore urbana.
Ma come si possono determinare parametri iniziali capaci di
re-stituire una visione il più possibile oggettiva del comfort di una
specifica area? La tecnologia immateriale in questo caso è un
fat-tore determinante. Un progetto urbano deve poter usufruire di
dati certi, derivanti da un complesso di strumenti tecnologici in
grado di monitorare i fenomeni ambientali e umani per poter
poi essere elaborati in analisi preliminari complesse capaci di
racchiudere le molteplici informazioni che derivano da diversi
ambiti.
La tecnologia immateriale è figlia di questo nuovo millennio, e
pervade la città in ogni suo ambito delineando una nuova
in-frastruttura importante sia per le analisi progettuali sia per una
buona vivibilità e funzionalità dello spazio. Questo sistema di
controllo invisibile e’, e sara’ ancora di più in futuro, presente in
ogni dimensione dello spazio urbano e privato, come strumento
necessario per prevedere e progettare la città.
Si passa quindi, dalla smart city alla “senseable city” definita da
Carlo Ratti: «Ottimizzazione più umanizzazione non da adito ad
un computer di dimensione metropolitana né ad un far west
co-Finally, it will address questions tied to the empathic aspect of architecture intended as an ‘emotional catalyst and an ideal transmission vehicle for con-tent that can be shared socially (Gar-ramone, 2013) and measured through comfort indices.
In addition to deeming necessary re-course to the inclusion of new tools and data within contemporary de-sign parameters (Scuderi, 2014), it an initial study was made within a range of indicators that refer specifically to the theme of climate change and land consumption, interweaving them with factors related to the form and dimen-sion of the built environment. The initial concept is that individu-als inevitably establish an empathic relationship with the surrounding en-vironment. One no longer speaks of urban space with a Modernist remi-niscence, that is, a city designed mainly
as a space destined for the movement of transport, which has characterized the last 150 years of planning. Rather, what prevails today is the concept of “cities for people” (Gehl, 2017) that see «[…] how important it is to pay atten-tion to people in cities in order to have vibrant, safe, sustainable, and healthy cities, all important objectives for the twenty-first century».
A concrete example of this change in trend can be seen in the different op-erations that the City of Copenhagen is implementing. Through urban planning and design strategies, the focus of the built space has moved from vehicle traf-fic to people, to slow spaces, to spaces for interaction, to the development of green infrastructure, not only on the horizon-tal plane on the ground floor, but also on top of the buildings, i.e., ‘green roofs’1.
One example that combines the various parameters described above is the by
Philippe Rahm, Public Air, where the City of Copenhagen requested that the entire biking and pedestrian network be redesigned in order to separate it from the flow of vehicles. Emphasis was placed on parameters such as the ma-terials used on the ground and façades and their relationship with people. «[…] for example, the façades could absorb sound or the materials could be warmed in winter or at least lead to hu-man comfort» (Scuderi, 2014). The idea of controlling the urban heat island by placing more attention on the parameters of liveability, prioritiz-ing people, can generate interestprioritiz-ing interventions from alternative, innova-tive points of view. However, weighty architectural interventions are not always needed to improve urban com-fort. With a careful reading and correct analysis tools, one can understand in detail where and how to act.
One example of light intervention on the level of city impact is found in New York with its NYC ºCoolRoofs programme, carried out in collabora-tion with NYC Service and the NYC Department of Buildings2. The
initia-tive involves a group of volunteers and building owners who decided to im-prove urban comfort by painting the roofs of some buildings with a white reflective material, reducing the ab-sorption of heat from the Sun and con-sequently decreasing the internal tem-perature of the building by up to 30%. Thanks to the high reflectance of the colour chosen, the temperature of the surrounding area is also reduced, help-ing to counteract the urban heat island. 2 But how can the initial parameters be determined in order to render the most objective vision possible of the comfort of a specific area? Immaterial technology in this case is a decisive
struito in rete. È la convergenza di bit e atomi: sistemi e cittadini
interagiscono» (Ratti, 2017).
Se si integra la tecnologia all’interno del tessuto urbano, essa
diviene mezzo di trasmissione di dati reali e utilizzabili, sia dal
punto di vista dei flussi di veicoli, di persone e di dati climatici.
Il dato ambientale implementato con le attuali tecnologie di
tra-smissione delle informazioni, potrebbe essere potenziato e
facil-mente utilizzato, prendendo il posto delle ancora rare stazioni di
rilevamento sparse nel territorio. Nel futuro, la persona che abita
la città potrebbe essere vettore e trasmettitore di dati in luoghi
specifici mappando con precisione tutto lo spazio urbano.
La forma della città, la sua
strut-tura, la densità e le sue
caratteri-stiche morfologiche e materiche
sono elementi da sempre indagati nell’analisi dell’evoluzione delle
città e del suo cambiamento. Lo studio della interconnessione
tra morfologia, clima ed energia ha caratterizzato nei tempi gran
parte della storia della città e dell’architettura (De Pascali, 2008,
Givoni, 1998, Olgyay, 1963, Rogora, 2012, Barucco, 2007). In
par-ticolare la morfologia urbana, che studia le forme della città, ha
garantito un solido sostegno alla analisi dei principali fattori che
hanno determinato l’assetto spaziale, le sue mutazioni nel tempo
e le alterazioni a volte anche brutali di un determinato
paesag-gio costruito. La morfologia della città contemporanea è mutata
coerentemente con le evoluzioni della società che la abita e delle
attività che si distribuiscono sul territorio generando processi di
di de-urbanizzazione e di ri-urbanizzazione. Una complessità del
sistema urbano, fortemente legato anche alla proiezione locale
(sempre più evidente) di un cambiamento climatico globale.
La grande portata di tali sollecitazioni e delle trasformazioni in
atto comporta, necessariamente, un cambiamento anche negli
strumenti che ad oggi sono stati utilizzati per lo studio e
l’ana-lisi dei fenomeni urbani e delle strategie di intervento a scala
urbana e architettonica, che ad oggi purtroppo si sono rivelati
insufficienti nel garantire il raggiungimento di quegli obiettivi
legati agli aspetti energetici ed alla qualità ambientale della città.
Sono necessari strumenti capaci di modellare la complessità
del-la città (Barucco 2007) intesa come connessione di elementi che
concorrono nella generazione dello spazio edificato, secondo
logiche aggregative individuabili da parametri. I modelli
para-metrici consentono di associare informazioni ai modelli digitali
di simulazione che possono essere considerati come “contenitori
informativi” consultabili in tempo reale e rapidi nei loro tempi
di utilizzo. La modellazione parametrica si basa sulla
formaliz-zazione di vincoli ed elementi in grado di connettere e mettere a
sistema variabili formali e relazioni (ad esempio climatiche,
am-bientali, energetiche). Tali programmi (i.e Grasshopper ed i suoi
plug in) possono gestire modalità di rappresentazione verticale
per l’ambiente costruito e sono parallelamente in grado di
aggre-gare orizzontalmente secondo le logiche più disparate, in modo
da caratterizzare la complessa densità urbana. Da queste
consi-derazioni si origina la necessità di un proporre un nuovo
stru-mento basato sul paradigma associativo delle informazioni
ca-pace di disegnare la città complessa, legarla a tutte le sue
solleci-tazioni esterne (forzanti climatiche, vincoli energetici, variazioni
materiche, etc) e leggere in tempi contenuti le caratteristiche del
tessuto urbano e le condizioni di comfort ambientali generate. Si
propone, quindi, uno strumento parametrico per la generazione
di volumi urbani (sostitutivo alle tecniche classiche del disegno
Materiali e metodologia
proposta
factor. An urban design should be able to make use of certain data deriving from a set of technological tools to monitor environmental and human phenomena. The data can then be pro-cessed in complex preliminary analysis that encompasses the varied informa-tion deriving from different areas. Im-material technology is the fruit of this new millennium, permeating the city in each of its areas and delineating a new infrastructure that is important both for design analysis and for the good liveability and functionality of the space. This system of invisible con-trol is — and will be even more in the future — present in every dimension of urban and private space as a neces-sary tool to foresee and design the city. There is a shift, therefore, from a smart city to the ‘senseable city’ defined by Carlo Ratti: «Optimization plus hu-manization do not give access to a
metropolitan- seized computer nor to a network-based far west. It is the convergence of bits and atoms; systems and citizens interact» (Ratti, 2017). If technology is integrated within the urban fabric, it becomes the means to transmit real, usable data regard-ing flows of vehicles, people, and the climate. Environmental data imple-mented with current information-transmission technologies could be strengthened and used easily, taking the place of the sparse surveying sta-tions spread over the territory. In the future, a person living in the city could be a vector and transmitter of data in specific places, mapping the entire ur-ban space with high precision.
Materials and methodology pro-posed
The form of the city, its structure, den-sity, and morphological and material
characteristics are elements that have always been investigated when ana-lysing the evolution of cities and the change in evolution. The study of the interconnection between morphol-ogy, climate, and energy has, over time, characterized a large part of the history of cities and architecture (De Pascali, 2008, Givoni, 1998, Olgyay, 1963, Rogora, 2012, Barucco, 2007). In particular, urban morphology, which studies the form of the city, has guar-anteed solid support for the analysis of the main factors that determine the spatial structure, its changes over time, and the sometimes violent al-terations in a given built landscape. The morphology of contemporary cities has changed along with changes in the resident societies and activities distributed throughout the territory, generating de-urbanization and re-ur-banization processes. It is an intricate
urban system that is also closely tied to the (increasingly evident) local projec-tion of global climate change. The great weight of these demands and current transformations necessarily also leads to a change in the tools that are used today to study and analyse urban phenomena and strategies for intervention on an urban and archi-tectural scale. As of today, however, these have unfortunately been shown to be insufficient in guaranteeing the achievement of those objectives tied to energy and the environmental qual-ity of the cqual-ity. What is necessary are tools that are capable of modelling the city’s complexity (Barucco 2007), in-tended as a combination of elements that generate the built space according to a logic of aggregation that can be identified via parameters. Parametric models allow information to be asso-ciated with digital simulation models,
manuale) capace di modificare rapidamente le geometrie e le
caratteristiche materiche della “porzione” di città considerata e
permettere l’analisi ed il confronto tra molteplici scenari.
Il workflow sviluppato si compone di 3 fasi sviluppate in
am-biente Grasshopper:
1) La prima fase riguarda la composizione dell’aggregato urbano.
L’intero processo di generazione delle geometrie urbane richiede
le geometrie del perimetro più esterno a scala urbana e la
viabi-lità principale sotto forma di spezzate aperte
In tale fase avviene la definizione delle geometrie urbane.
Par-tendo dal perimetro più esterno, che conterrà tutti gli edifici e le
strade si definisce il set di strade principali presenti sul territorio
e, quindi, il formarsi di agglomerati, strade secondarie e aree
ver-di. L’intero processo è regolato da una serie di parametri:
– lato massimo dell’isolato;
– rapporto di forma dei lotti;
– offset dal fronte strada principale;
– offset da altre strade;
– lato del lotto interno;
– dimensione della corte interna;
– range di altezza degli edifici.
Questo strumento assegna le caratteristiche elencate a zone
omogenee permettendone la modifica in tempo reale (Fig. 1).
2) La seconda fase utilizza Urban Weather Generator (UWG)
connesso a Grasshopper mediante il plug in di Grassopper
Dra-gonfly (Mackey, et al., Aug 7-9 2017). UWG è un tool sviluppato
dal Massachusetts Institute of Technologies per analizzare gli
ef-fetti locali generati dalle geometrie urbane sul comfort urbano e
sul consumo energetico. Rappresenta uno strumento di
simula-zione atmosfera-costruito in grado di valutare l’effetto “isola di
calore urbana” e modificare un file di dati meteorologici generici
(qui chiamati “rural”) in un file di dati meteorologici “urban”. Il
suo compito è quello di trasformare dati meteo solitamente
rile-vati in stazioni extraurbane (es. gli aeroporti) in dati
meteorolo-gici più aderenti alle caratteristiche morfologiche, materiche e di
utilizzo della città. La rielaborazione del dato è possibile grazie
all’utilizzo di molti parametri, quali per esempio le proprietà dei
materiali (suoli, tetti, pareti), la forma urbana, la generazione di
calore antropogenica (in strada e all’interno di edifici) e la e la
presenza di aree verdi. UWG non si Limita al calcolo di fattori
tradizionali come lo Sky View Factor o il rapporto di verticalità
del canyon urbano, ma approfondisce l’analisi calcolando diversi
which can be considered “information containers” that are quick to use and can be consulted in real time. Para-metric modelling is based on the for-malization of limits and elements that connect and systematize formal and relational variables, e.g., climate, envi-ronment, energy. These programmes, i.e., Grasshopper and its plug-ins, are able to manage means of vertical rep-resentation for the built environment and, in parallel, are also capable of horizontal aggregation according to the most varied logic, thereby allowing the complex urban density to be char-acterized. These considerations give rise to the need to propose a new tool based on the association of informa-tion. The tool is capable of drawing the complex city, tying it to all external de-mands (climate forcing, energy limits, changes in materials, etc.) and quickly reading the characteristics of the urban
fabric and conditions of environmen-tal comfort generated. Therefore, a parametric tool is proposed to gener-ate urban volumes (replacing the clas-sical technique of manual drawing), quickly modifying the geometries and material characteristics of the given portion of city and allowing for the analysis and comparison of multiple scenarios. The workflow developed is composed of three phases developed in the Grasshopper environment: 1) The first phase regards the composi-tion of the urban aggregate. The entire process to generate the urban geom-etries requires the geomgeom-etries of the outermost urban perimeter and the main practicability under the form of open fragments. This phase entails the definition of the urban geometries. Starting from the outermost perimeter, which should contain all the buildings and roads, the set of main streets
pre-sent in the territory is defined, thus forming the agglomerates, secondary streets, and green areas. The entire process is regulated by a series of pa-rameters:
- maximum side of the block; - ratio of shape of the plots; - offset from the front main street; - offset from other streets; - side of the internal plot; - size of the internal courtyard; - range of heights of the buildings; This tool assigns these characteristics to uniform zones, allowing for their modification in real time (Fig. 1). 2) The second phase uses the Urban Weather Generator (UWG), which is connected to Grasshopper through the Grasshopper Dragonfly plug-in (Mackey, et al., 2017). The UWG is a tool developed by Massachusetts Institute of Technology to analyse lo-cal effects generated by urban
geom-etries on urban comfort and energy consumption. This tool simulates the atmosphere/built environment and is capable of assessing the urban heat island effect and modifying a file of generic meteorological data (here called “rural”) to create a file of “ur-ban” meteorological data. Its task is to transform meteorological data usually obtained from exurban stations (e.g., airports) into meteorological data ad-hering more to the morphological and material characteristics and use of the city. The data is processed using a va-riety of parameters, for example, ma-terial properties (solid, roofs, walls), the urban form, the generation of anthropogenic heat (in the street and within buildings), and the presence of green areas. The UWG is not lim-ited to calculating traditional factors like the sky view factor or the vertical ratio of the urban canyon; it expands
01 | Esempio di generazione del tessuto urbano e sua variazione
Example of generation of the urban fabric and its variation
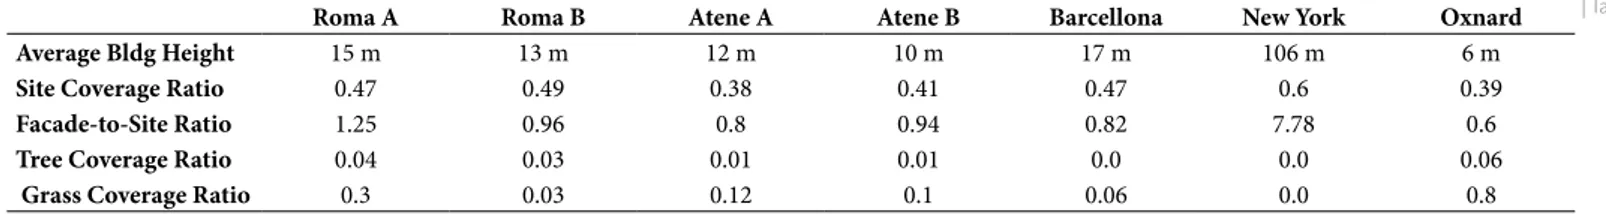
rapporti fra l’edificato e il territorio. In particolare tiene conto di
tre dati: rapporto di copertura (site coverage), rapporto di
faccia-ta (façade-to-site) e altezza media degli edifici (average building
height). I parametri utilizzati, e riportati nella Tabella 1,
descri-vono i tessuti urbani omogenei attraverso indici di densità delle
superfici nelle dimensioni verticale ed orizzontale, adattandosi
“rapidamente” ai differenti tessuti urbani (Fig. 2).
L’edificato è caratterizzato dal punto di vista energetico
consi-derando (rispetto alla tipologia e all’età della costruzione), il
rapporto di superficie vetrata, l’albedo delle pareti orizzontali e
verticali e, infine, la presenza di un tetto giardino. Inoltre, UWG
caratterizza la città in base alla presenza di verde urbano
(oriz-zontale e verticale), alla quantità di superficie non permeabile e
al traffico viario presente nell’area di studio.
Mettendo in relazione tutte queste informazioni il modello
tra-sforma il dato meteorologico dell’area “rurale” in un dato
clima-tico “urbano” che meglio aderisce al microclima della città.
3) La terza fase si avvale dello strumento che gestisce gli aspetti
energetico-ambientali attraverso il plug in di Grasshopper
Lady-bug (Sadeghipour Roudsari & Pak, Aug 25-28 2013) per il
cal-colo dell’indice Universal Thermal Climate Index (UTCI)
rap-presentativo del comfort outdoor percepito restituendo valori
in gradi centigradi delle temperature percepite dal soggetto che
fruisce l’area studio. I valori di comfort ambientale sono
indivi-duati all’interno della fascia 19°C e 26 °C, mentre valori
compre-si tra i 26°C e 28° C è definita zona di comfort per brevi periodi.
Tale processo permette di comprendere come gli aspetti
geome-trici e materici influiscono sul microclima e, di conseguenza, sul
comfort ambientale e sulla percezione empatica del luogo
defi-nibile come empatia architettonica (Wölfflin, 2010, Mario
Cuci-nella Architects, 2016).
I dati necessari per tale analisi sono:
– temperatura a bulbo secco;
– velocità del vento a 10 metri d’altezza dal suolo;
– umidità relativa;
– temperatura media radiante;
– dati relativi all’utente (età, genere, altezza, massa,
metaboli-smo, vestiario).
Le prime tre voci sono fornite dai valori del profilo
meteorologi-co modificato nella frase precedente da UWG, mentre la
tempe-ratura media radiante viene calcolata numericamente (secondo
la norma UNI-EN 27726) e rappresenta la temperatura di un
ambiente fittizio termicamente uniforme che scambierebbe con
il corpo umano la stessa potenza termica radiante scambiata
nell’ambiente reale.
Ottenuti i valori dell’indice UTCI nei vari punti della mappa e
visualizzati come gradiente colorimetro sulla mappa urbana, si
possono individuare gli effetti dell’isola di calore urbano
presen-te nelle nostre città e ipotizzapresen-te strapresen-tegie progettuali presen-tese alla
mi-tigazione climatica (Fig. 3).
the analysis, calculating various rela-tionships between the built environ-ment and the territory. In particular, it considers three factors: site coverage ratio, façade-to-site ratio, and aver-age building height. The parameters used, which are reported in Table 1, describe homogeneous urban fabrics using indices of the surface density in the vertical and horizontal directions, “rapidly” adapting to different urban fabrics (Fig. 2).
The built environment is characterized from the energy point of view, con-sidering (with respect to the type and age of buildings) the relationship of glass surfaces, the albedo of horizontal and vertical surfaces, and, finally, the presence of a garden roof. In addition, the UWG characterizes the city based on the presence of urban greenery (horizontal or vertical), the amount of impermeable surface area, and road
traffic present in the area of study. By interrelating all this information, the model transforms the “rural” mete-orological data into “urban” climate data that better agrees with the micro-climate of the city. 3) The third phase is to manage energy/environmental aspects via the Ladybug plug-in for Grasshopper (Sadeghipour Roudsari & Pak, 2013) in order to calculate the universal thermal climate index (UTCI), a quantity representing per-ceived outdoor comfort. Values of the temperature perceived by the subject using the study area are returned in de-grees Celsius. Environmental comfort is defined within the band from 19°C to 26 °C, while values between 26°C and 28°C define the comfort zone for brief periods. This process allows for an understanding of how geometric and material aspects affect the mi-croclimate and, as a consequence, the
environmental comfort and empathic perception of the place, i.e., “architec-tural empathy” (Wölfflin, 2010, Mario Cucinella Architects, 2016).
The data necessary for this analysis are: - dry bulb temperature;
- wind speed 10 m above the ground; - relative humidity;
- average radiant temperature; - user-related data (age, gender,
height, weight, metabolism, cloth-ing).
The first three are provided by values of the meteorological profile modified by the
UWG in the preceding phase. The av-erage radiant temperature is calculated numerically (according to UNI-EN 27726 standards) and represents the temperature of an artificial, thermally uniform environment that would ex-change the same thermal radiant ther-mal energy with the human body as
is exchanged in the real environment. Once the values of the UTCI are ob-tained at various points and visualized as a colour gradient on the urban map, one can identify the effects of the ur-ban heat island present the city and de-sign strategies for climate mitigation.
Application of the methodology and analysis of case studies
The methodology developed was ap-plied to the case studies, which were chosen based on their geometric and environmental characteristics. In par-ticular, urban fabrics were sampled per-taining to cities with a Mediterranean climate (Csa in the Köppen climate classification: Rome, Athens, Barcelona, Oxnard) (Peel, 2007) and a humid sub-tropical climate (Cfa classification: New York). The cities in the first group have a primarily horizontal development, while New York is obviously the
sym-Tab. 01 | Indici di densità delle superfici nella dimensione verticale ed orizzontale valutati per
città differenti con diverse tipologie urbane (Roma A e B, Atene A e B) Density indices of surfaces in the vertical and horizontal directions, evaluated for different types of urban cities (Rome A and B, Athens A and B, Barcelona, New York, Oxnard)
Roma A Roma B Atene A Atene B Barcellona New York Oxnard
Average Bldg Height 15 m 13 m 12 m 10 m 17 m 106 m 6 m
Site Coverage Ratio 0.47 0.49 0.38 0.41 0.47 0.6 0.39
Facade-to-Site Ratio 1.25 0.96 0.8 0.94 0.82 7.78 0.6
Tree Coverage Ratio 0.04 0.03 0.01 0.01 0.0 0.0 0.06
Grass Coverage Ratio 0.3 0.03 0.12 0.1 0.06 0.0 0.8
La metodologia sviluppata è
stata applicata ai casi studio
scelti in base alle caratteristiche
geometriche e ambientali. In
particolare sono stati campionati tessuti appartenenti a città
del-la fascia climatica Csa secondo del-la cdel-lassificazione di Köppen
(Peel, 2007) (Roma, Atene, Barcellona, Oxnard) e Cfa (New
York). Le prime sono città tendenzialmente a sviluppo
orizzon-tali, mentre New York è ovviamente il simbolo di un tessuto
ur-bano tipicamente verticale. La città caratterizzata da una
mag-giore presenza di verde (e quindi magmag-giore permeabilità del
suo-lo) è Oxnard, mentre New York può essere considerata la più
“impermeabile”.
Ricostruiti tutti i tessuti urbani, questi sono stati caratterizzati
dal punto di vista materico e hanno prodotto diversi file
clima-tici utilizzati nella fase successiva per la valutzione del comfort
outdoor (mediante la determinazione dell’UTCI). Ogni
campio-ne copre una superficie di circa 500 m2. Ogni città è stata
valuta-ta nella propria settimana più calda (scenario Hot Week) definivaluta-ta
a partire dal file climatico (Fig. 3).
Per ogni campione è stato valutato l’UTCI a partire dal file
cli-matico originale (Weather data 1) per poi confrontarlo con i
va-lori restituiti con il file climatico “urbano” modificato da UWG
(Weather data 2) ed, infine, con un’ennesima modifica del file
climatico in cui è riportato una condizione paradossale nella
quale la città, pur mantenendo le stesse caratteristiche formali
e rapporti geometrici, presenta la condizione Paradosso grazie
all’utilizzo di materiali con un albedo pari a 1(massima
riflet-tanza dei materiali considerati) e totale copertura un green-roof
(Weather data 3).
L’analisi effettuata mostra che la
metodologia presentata
per-mette una valutazione rapida e speditiva delle caratteristiche
cli-matiche a scala locale. Sono stati rilevati differenti effetti
dell’iso-la di calore urbana dipendenti daldell’iso-la stagionalità
(Inverno/Esta-te). Gli effetti sono rappresentati dall’indice UTCI che consente
di valutare la percezione del comfort da parte degli utenti e
quin-di il benessere percepito nel luogo. Quest’ultimo rappresenta
an-che un elemento concorrente nella definizione della cosiddetta
“empatia architettonica” (Wölfflin, 2010, Mario Cucinella
Archi-Applicazione della
metodologia e analisi dei
casi studio
Risultati
bol of a typically vertical urban fabric. The city with the highest presence of green areas (and therefore greater per-meability) is Oxnard, while New York is the most impermeable. Once all the urban fabrics were reconstructed, they were characterized from the material point of view and various climate files were produced and used in subsequent phases to assess outdoor comfort (by determining the UTCI). Each sample covers a surface area of about 500 m2,
and each city was evaluated for its own hottest week (hot week scenario), de-fined based on the climate file (Fig. 3). For each sample, the UTCI was evalu-ated starting from the original climate file (weather data 1) and then com-pared with values obtained with the “urban” climate file modified using the UWG (weather data 2). The climate file was then modified further to create a paradoxical condition in which the
city, while maintaining the same for-mal characteristics and geometric ra-tios, presents a paradoxical condition wherein all materials have an albedo equal to 1 (maximum reflectance) and there is total green- roof coverage (weather data 3).
Results
The analysis shows that this methodol-ogy allows the local climate character-istics to be assessed quickly and expe-ditiously. Different effects of the urban heat island were revealed depending on the season (winter/summer). These effects are represented by the UTCI, which allows users’ perception of com-fort, i.e., the perceived well-being of the place, to be evaluated. This also repre-sents a competing element in defining the architectural empathy. In winter, the urban heat island is effective in fabrics with greater vertical density, such as
New York (Fig. 4), which has a façade-to-site ratio (Tab. 1) that is much higher than the other portions of city consid-ered. In summer, however, a higher horizontal density exacerbates the in-tensity of the urban heat island effect and, as a consequence, also the negative effects tied to urban overheating. In Europe, it is clear how, for this type of simulation, it is now impossible to over-look the use of the climate file without the necessary proper characterization. The increases, even if a little less than 1°C, are, however, important (Fig. 5). The American cities should be consid-ered limiting cases: Oxnard, with its moderate horizontal density (low, sparse buildings), does not show ap-preciable variations in perceived ur-ban comfort between the urur-ban and peri-urban areas throughout the year, nor are there evident improvements in the paradoxical case (Fig. 3). In
New York, on the other hand, the ur-ban heat island effect creates a slight increase in summer temperatures, but seems to draw greater benefit in the winter when the urban temperature increases punctually, creating a ther-mal gradient of 6–7°C (Fig. 4). The an-nual value is about 1°C.
Conclusion
This research proposes an in-depth, quick method of analysis, a workflow, to delineate an urban design that is sustainable and controlled energeti-cally because it is capable of simulating the effect of design proposals on the urban heat island. The method pro-posed aims to decode the highly com-plex city system, considering meteoro-logical data, technometeoro-logical aspects, and architectural empathy. The resulting isopleths and graphs are meant to act as support for design, providing a
pre-02 | Indici di densità utilizzati da UWG
03 | Risultati delle mappe di comfort ottenuti nei casi studio
Results of the comfort maps obtained in the case studies
tects, 2016). In inverno l’isola di calore è efficace nei tessuti con
maggiore “densità verticale”, come ad esempio il caso studio di
New York (Fig. 4) che presenta un parametro di Facade-to-Site
Ratio (Tab. 1) molto maggiore rispetto alle altre porzioni di città
considerate. In estate, invece, la “densità orizzontale” esaspera
maggiormente l’intensità dell’isola di calore urbana e di
conse-guenza i suoi effetti negativi legati al surriscaldamento urbano.
In Europa è evidente come, per questo tipo di simulazione, sia
ormai impossibile prescindere dall’utilizzare il file climatico
sen-za la necessaria caratterizsen-zazione. Gli innalsen-zamenti anche se di
poco inferiori a 1°C, ma comunque sempre significativi (Fig. 5).
Le città americane sono da considerarsi casi limite: la città
Oxnard, con caratteristiche riconducibili ad una moderata
“den-sità orizzontale” (edificato basso e rado), non presenta
apprezza-bili variazioni del comfort urbano percepito tra la l’area urbana
e periurbana in entrambe la stagioni, nè sono evidenti i
miglio-ramenti nel caso “paradosso” considerando materiali ad albedo
pari a 1 e tetti verdi (Fig. 3).
A New York, di contro, l’effetto isola di calore urbana ha un
leg-gero innalzamento puntuale delle temperature estive, ma sembra
trarre maggiore beneficio in inverno dove la temperatura urbana
aumenta puntualmente individuando un gradiente termico di
6-7 °C (Fig. 4), mentre annualmente si ha un valore di circa 1°C.
La ricerca presentata
propo-ne un metodo di analisi, un
workflow, approfondito e veloce per delineare un progetto
urba-no sostenibile ed energeticamente controllato perché in grado di
effettuare simulazioni dell’incidenza delle proposte progettuali
sul fenomeno dell’isola di calore urbano.
Conclusioni
liminary detailed analysis and becom-ing a fundamental means to design climate and technological devices that can improve the urban context ana-lysed. Since this is an open, complex analysis capable of determining ad-ditional effective solutions and output that can be validated, this work rep-resents the first step in defining a tool that is even more effective in hypoth-esizing interventions that consider the parametric variables referring to the dynamics of urban transformations, such as economic and social factors. NOTES
1 An account of these changes can
be found in the numerous initiatives promoted by the Copenhagen City Administration and the report “Green Roofs Copenhagen” promoted by Co-penhagen Together. This report illus-trates the tendency for change in the
city, starting from the requirement for green roofs in most new local plans as of 2010 and including a list of differ-ent currdiffer-ent or completed intervdiffer-entions whose main theme is urban renewal on a human and sensory scale. Available at: http://en.klimatilpasning.dk/me-dia/704006/1017_sJ43Q6DDyY.pdf.
2 The programme supports the City’s
objective of reducing carbon emissions by 80% by 2050 (80 x 50), as indicat-ed in “One New York: The Plan for a Strong and Just City” by Mayor de Bla-sio. The initiative is a partnership be-tween the NYC Department of Small Business Services, the Mayor’s Office of Sustainability, the Mayor’s Office of Recovery and
Resiliency, and Sustainable South Bronx, a division of The HOPE Pro-gram. Available at: http://www.nyc. gov/html/onenyc/downloads/pdf/ publications/OneNYC.pdf
| 05
04 | Confronto fra i valori della temperatura nel weather data 1 e 2 nelle città di Oxnard e New York
La metodologia proposta cerca di decodificare il sistema città
al-tamente complesso considerando i dati meteorologici, gli aspetti
tecnologici e “l’empatia architettonica”.
Le isoplete e i grafici che ne derivano vogliono essere di supporto alla
progettazione, fornendo un’analisi preliminare dettagliata e
divenen-do mezzo fondamentale per poter progettare dispositivi climatici e
tecnologici, capaci di migliorare il contesto urbano analizzato.
Trattandosi di una metodologia aperta e complessa, in grado
dunque di determinare soluzioni più efficaci e output validabili,
il lavoro presentato rappresenta il primo step per la definizione
in futuro di uno strumento ancora più efficace nelle ipotesi di
in-tervento che tengano conto di variabili parametriche riferite alle
dinamiche di trasformazione urbana, quali ad esempio i fattori
economici e sociali.
NOTE
1 Un resoconto di questi cambiamenti si ritrova in innumerevoli
iniziati-ve promosse dall’amministrazione della città di Copenaghen riscontrabili anche nel report “GREEN ROOF COPENAGHEN” promosso da Copena-ghen Together dove viene illustrata la propensione di cambiamento della città, partendo dall l’imposizione di tetti verdi nella maggior parte dei nuovi piani locali dal 2010 fino ad arrivare ad un elenco dei diversi interventi in atto o già realizzati avente come tema principale la riqualificazione urbana a scala umana e sensoriale. Available at: http://en.klimatilpasning.dk/me-dia/704006/1017_sJ43Q6DDyY.pdf.
2 Il programma supporta l’obiettivo del Comune di ridurre le emissioni
di carbonio dell’80% entro il 2050 (80 x 50), come indicato nel One New York: The Plan for a Strong and Just City dal Sindaco de Blasio. l’iniziativa è una partnership tra NYC Department of Small Business Services, the Mayor’s Office of Sustainability, the Mayor’s Office of Recovery and Re-siliency, and Sustainable South Bronx, a division of The HOPE Program. Available at: http://www.nyc.gov/html/onenyc/downloads/pdf/publica-tions/OneNYC.pdf.
REFERENCES
Balbo, M. (2005), L’intreccio urbano. La gestione della città nei paesi in via di
sviluppo, Franco Angeli, Milano.
Behringer, W. (2016), Storia culturale del clima. Dall’era glaciale al
riscalda-mento globale, Bollati Boringhieri, Torino.
De Carlo, G. (1973), L’architettura della partecipazione, Saggiatore, Milano. De Certeau, M. (2011), The practice of everyday life, University of California Press, Paris.
De Pascali, P. (2008), Città ed energia: la valenza energetica
dell’organizzazio-ne insediativa, Franco Angeli, Milano.
Garramone, V. (2013), Studio dell’empatia in Architettura. Analisi Metodi ed
Esperimenti, Dissertazione Finale per il conseguimento del titolo di Dottore
di ricerca in Architettura degli Interni, Facoltà di Architettura, Università la Sapienza di Roma.
Gehl, J. (2017), Città per le persone, Maggioli Editore, Rimini.
05 | Confronto fra i valori della temperatura nel weather data 1 e 2 su base mensile
Comparison of temperature values in weather data 1 and 2 on a monthly basis
Givoni, B. (1998), Climate Considerations in Building and Urban Design, Van Nostrand Reinhold.
Koolhaas, R. (2006), Delirious New York. Un manifesto retroattivo per
Man-hattan, Electa Mondadori, Milano.
Landry, C.B.F. (1995), The creative city, Demos, London.
Barucco, M.D.T. (2007), Architettura, energia. Un’indagine sul complesso
rapporto tra la professione dell’architetto e la questione energetica,
EdicomE-dizioni.
Mackey, C., Galanos, T., Norford, L. and Sadeghipour Roudsari, M. (2017),
Wind, Sun, Surface Temperature, and Heat Island: The Critical Variables for High‐Resolution Outdoor Thermal Comfort, San Francisco, USA.
Mario Cucinella Architects (2016), Creative emphathy, Skira Editore, Milano. Olgyay, V. (1963), Design with Climate: Bioclimatic Approach to
Architectu-ral Regionalism, Princeton University Press Rogora.
Ottone, M.F. (2016), “Mountain Settlements: Energy Efficiency and Tourist Needs”, in Sargolini, M. (a cura di), Mountain landscapes. A decision support
system for the accessibility, List, Trento – Barcellona.
Peel, M.C.F.B.L.M.T.A. (2007), “Updated world map of the Köppen-Geiger climate classification”, Hydrol. Earth Syst. Sci., Vol. 11, pp. 1633-1644.
Ratti, C. (2017), City of Tomorrow, Einaudi editore, Torino.
Rogora, A. (2012), Progettazione bioclimatica per l’architettura
Mediterra-nea, Wolters Kluwer Italia.
Rossi, A. (1966), L’Architettura della città, Marsilio.
Sadeghipour Roudsari, M. and Pak, M. (2013), Ladybug: a Parametric
Envi-ronmental Plugin for Grasshopper to Help Designers Create an Environmen-tally-Conscious Design, Chambery, France.
Scuderi, M. (2014), Philippe Rahm architectes. Atmosfere costruite, Postme-dia Books, Milano.
Secchi, B.V.P. (2009), Antwerp - Territory of a New Modernity, Sun Publi-shers.
Sitte, C. (1981), L’arte di costruire le città: l’urbanistica secondo i suoi
fonda-menti artistici, Jaca Book.
Venturi, R.S.B.D.I.S. (1977), Learning from Las Vegas, Cambridge. Vergara, A.d.l.R.J.L. (2004), Territorios inteligentes: nuevos horizontes del
ur-banismo, Fundation Metropoli, Madrid.
Waldheim, C. (2006), The Landscape Urbanism Reader, Princeton Archi-tectural Press.