DigitCult | Scientific Journal on Digital Cultures
Published 28 December 2017
Correspondence should be addressed to Alessandra Ferrighi, Università Iuav di Venezia, S. Polo 2468, Venice, Italy. Email: [email protected]
DigitCult, Scientific Journal on Digital Cultures is an academic journal of international scope, peer-reviewed and open access, aiming to value international research and to present current debate on digital culture, technological innovation and social change. ISSN: 2531-5994. URL: http://www.digitcult.it
Copyright rests with the authors. This work is released under a Creative Commons Attribution (IT) Licence, version 3.0. For details please see http://creativecommons.org/ licenses/by/3.0/it/
The Venetian Ghetto.
Semantic Modelling for an Integrated Analysis
Abstract
In the digital era, historians are embracing information technology as a research tool. New technologies offer investigation and interpretation, synthesis and communication tools that are more effective than the more traditional study methods, as they guarantee a multidisciplinary approach and analyses integration. Among the available technologies the best suited for the study or urban phenomena are databases (DB), the Geographic Information System (GIS), the Building Information Modelling (BIM) and the multimedia tools (Video, APP) for the dissemination of results.
The case study described here concerns the analysis of part of Venice that changed its appearance from 1516 onwards, with the creation of the Jewish Ghetto. This was an event that would have repercussions throughout Europe, changing the course of history. Our research confirms that the exclusive use of one of the systems mentioned above (DB, GIS, BIM) makes it possible to manage the complexity of the subject matter only partially. Consequently, it became necessary to analyse the possible interactions between such tools, so as to create a link between an alphanumeric DB and a geographical DB. The use of only GIS and BIM that provide for a 4D time management of objects turned out to be able to manage information and geometry in an effective and scalable way, providing a starting point for the mapping in depth of the historical analysis. Software products for digital modelling have changed in nature over time, going from simple viewing tools to simulation tools. The reconstruction of the time phases of the three Ghettos (Nuovo, Vecchio, and Nuovissimo) and their visualisation through digital narratives of the history of that specific area of the city, for instance through videos, is making it possible for an increasing number of scholars and the general public to access the results of the study.
Alessandra Ferrighi
Università Iuav di Venezia S. Polo 2468, Venice, Italy
Paolo Borin
Università Iuav di Venezia S. Polo 2468, Venice, Italy
1. Introduction
March 29th 2016 was the five-hundredth anniversary of the establishment of the Jewish Ghetto in Venice. An exhibition, ‘Venice, the Jews and Europe 1516-2016’ was inaugurated at the Ducal Palace on June 19th, one of the events organised by the Jewish Community and the Municipality of Venice (Calabi 2016b). Our research into the history of the Ghetto’s transformations took its cue from this anniversary and the necessity of providing digital material for that exhibition.
Professor Donatella Calabi, the curator and originator of the event, has already fully embraced for some time the idea that the deployment of new technologies can help us to better understand a number of phenomena connected with the history of the city and its architecture. In recent years each of her research projects has been supported by a team of young researchers who have explored alongside her these new languages for communication and dissemination.
The urban history of the Jewish Ghetto covers the vicissitudes of that part of the city of Venice from its inauguration, brought about by a Senate decree issued on Marc 29th 1516, through to its closure, or rather opening, formally sanctioned by the Municipal decree of July 7th 1797, but effectively executed on July 10th, with great festivities in the Campo di Ghetto Nuovo.
With a view to making available an outline of the state of the Ghetto in 1797, with its physical actuality of buildings, public and private spaces, through 3D modelling, it was necessary to interrogate the whole of the nineteenth century, going backwards in time. The nineteenth century constitutes for students of the city a span with a plentiful production of maps and a sizeable number of building proposals. It was possible to trace transformations over time almost without interruption up to 1808, the year of a Napoleonic census mapping, the nearest it was possible to get to the opening of the Ghetto1.
Within the team a group of researchers dedicated themselves to the recovery of the nineteenth century development phases, applying a methodology that was in some respects innovative, in that it employed new IT tools2, and in others tried and tested, having been already used for the Visualizing Venice project (http://www.visualizingvenice.org/visu/)3.
2. Project Aims and Hypotheses
The aim of the Ghetto research project was to create content for the multimedia installations designed to connect and complement the artworks and documentation in the ‘Venice, the Jews and Europe’ exhibition. Among these multimedia installations, some were concerned with the nineteenth century section ‘Napoleon, the opening of the gates and assimilation’ and these included a video we prepared entitled ‘After the Ghetto’.
Our research hypotheses required our arriving at this content through a study of the nineteenth century aimed at establishing the layout of the Ghetto in 1797, before its opening, as we have mentioned, in order to understand how its troubled history played out after the destruction of the gates and to what extent today’s Ghetto no longer corresponds to that of the past due to the profound transformations over the course of the nineteenth century.
During the preliminary investigative phase, on the current state of archival research, we confirmed what we had expected: that the fragmentary resources concerning urban history before the fall of the Republic could only supply information on particular units rather than the whole. At least as far as the reconstitution through 2D and 3D modelling of the physical appearance of the quarter between 1516 and 1797 was concerned, it was difficult to arrive at a convincingly coherent visualisation, not having a complete information chain at our disposal.
1 The Venetian land surveys here referred are respectively the “Mappa della Regia città di Venezia”, known as the Napoleonic Survey, from 1808-1811, and the “Mappa del Comune censuario suddiviso in sestieri”, known as the Austrian Survey, from 1838-1842; the third is the 1867 census map from 1867, known as the Austro-Italian Survey, which continued to be modified up until 1913.
2 The research team, in addition to the authors of this paper, is composed of students and researchers from the Dipartimento ICEA of Padova University, co-ordinated by Prof. Andrea Giordano. Particular thanks are due to Arbor Paja, for his degree thesis entitled “Il passaggio di informazioni per l’interpretazione e l’analisi urbana e architettonica. Rilievo e modellazione del Ghetto Nuovo di Venezia.” (supervisors Prof. Andrea Giordano & Alessandra Ferrighi).
3. Visualizing the Ghetto
Our research methodology envisaged the use of a number of mutually integrated technologies. Among these, in workflow order, we can itemize: the assembling of sources and their organisation in a database; the mapping of the transformations on the basis of contemporary cartography; the three-dimensional reconstruction of structures in an urban and architectural sense; the production of video clips. The final storytelling made use of the data derived from all the technologies listed above, constituting a narrative giving due weight both to the sources themselves and to the content extracted from them, expressed in simple language.
3.1 Sources and HGIS (2D data): Exploring Change over Time and Space
The selection and analysis of textual and iconographic sources, the synthesizing of the results and the critical reconstruction of events are the daily work of the historian. Our plan was to back up traditional methods with the use of new technologies to organize and interrelate data extracted from the sources by continuing to experiment with the method developed in the above-mentioned Visualizing Venice project.
Alongside secondary sources4, primary sources were also identified and either digitally acquired directly from the archives or created with photographic exercises conducted ad hoc. These were then implemented on the online VISU system5 and matched up with the geographical target object to which they refer, having edited that object in the temporal sense to coincide with the source. Using this process, the two data banks, the alphanumeric and the geographic, were populated, so as to arrive at a capability of exporting data in vector format from the geographic database, representing the principal historic phases of the ‘layers’ selected as necessary for the 3D modelling.
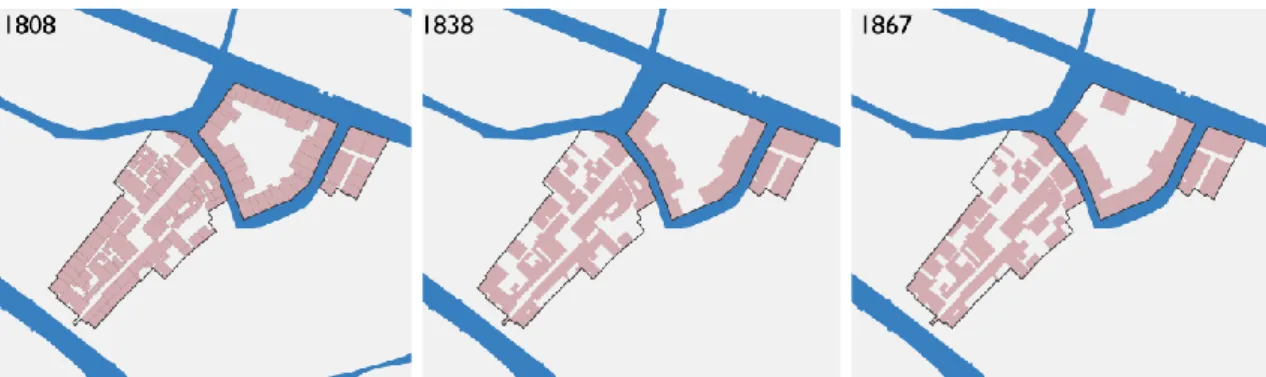
In our case three land registry maps (see note 1) were georeferenced, and after tracing the perimeter of the Ghetto, the phases belonging to each map were edited. Stating from the present situation, obtained from the municipality technical maps, we worked backwards in time, using ArcMap6, to redraw the residential blocks and pedestrian walkways, assigning to each unit its temporal transformation data. We thus obtained all the information necessary to proceed to three-dimensional urban scale modelling (see Figure 1)7.
Figure 1. Recovery of the transformations over the three principal nineteenth century phases from the
georeferencing and editing of the three land surveys.
4 These included the more important modern publications dealing with the Venetian Ghetto, such as: Calabi, Donatella, Camerino, Ugo, and Concina, Ennio. La città degli ebrei. Il ghetto di Venezia: architettura e urbanistica. Venice: Marsilio, 1996; Calabi, Donatella. “Gli Ebrei e la città.” In Storia di Venezia: dalle origini alla caduta della Serenissima, vol. 7. Rome: Istituto della Enciclopedia Italiana, 1997, 273-300; Calabi, Donatella. “Gli ebrei veneziani dopo l’apertura delle porte del ghetto: le dinamiche insediative”. In Le metamorfosi di Venezia. Da capitale di stato a città del mondo. Florence: Olschki, 2001, 147-171; Calabi, Donatella. Venezia e il Ghetto. Cinquecento anni del “recinto degli ebrei”, Torino: Bollati Boringheri, 2016.
5 See Ferrighi 2016a.
6 ArcMap forms part of Esri’s ArcGis suite (http://www.esri.com/). 7 See Ferrighi 2016b.
3.2 CAD versus BIM: Integrating GIS and BIM for Knowledge Production
The methodology presented here envisages a separation of the workflow between a category of information of an urban nature processed through the GIS platform and another of architectural information through BIM. Both systems in fact allow the linking of geometric elements, specifically semantically defined, with numerical and textual information. The sets of data must then be capable of modifying their characteristics over a time scale.
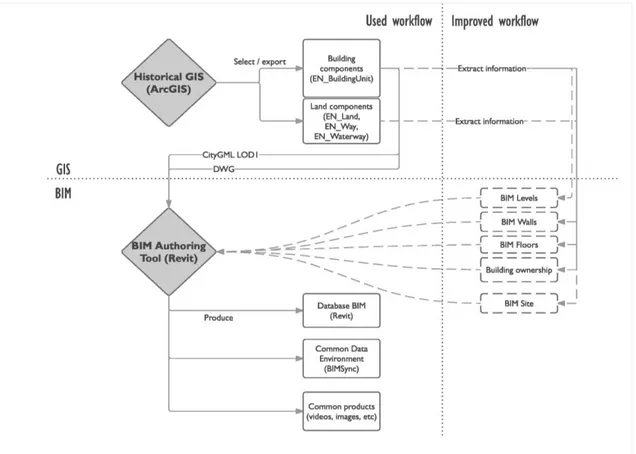
The principal systems which meet these criteria are GIS and BIM. Our research demonstrated however that the exclusive use of any one of the two systems allowed us to deal with the complexity cited earlier only in a partial manner. The range of knowledge produced by the research project was thus sometimes compromised by the employment of visualisation and simulation tool inadequate for its full description and narration. It was our aim to achieve maximum efficiency with each model (BIM-GIS) in the fields and functions for which it was created. International information codification standards for each system (CityGML, IFC) then permitted an exact interchange of information. The applied methodology can be broken down (see Figure 2) into the following phases:
Creation of a Historical GIS (HGIS) and reconstruction of the historical sequence of transformations (2,5D).
Manual creation of a BIM model for the urban context: the current architectural aspect was generated from a ground-plan obtained by the exporting of DWG files from the HGIS. The generation of a model of successive phases was achieved by the integration of ground-plans relating to each historical phase.
Production of specific BIM models for the conducting of in-depth thematic analyses. In this fashion the model can support further investigative scale changes, and can handle more efficiently transformations in an individual entity.
Updating BIM models in accordance with architectural surveys: this phase allows us not only to vary the dimensional parameters of ground-plans and elevations, but above all to insert particular architectural components (doors, windows, structural and construction details) which provide a knowledge base for assessing and confirming transformations.
Control of the models deployed with ad hoc tools for the quality control of building projects and processes, via reference to the international IFC standard.
Creation of visual displays (static images, video) working from the models.
Our limiting ourselves to only two models (HGIS e HBIM), able to handle the temporal processing of the items within them within appropriate parameters, facilitated an efficient and scalable management of geometries and information. It is important to stress how such a choice makes possible the use of the same, duly verified, digital model, as a support to the management and evaluation of the architectural product, integrating the model with an analysis of the deterioration of architectural and structural elements. It will be evident that this requires rigorously testing the interoperability of the two tools, so as to create a transmission link between two different graphic databases that can guarantee the consistency of information between the two systems.
Figure 2. The schema describes the workflow adopted and presents future developments.
3.3 Used Information Exchange and BIM Modelling Procedure
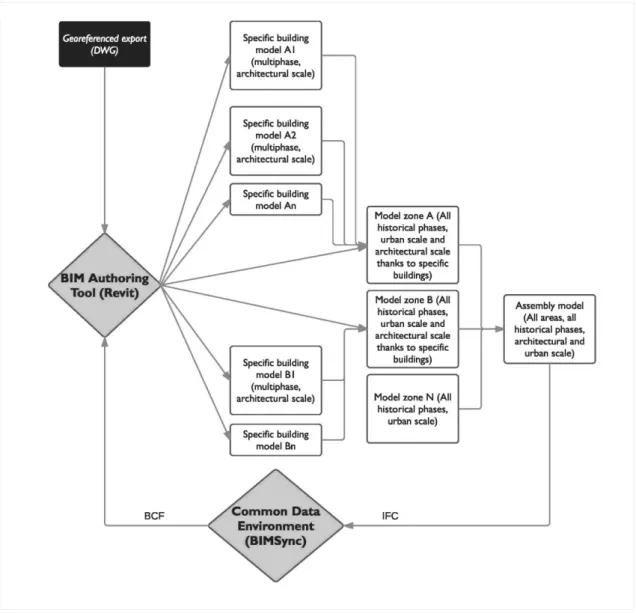
A study of the information base and the aims of the research project allowed us to define what information to transfer between the geographic and the architectural databases. In the absence of an overall architectural survey of the whole pertinent area, the starting data for modelling consisted in a description of the characteristics of the volumetric units in their present state, on the basis of the current municipal technical map. To digitally recompose the buildings relatively rapidly it was sufficient to transform the perimeters of the units into external projection lines for perimeter walls. The definitive parameter of the eave line of a unit then enabled us to specify an overall roof area for the physical model. Finally, examination of the structural intersection at the wall summit enabled us to use the already established perimeter as a limiting factor in generating the roof. It was then possible to apply the same information route to the study of public and private open spaces. That meant transforming the two-dimensional borders of such zones into the perimeters of the elements composing the paved areas of the BIM model, assigning a stratigraphic and altimetric value to each. This phase constituted the construction of our urban zone models (Zone model, Figure 3).
Figure 3. Model organisation and BIM workflow.
In order to arrive at a greater precision for the quantitative data, we produced a point cloud photogrammetric survey for only the canal-facing facades, passing on to the modelling of buildings of particular interest demanding in-depth study (Specific Building, Figure 3), working towards the assembly of a specific library of parametric objects. We should underline that a catalogue of objects has a specific role to play in the dating of buildings. It ought to always be possible to connect each element in the library with a historical phase in the area of investigation. The completion of this process then enabled the urban zone modelling of historical transformations, utilising the geometric data deriving from the land surveys processed in the GIS tool. The model thus created represents a possible collector of specific models of buildings whose changes over time seem to demand further investigation.
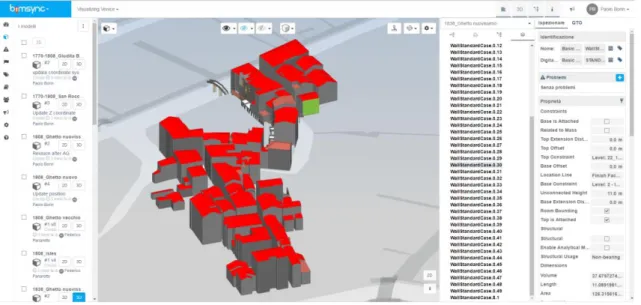
The process concludes with the export of all the phase models, in line with the international IFC standard, onto a collaborative project management platform (Bimsync, Figure 4). This tool enables interested researchers to access the project, not only with a view to flagging up inaccuracies, but also to allow them to link to the online database of documentation.
This therefore constitutes an important audit phase for the uploaded plans and information, with a view to improving the quality of the modelling and the consequent ultimate visualization (see Figure 5).
Figure 4. Use of BimSync (historical phase 1838) to coordinate the research team.
4. Conclusions
The application of tools and processes for the analysis of the history of a city and its buildings is a complex process due to its multidisciplinarity and the heterogeneity of the information8. This holds not only for the information deriving from historical research, such as textual and iconographic documents, but above all for the downstream analysis of the work carried out: images, video, enhanced reality applications, integrated with photorealistic visualisations and prototype models, etc. Often different representational scales must be harmonised, because linked to the type and aim of the original survey.
Consequently, a viable methodology had to aim at achieving the integration of the knowledge acquired and producing graphic results in support of the analyses performed. A final requirement was that the software be capable of transferring information via interoperable formats. Adherence to recognized international standards constitutes the sole guarantee of future access to the information and the analyses carried out, for eventual confirmation, extension and improvement of the research.
The study described above offered an opportunity to define and test a modelling process that may offer an example for research projects on the history of cities and their architecture. The pronounced heterogeneity of the initial material, and the absence of specific software, obliged us to deal with the management of evolving transformations by employing two different study approaches, one based on a GIS and the other on BIM. For this reason, it was essential to dedicate particular attention to studying interoperable data transfer formats (CityGML, IFC). Future developments will permit the deployment of a direct linking tool between the two models, so as to ensure a two-way reading of objects modelled in real time. Such a tool could alert the user to eventual incompatibilities that risk invalidating the generated multimedia content.
We should not fail to mention that, on the basis of the content elaborated, a multimedia display9, was created which was mounted at the commissioning exhibition and which can be consulted via a touch-screen monitor, offering the visitor the opportunity to interact with and learn about a number of selected themes through in-depth analytic journeys. An introductory sequence was devised featuring symbolic images of flames devouring the gates that had cut off the Jews from the other residents of the city and of the exultant dancing of the no longer segregated citizens; this was followed by the speech delivered by citizen Raffaele Vivante10 on the very same day as the Ghetto’s opening11. Following this part of the video, three programmes are shown illustrating the urban transformations undergone by the Ghetto in the nineteenth century, and two special features focusing on the demolitions and reconstructions involving respectively the Ghetto Nuovo and the Ghetto Vecchio.
* Sections 1, 2, 3, and 3.1 were written by Alessandra Ferrighi; Sections 3.2 and 3.3 by Paolo Borin; other sections were written jointly.
** This work has been supported in part by Croatian Science Foundation's funding of the project 9492 Dubrovnik: Civitas et Acta Consiliorum, Visualizing Development of Late Medieval Urban Fabric.
*** This work was presented at EAUH 2016 Conference in Helsinki.
8 The workflow analysis adopted up to now for the visualisation of historical transformations to the city and its buildings has revealed a number of critical issues: the main concerns have been connected with a loss of quality in the final analysis due to the use of systems that are heterogeneous and often insufficiently interoperable (GIS-CAD). Each passage in fact renders complex the monitoring of the accuracy of the visualisation with respect to the documents. The lack of intercommunication between the two has rendered equally laborious attempts at modification pursued by the team due to the mismatch.
9 The video was produced by Studio Azzurro, Milano (http://www.studioazzurro.com/) who worked on the overall multimedia and video production for the exhibition.
10 See Vivante, Raffaele. Discorso del cittadino Raffael Vivante tenuto a’ suoi connazionali il dì 22 Messidor Anno I della Libertà Italiana. Venice: Zatta, 1797.
11 See the catalogue section: Ferrighi, Alessandra. “Dopo il Ghetto”, in Venezia, gli Ebrei e l’Europa. 1516-2016. Venice: Marsilio, 1516-2016.
References
Berlo, Léon van, and Ruben de Laat. “Integration of BIM and GIS: The Development of the CityGML GeoBIM Extension.” In Advances in 3D Geo-Information Sciences, 211–25. Berlin:
Springer, 2011. doi:10.1007/978-3-642-12670-3_13.
Bittner, Thomas, Maureen Donnelly, and Stephan Winter. “Ontology and Semantic Interoperability.” In Large-Scale 3D Data Integration, 2005, 139–60.
Boyes, Gareth, Charles Thomson, and Claire Ellul. “Integrating BIM and GIS : Exploring the Use of IFC Space Objects and Boundaries.” In GISRUK 2015, 9, 2015.
Brusaporci, Stefano. Handbook of Research on Emerging Digital Tools for Architectural
Surveying, Modeling, and Representation. Hershey, PA: IGI Global, 2015.
Calabi, Donatella, Camerino, Ugo, and Concina, Ennio. La città degli ebrei. Il ghetto di Venezia:
architettura e urbanistica. Venice: Marsilio, 1996.
Calabi, Donatella. “Gli Ebrei e la città.” In Storia di Venezia: dalle origini alla caduta della
Serenissima, vol. 7. Rome: Istituto della Enciclopedia Italiana, 1997, 273-300.
Calabi, Donatella. “Gli ebrei veneziani dopo l’apertura delle porte del ghetto: le dinamiche insediative”. In Le metamorfosi di Venezia. Da capitale di stato a città del mondo. Florence: Olschki, 2001, 147-171.
Calabi, Donatella. Venezia e il Ghetto. Cinquecento anni del “recinto degli ebrei”. Torino: Bollati Boringheri, 2016.
Calabi, Donatella. Venezia, gli Ebrei e l’Europa. 1516-2016. Venice: Marsilio, 2016.
Costamagna, Erik, and Antonia Spanò. “Integrazione Di Database Spaziali Multiscala in Ambito Urbano.” In Conferenza Nazionale ASITA, 483–490. Vicenza, 2012.
Cowen, David J. “GIS versus CAD versus DBMS : What Are the Differences ?” Engineering
54.11 (1988): 1551–1555.
Dore, Conor, and Maurice Murphy. “Integration of Historic Building Information Modeling (HBIM) and 3D GIS for Recording and Managing Cultural Heritage Sites.” In 18th International Conference on Virtual Systems and Multimedia, VSMM 2012: Virtual Systems in the
Information Society, 369–76, 2012. doi:10.1109/VSMM.2012.6365947.
El-Mekawy, Mohamed, and Anders Östman. “Semantic Mapping: An Ontology Engineering Method for Integrating Building Models in IFC and CityGML.” In 3rd ISDE DIGITAL EARTH
SUMMIT, 11, 2010.
El-Mekawy, Mohamed, Anders Östman, and Ihab Hijazi. “An Evaluation of Ifc-Citygml Unidirectional Conversion.” International Journal of Advanced Computer Science and
Applications 3.5 (2012): 159–171. doi:10.14569/IJACSA.2012.030525.
Ferrighi, Alessandra. “Cities over Space and Time. Historical GIS for Urban History”. In
Emerging Digital Tools for Architectural Surveying, Modeling, and Representation, edited by
Stefano Brusaporci, 425-445. Hershey, PA: IGI Global, 2015.
Ferrighi, Alessandra. “Dopo il Ghetto”. In Venezia, gli Ebrei e l’Europa. 1516-2016, edited by Donatella Calabi, 401. Venice: Marsilio, 2016.
Ferrighi, Alessandra. “The History of Cities and HGIS”. In Visualizing Venice: Mapping and
Modeling Time and Change in a City, edited by Kristin L. Huffman, Andrea Giordano, and
Caroline Bruzelius. London: Roudlege Press, 2017.
Ferrighi, Alessandra. “Urban History though New Technologies. Visualizing Venice, a Pilot Project.” In Digital Urban History. Telling the History of the City in the Age of the ICT
Revolution, edited by Rosa Tamborrino, pp. 59-66. Rome, IT: CROMA, Roma Tre, 2014.
Ferrighi, Alessandra. “VISU. Il sistema informativo integrato sulle trasformazioni urbane di Venezia”. GEOmedia 3 (2016): 44-49.
Ferrighi, Alessandra. “Visualizing Venice: A Series of Case Studies and a Museum on the Arsenale’s virtual history”. In Built City, designed City, Virtual City. The Museum of the City
edited by Donatella Calabi, 137-151. Rome, IT: CROMA, Roma Tre, 2013.
Ferrighi, Alessandra. “Visualizing Venice. New technologies for urban history”. Giornale Iuav
123 (2012).
Irizarry, Javier, Ebrahim P. Karan, and Farzad Jalaei. “Integrating BIM and GIS to Improve the Visual Monitoring of Construction Supply Chain Management.” Automation in Construction
31 (2013): 241–54. doi:10.1016/j.autcon.2012.12.005.
Isikdag, Umit, and Sisi Zlatanova. “Towards Defining a Framework for Automatic Generation of Buildings in CityGML Using Building Information Models.” In 3D Geo-Information Sciences, 79–96. Berlin: Springer, 2009. doi:10.1007/978-3-540-87395-2_6.
Meouche, Rani El, Mehdi Rezoug, and Ihab Hijazi. “Integrating and Managing BIM in Gis, Software Review.” International Archives of the Photogrammetry, Remote Sensing and
Spatial Information Sciences - ISPRS Archives XL-2/W2 (November 2013): 31–34.
Mignard, Clement, and Christophe Nicolle. “Merging BIM and GIS Using Ontologies Application to Urban Facility Management in ACTIVe3D.” Computers in Industry 65.9 (2014): 1276–
1290. doi:10.1016/j.compind.2014.07.008.
Shen, Weiming, Qi Hao, Helium Mak, Joseph Neelamkavil, Helen Xie, John Dickinson, Russ Thomas, Ajit Pardasani, and Henry Xue. “Systems Integration and Collaboration in Architecture, Engineering, Construction, and Facilities Management: A Review.” Advanced
Engineering Informatics 24.2 (2010): 196–207. doi:10.1016/j.aei.2009.09.001.
Zhang, X., Y. Arayici, S. Wu, C. Abbott, and G. Aouad. “Integrating BIM and GIS for Large Scale (Building) Asset Management: A Critical Review.” In The Twelfth International Conference
on Civil, Structural and Environmental Engineering Computing, 1–15, 2009.