Proceedings of the CIB W78-W102 2011: International Conference –Sophia Antipolis, France, 26-28 October
CHALLENGES AND BENEFITS OF D
4AR – 4 DIMENSIONAL
AUGMENTED REALITY - MODELING ON THE MILANO
BICOCCA HOUSING PROJECT
Mani Golparvar-Fard, PhD/ Assistant Professor,
[email protected]
Virginia Tech, Via Dept. of Civil & Env. Eng. and Myers-Lawson School of Construction, Blacksburg, VA, USA
Angelo Ciribini, PhD/ Professor,
[email protected]
Francesca Fascioli/ Graduate Student,
[email protected]
Ermanno Piccinni/ Graduate Student,
[email protected]
University of Brescia, Dept. of Civil & Env. Eng., Architecture and Urban Planning, Brescia, Italy
ABSTRACT
In this paper, the challenges and benefits of creating D4AR – 4 dimensional augmented reality– models and their applicability and usefulness for automated and visual monitoring of construction progress, safety and quality issues on typical housing projects are presented. D4AR models are generated by superimposing two emerging sources of information: (1) Building Information Models (BIM), and (2) daily construction photographs and videos. Using these two emerging and already available sources of information, the D4AR models extend the application of BIM which is primarily used for design coordination, system clash prevention and constructability analysis, to the construction phase of a project. These models automatically measure physical progress and visualize performance deviations by superimposing color-coded BIM elements over unordered and uncalibrated daily site imagery in a common 3D environment. In this study, the applicability and usefulness of these models and the prototype software developed by Golparvar-Fard et al. (2010) is tested and validated on the Bicocca housing project in Milan, Italy. The granularity of the underlying BIM and the Work Breakdown Structure (WBS) for an accurate construction monitoring and control is studied. Furthermore, it is examined how the D4AR models can help practitioners to remotely and easily find schedule deviations, safety issues and quality inconsistencies, resolve such issues in a timely manner, inform stakeholders of the most updated status of a project on a regular basis, and engage project participants early in the revision process to minimize the negative impacts of schedule delay and cost overrun. The challenges and benefits of generating and using the D4AR models, the requirements for the granularity of the BIM and WBS for planning and scheduling are presented and their applicability and usefulness based on the research conducted on the Milano Bicocca housing project are further discussed.
Keywords: D4AR Models, Augmented Reality, Photogrammetry, Building Information Models
1. INTRODUCTION
During the execution of any construction project, procedures for project monitoring and control become essential tools to managers and other project participants in the construction process. These tools serve a dual purpose of recording the schedule, cost, quality, safety, and environmental performance of a project, as well as providing managers with an indication of the actual progress and the problems associated with it (Hendrickson 2008). Despite the importance, current project monitoring and control practice has several limitations, which are primarily encapsulated in: (1) manual data collection on construction sites, and extensive data extraction from construction drawings, schedule, budget, and specifications; (2) non-systematic and generic reporting; and (3) visually and spatially complex representations (Golparvar-Fard et al. 2011, Navon and Sacks 2007). In addition to regular onsite monitoring procedures, project executives and architects also continuously travel to construction sites to perform site compliance inspections. These travels are usually associated with a significant cost and time, and as a consequence such visits are usually infrequent. There is a need for
techniques that can provide quick and accurate indications of the existence and the extent of performance deviations.
In contrast to the current practice of progress monitoring which includes manual data collection,
analysis, and reporting, most research in automated progress monitoring and control primarily focus
on automated measurement of physical quantities by spatial sensing technologies (Turkan et al. 2010, Golparvar-Fard et al. 2009, and Bosché 2009, Golparvar-Fard and Peña-Mora 2007). The application of these technologies is currently gaining attention as the outcome of every construction project is a tangible physical product, and its components primarily form the critical activities in the project schedule. An intuitive way to automate monitoring of construction performance, and highlight deviations and non-compliances is to generate an as-planned model which contains information about schedule, cost, quality, safety, and environment, and compare it with an as-built model which represents the actual performance. Over the past decade, a number of research studies have supported this concept. Cheok et al. (2000) used a terrestrial laser scanner and demonstrated real-time assessment of construction progress based on as-built 3D models. Jaselskis et al. (2005) explored the applications of using laser scanning for the purpose of accurate construction measurements. Golparvar-Fard and Peña-Mora (2007) proposed an approach for comparison of time-lapse imagery with Building Information Models (BIM) for the purpose of visualizing construction progress deviations. Golparvar-Fard et al. (2009) presented an approach for automated reconstruction of sparse 3D point cloud models using daily construction photographs and proposed a method for integrated visualization of these point clouds with 4D BIM. Bosché et al. (2009) introduced an automated approach for progress tracking by fusing 3D CAD and time-stamped 3D laser scanned point cloud models. Golparvar-Fard et al. (2010) proposed a new method to automatically generate dense 3D point cloud models from unordered site image collections (without any need for GPS or wireless location tracking), integrate with 4D BIM, automatically measure performance deviations through a new computer vision and machine learning algorithm, and finally visualize deviations using a traffic light metaphor.
The research presented here builds upon the approach proposed by Golparvar-Fard et al. (2011, 2010, and 2009) which is extended for comparison of nD building information models with daily construction photo and video collections. Since physical progress constitutes the critical activities in a project schedule, it is easy to see the value of automated progress monitoring. The automated process should facilitate the current challenges associated with the practice of progress monitoring, enhance reliability of monitoring activities, and provide an effective communication channel. In addition, remote sensing technologies might concurrently support multi-project or program controls in a cost-effective way.
The benefits of BIM for design coordination, system clash prevention and constructability analysis are nowadays realized by most architecture, engineering, and construction (AEC) companies. These benefits are rapidly turning BIM into a binding component of AEC contracts and enable its application as a proper baseline for remote project monitoring and control. Availability of cheap and high resolution digital cameras on the other hand, as well as high speed internet on construction sites enable rapid collection, analysis, and sharing of daily construction images and videos on a massive scale. The availability of such rich visual information which captures dynamic construction scenes at minimal cost enables 3D geometrical reconstruction and visualization of as-built models at high resolution (Golparvar-Fard et al. 2009). Using these two emerging and already available sources of information, Golparvar-Fard et al. (2011, 2010, and 2009) proposed the D4AR – 4 dimensional augmented reality- modeling which simultaneously visualizes as-built and as-planned models, automatically measures progress, and visualizes deviations by superimposing color coded BIM over site imagery in a common 3D environment. In this study, the applicability and usefulness of the D4AR modeling and the prototype software developed by Golparvar-Fard et al. (2010) is tested and validated on the Bicocca housing project in Milan, Italy. The study of the D4AR modeling and automated monitoring on European construction sites can identify potential cultural and operational limitations, and enables full examination of the applicability of this approach in an actual remote setting.
The specific goals of this research are to study (1) the required granularity for the BIM, and (2) the work breakdown structure (WBS) required as part of the planning and scheduling process, for an accurate and automated monitoring of construction progress. It further investigate how the D4AR models can help practitioners to remotely and easily find schedule deviations, safety issues and quality inconsistencies, resolve such issues in a timely manner, inform stakeholders of the most updated status
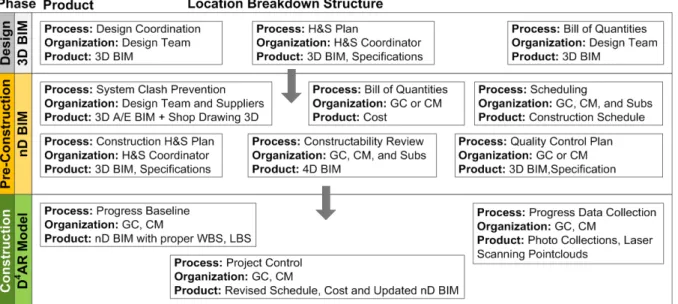
of a project on a regular basis, and engage project participants early in the revision process to minimize negative impacts of the schedule delays and cost overruns. The challenges and benefits of using the D4AR models, the requirements for granularity of BIM and the WBS, as well as their applicability and usefulness are further discussed. Figure 1 shows an overview of the process, organization, and product (POP) in the proposed project planning, monitoring, and control procedure. The figure shows that the models generated and used throughout the design, pre-construction and construction phase of a project are logically integrated. i.e., they all access shared data, and a change in any of these models should highlight or change the dependent aspects of the related models. In the following, the project case study is first introduced. Next the process of 3D, 4D and the D4AR modeling is presented. Finally, the challenges along with the observed and perceived benefits of the integrated process are discussed.
Figure 1: Overview of the Product-Organization-Process (POP) involved in different parts of an integrated planning, monitoring and control system.
2. THE PROJECT, PARTICIPANTS, AND MOTIVATIONS FOR USING 3D, 4D
AND 4D AR MODELING
The Bicocca housing project encompasses seven energy efficient high-rise residential buildings located at the Bicocca district, in the north-eastern area of Milan, Italy. The €18M project is developed and built by Cooperativa Muratori E Braccianti Di Carpi (CMB). The particular building project which is investigated in this paper is a 17-story reinforced concrete structure (fifteen-story superstructure), and was started on April 2010 and is scheduled for completion in July 2012. Figure 2 shows a rendered image of the Bicocca building #2’s BIM in addition to the site layout.
Figure 2: (a) Rendered image of the Bicocca high-rise building project, and (b) the site layout.
In this project, the general contractor allowed the authors to conduct a case study to find opportunities on how 4D models can facilitate pre-construction clash prevention and constructability reviews, and how their site personnel can be trained to take pictures and improve monitoring and control procedures established in their project. The scope of the conducted study was mainly on monitoring of the early finish of the critical activities associated with the structural skeleton elements. The following section presents how the as-planned and as-built information were collected.
3. AS-PLANNED AND AS-BUILT INFORMATION
3. 1 As-Planned Data Collection
In order to prepare a proper plan that could be used for constructability reviews, and form a baseline for revision and improvement of the schedule, the 3D building information model developed during the design phase was enhanced and linked with the construction schedule. In this particular project, the construction schedule was also significantly improved to provide the required level of detail for accurate progress monitoring and achieve the following objectives:
1. To enhance collaboration and communication during the detailed design stage;
2. To facilitate the design review process, conduct system class prevention, and highlight the non-compliances through coordination amongst architects, structural engineers and building system designers;
3. To support and improve the constructability plan among the general and trade contractors; 4. To review the schedule in an efficient way, and enable revision and validation of the plan; and 5. To report, record, and communicate the construction safety plan.
Provided with an adequate level of detail, not only 4D BIM serves as a strong collaborative tool during design and pre-construction stages of a project, but also enables accurate tracking of physical progress. One of the main challenges in this particular case study was that the Italian client had not requested BIM to be developed as part of the contract. Since in this project, the benefits of BIM were mainly being observed by the general and trade contractors, the design team was not motivated to take an active role in this effort. Particularly the design team was not interested since the color coding in the D4AR model could have identified a need for additional work on improving the Work Breakdown Structure (WBS), the Organization Breakdown Structures (OBS), and the Location Breakdown Structure (LBS) even after the completion of the design process. Even if BIM is requested as a binding component of the contract, there is still a chance that the contractor may only develop the model for preconstruction constructability reviews, and overlook further added-values through the application of the 4D BIM during the construction execution. The D4AR modeling’s requirements on the granularity of the 4D Model and the preferred locations of the controllers may need to be taken into account before the approval of the site layout plan. Figure 3 highlights the BIM’s desired level of detail for an effective D4AR modeling and monitoring.
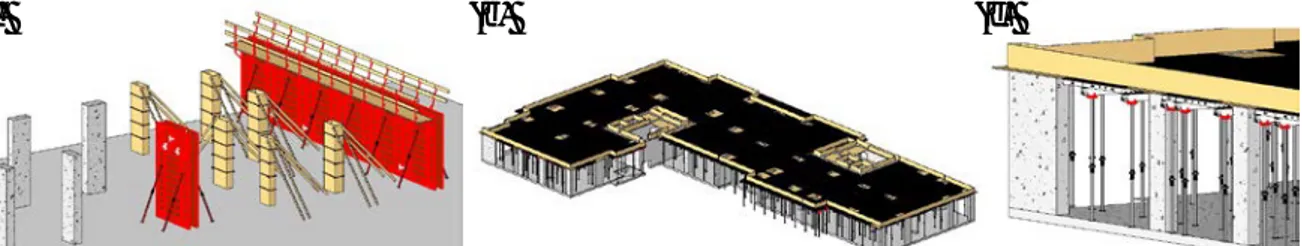
Figure 4: The formwork scaffolding and shoring are modeled as part of the as-planned model. The construction schedule is primarily linked to a 3D BIM to facilitate project planning, visualization of construction progress, and constructability reviews. The 4D model enables the construction team to closely work with project participants, simulate various operational plans, and find the best alternatives. Nonetheless in this study, there was a need for particular attention to the level of detail in the 4D model so that it can be effectively used as a baseline for progress monitoring. The level of the detail in the 4D model was envisioned to identify physical performance deviations at construction operation level. In this case, a color coding, similar to Golparvar-Fard et al. (2007) is useful in understanding the reasons behind a particular delay. Furthermore a special attention was given to make sure that the 4D model can enable the D4AR modeling to track progress in the time units necessary for a comprehensive Earned Value Analysis (EVA).
3. 2 As-Built Data Collection
The monitoring program considered for this project mainly consists of collecting visual information and comparing those with the plan to identify performance deviations. In addition to providing a platform for automated detection of physical progress, visual information (images and videos) enables assessment and control of safety and quality issues. In this project, two types of as-built data were collected: (1) daily construction photo collections; and (2) construction operation videos. In order to familiarize the team with the D4AR modeling approach, a set of pilot studies was initially conducted. Since there was no direct opportunity for training, the end users were provided with a set of guidelines for visual data collection to make sure the collected images have the required minimum baseline and overlap as proposed in Golparvar-Fard et al. (2009).
4. THE D
4AR MODELING
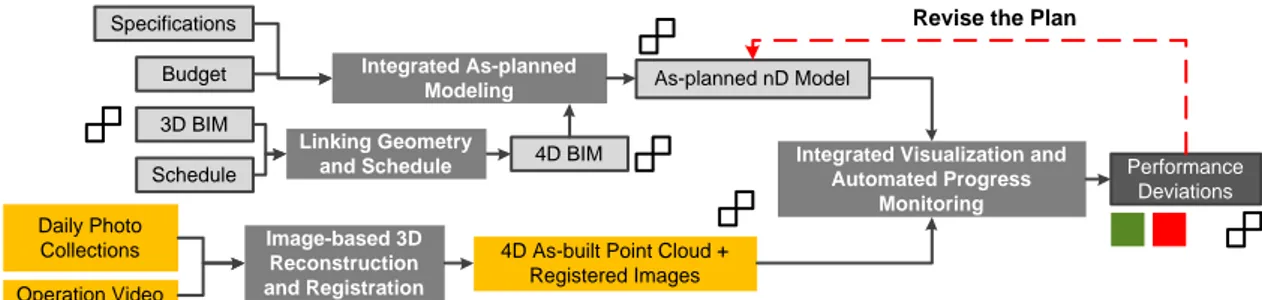
Figure 4 maps the process of generating the D4AR models from the project geometry, schedule, and as-built information. As observed in this figure, the plan information (3D BIM, schedule, budget, and specifications) were used to generate a 4D spatio-temporal and an integrated nD model. In addition, the photographs and videos were categorized and indexed based on their collection time. These visual data were used to generate 3D as-built point cloud model and register the site imagery. Finally the nD and the as-built point cloud models were integrated with a supervised registration process as proposed in Golparvar-Fard et al. (2011) and formed the D4AR model. The D4AR software viewer enables the users to query information from the nD BIM on demand and highlight elements using a traffic-light metaphor. 3D BIM Schedule Daily Photo Collections Operation Video 4D BIM Budget Specifications As-planned nD Model
4D As-built Point Cloud + Registered Images
Performance Deviations Revise the Plan
Integrated As-planned Modeling Linking Geometry and Schedule Image-based 3D Reconstruction and Registration
Integrated Visualization and Automated Progress
Monitoring
Figure 4: Overview of the data and process in implementation of the nD, and the D4AR model. The research team received two project schedules from the general contractor. The initial project schedule was generated in April 2010 and the revised version was dated October 2010. The level of detail in these schedules was sufficient enough to empower CMB to prepare summary schedules, and bill of quantities, but it required further improvement for 4D and the D4AR modeling. Given the requirement of granularity, the research team generated a highly-detailed 3D BIM. Nonetheless, there was also a need for a schedule that can enable monitoring of progress on a daily basis. Consequently, the WBS was revised and improved to enclose a high level of operational detail (e.g., visualizing different stages of forming, pouring, and placing concrete elements) and enable daily monitoring of construction progress.
In this project, the project participants were not benefiting from a central repository for image and video collections. Thus, the team started with a set of initial experiments. The minimal number of photos and their wide distribution in this initial experiment did not provide enough overlap or a reasonable baseline for a dense point cloud reconstruction. Over the course of a few experiments, more pictures were taken. In addition to taking pictures, high definition (HD) videos were also captured in few experiments. The HD videos become beneficial as it minimized the amount of control required for an effective photography. Figure 5 shows three 3D point cloud models that were generated during the construction of the building’s substructure. In this figure, (a), (b), and (c) are reconstructed with 30, 20 and 20 images collected on 17/4, 3/20, and 3/20 respectively. In 5.a, the spatial resolution of the images were about 4 megapixels, while in 5.b and c, about 3 megapixels. Figure 5.a was reconstructed in 35 minutes while 5.b and (c) were processed in about 26min (computation benchmarked on an Intel i7 with 12GBs of RAM on a Linux platform). These initial experiments familiarized the research team with the process of image and video collection. While as construction evolves, the process of taking photos becomes more challenging due to occlusions caused by progress of other elements (static) and equipment and crew (dynamic), yet the initial outcome of these experiments were promising.
(a) (b) (c)
Figure 5: (a) Image-based 3D reconstruction of the building substructure with 30 4-megapixel images; (b) and (c) 3D point cloud models generated with 20 3-megapixel images highlighting the formwork and temporary scaffolding.
Figures 6 and 7 illustrate two dense 3D point cloud model generated using 40 two-megapixel and 30 3-megapixel images that were captured from the 8th and the 10th floor respectively. In these figures, point clouds had densities of 1,360,715 and 431,586 points and were reconstructed in 57 and 38 minutes respectively. In these experiments, the recall - percentage of the images that were successfully registered to the 3D point cloud model - was 1.0. The computation time for generating these point cloud models was benchmarked on a Linux 64-bit platform running on an Intel i7 Core with 12GBs of memory. Figure 6.a shows the 3D reconstruction of the 8th floor construction. As observed, the operational details including the formwork, shoring, the rebar are all reconstructed. Figure 6.b and c show the point cloud from the same camera, while (c) shows an image-based rendering of the synthetic view observed in (b).
(a) (b) (c)
Formwork shoring
Rebars
Concrete Column
Figure 6: (a) Image-based 3D reconstruction of the building 8th floor construction using 40 two-megapixel images; (b) Synthetic rendering of the as-built point cloud from a camera viewpoint; (c) Rendered image along with the as-built point from the same camera viewpoint.
Figure 7 also shows the construction operational detail at the 10th floor. In Figure 7.a, b and c, the site is being observed from actual camera locations while the locations are preserved and the viewpoints are changed to let the user jointly explore the 3D point cloud model and the registered imagery. These reconstructed point cloud models provide inspectors with the ability to remotely investigate site logistics, in addition to monitoring safety or quality performance metrics.
(a) (b) (c)
Figure 7: Image-based rendering of the construction operation details at the 10th floor with 30 3-megapixel images.
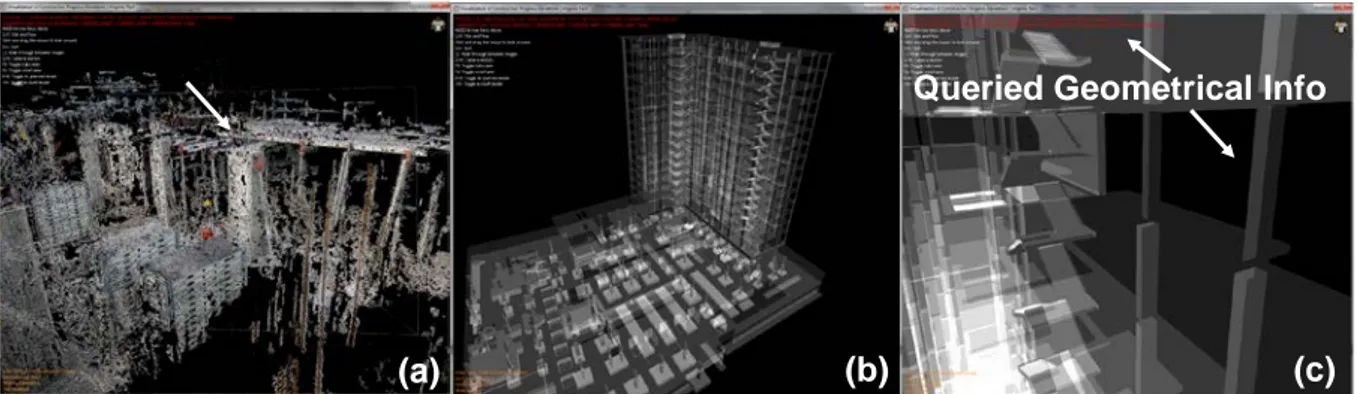
Finally Figure 8 shows the D4AR model of the site. Figure 8.a shows the point cloud; 8.b illustrates the BIM rendered in the native D4AR modeling viewer, and finally 8.c demonstrates a part of the 3D BIM which overlaps with 8.a. Here, the geometrical properties of a column are queried and demonstrated to the user.
(a) (b) (c)
Queried Geometrical Info
Figure 8: (a) Synthetic rendering of the 8th floor under construction; (b) 3D BIM rendered in the D4AR viewer; and (c) geometrical information of a column queried from the 3D BIM.
5. CHALLENGES ENCOUNTED AND OBSERVED AND PERCEIVED BENEFITS
WHILE BUILDING THE 3D, 4D AND D
4AR MODELS
The construction of the D4AR models posed a number of challenges related to the geometry (level of detail), the plan and the schedule (work breakdown structure), the linking of the geometry and the schedule for formation of a proper baseline for progress monitoring, the as-built visual data collection (photo collections and videogrammetry), and finally generating an integrated augmented reality scene. Some of these issues are quite common during the development of 4D models, especially when the 3D BIM is created without considering the need for 4D modeling (construction planning), or the D4AR modeling (automated progress monitoring). Furthermore, the construction of a D4AR model requires detailed project schedule, scope and expected performance information. Some of this information is precisely what that the project participants need for development and revision of 4D models, and other information mainly relates to the as-built performance, and maybe not available due to a lack of construction operation details during the planning phase. An overall valuable contribution of the D4AR modeling is that it can show when the performance (scope, schedule, cost, safety, and environment) has reached the desired level, and where additional data collection, or reasoning is needed. Due to the required level of detail for the D4AR modeling, the modeling process needs to be built into the planning phase; otherwise the challenges may overweight the benefits. The following provides the challenges, along with the perceived and observed benefits of the conducted research experiment:
5.1 Level of granularity in the 4D model: In this particular project, the 2D architectural and
engineering drawings, and the construction schedule that were prepared by the developer and the general contractor were not anticipated to be used for integration and improvement of coordination among project participants. Nor the contractor intended to use this information for model-based cost estimation or pre-construction constructability analysis. Hence, the authors who were passive members of the project generated the 3D BIM without any particular feedback from the contractor or other project participants.
Despite the importance, in Italy, designers and contractors usually follow a traditional project delivery which results in 2D drawings, technical specifications, bill of quantities, and etc. This issue implies that in these cases, there is a chance that the Work Breakdown Structure may not be carefully structured. Consequently the breakdown structure needs to be amended and revised during the construction operation, which this process may compromise the code compliances. For an accurate progress monitoring, the 4D BIM needs to include the sequence of operations and trades workflow, and may involve analysis of the trades skills, workmanship and production of the machinery. Such high level of detail might not be available during the planning stage. If the client does not require 3D and 4D BIM to be generated throughout the design and pre-construction phase, given the challenges associated with modeling operation details, it will be difficult to highlight the benefits of the D4AR modeling. Of course if the developer demands the general contractor to generate the 4D model, these
challenges will be minimized. The authors observed that a highly detailed 4D model can facilitate visualization of potential pitfalls and reduction of construction waste throughout the D4AR modeling process. It can also provide an effective work breakdown structure that aims to support trade’s production and assembly plans. Overall, a detailed WBS in the nD model enables the following:
1. Construction physical progress and quantities can be monitored by superimposing 3D BIM elements with as-built point cloud models and identifying proper percentages of completion; 2. Progress tracking at construction activity-level can color-code elements and highlight
excusable/ non-excusable delays, and assign responsibilities of the identified deviation to various trade contractors;
3. Progress monitoring at operation-level supports productivity assessments and enables corrective actions on the operation of the construction equipment, and the work crew;
4. Progressive quality monitoring enables accomplished or in-progress work to be continuously assessed and controlled to comply with the contractual agreements.
5. Unexpected workflows of the foremen and the crew can be continuously monitored to evaluate safety issues and other potential interferences (e.g. crossing restricted areas, working below handling equipment);
6. Provisional works (e.g., scaffolding, formworks) can be remotely inspected by comparing the visual as-built data with a visual inventory of expected solutions;
7. Motions and postures of the workers can be surveyed and analyzed for compliance with occupational health regulations.
5.2 Information Management Systems: In the observed case study, the team did not benefit from
an online repository of project information. Having a web-based information sharing system can significantly help with the management of the as-planned and as-built data and can facilitate revision of the 4D model for an accurate D4AR modeling and automated progress monitoring.
5.3 Model Sharing: A significant challenge observed in this project was that the 4D model was not
required as part of the contract. Ideally the general and trade contractors can go through a collaborative process to generate the as-planned nD models. A formalized process can significantly minimize the challenges associated with the level of detail required for the D4AR models.
5.4 Communication: The observations conducted in this study clearly show that there is a need for
strong communication among parties that are involved in preparation of the 4D model. Particularly in this case study, due to the contractual relationship between the formwork company and the trade contractor, information was communicated very slowly with the team, and consequently generation of the 4D model was significantly slowed.
5.5 Progress Data Collection and Extraction: While high resolution digital cameras are cheap and
their application for progress monitoring is affordable by all AEC professionals, there is still a need for proper training. The site managers and foremen should be provided with guidelines on how the required overlap and baseline among the images can be achieved. Since these photos are mainly used for comparison with the 4D model, it is important for the site managers and foremen to be familiar with the level of detail in BIM and the WBS. In modular high-rise building projects where significant progress can be achieved over a few days, it is important to train the team on the best locations and configurations that the photos can be taken from. In addition to the problems encountered in establishing photogrammetry and videogrammetry guidelines, the team also encountered several site conditions that affected implementation of the process. Inclement weather conditions and precipitations (e.g., rain and fog) can affect successful implementation of an image-based monitoring technique. In addition to the impact of different weather conditions, there are other constraints related to the construction site that should not be underestimated. Because of the particular location of the building in this case study, initially, during the substructure work, the team was only able to take pictures from one side of the building and therefore many elements were not in the field of view or they were simply occluded by the others. The team managed to take several photos from the top of the tower crane; nonetheless these photos were mainly suitable for formation of panoramas and most image pairs did not have a wide baseline for a proper 3D reconstruction. Image-based monitoring also requires establishment of good relationship with the construction personnel to enable photos to be taken with least amount of impact on the crew’s productivity.
5.6 Progress Data Analysis: Given the low visibility and challenges associated with the data
collection, it seems imperative to study the impact of visibility (low visibility, high degree of occlusion) on the automated assessment of construction progress. For example, as shown in Figure 5.c only parts of the under construction components are visible. In these situations, there is a need for a mechanism that can provide feedback to the site manager and highlight the areas that do not have enough visual data for a proper assessment.
5.7 Validation of the Automated Progress Detection and Feedback to Project Participants on the Confidence Factor in Measurements: The end-user should be provided with a confidence factor
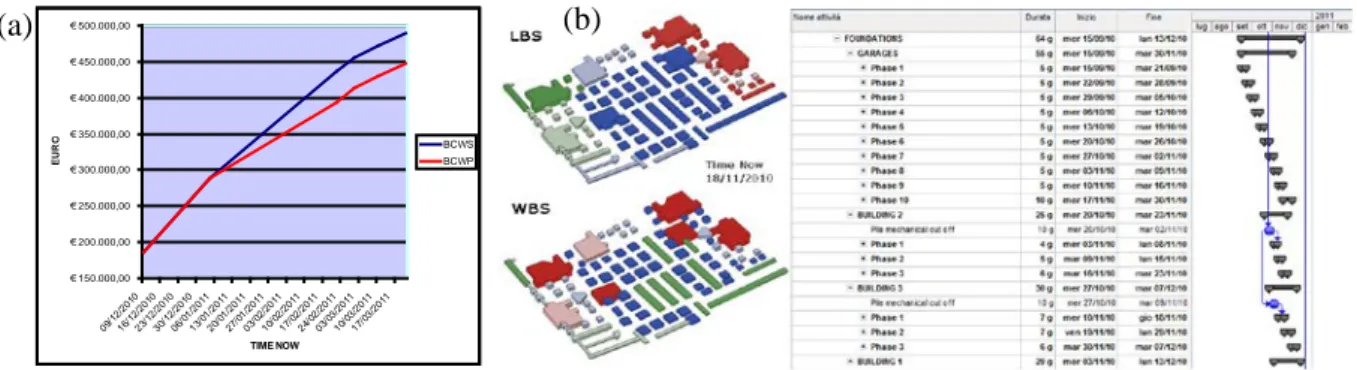
to highlight the accuracy of progress measurements. In this particular study, using the unit rates provided by CMB, the authors were able to calculate budgeted cost of the work scheduled (BCWS) and the budgeted cost of the work performed (BCWP). This analysis is enabling the team to properly analyze the accuracy of the automated progress monitoring and identify the earned value deviations. Table 1 and Figure 9.a show the outcome of the Earned Value Analysis.
Table 1: Earned Value Analysis of the monitored construction progress.
TIME NOW BCWS BCWP
Foundations 09/12/2010 € 186,011.00 € 186,011.00
Elevations level -2 04/01/2011 € 288,946.00 € 288,946.00
Elevations level -1 22/02/2011 € 436,485.00 € 394,395.00
Ed. 2 ground floor elevations 01/03/2011 € 455,245.00 € 413,245.00
Ed. 2 first floor elevations 10/03/2011 € 472,395.00 € 430,395.00
Ed. 2 second floor elevations 21/03/2011 € 489,545.00 € 447,545.00
5.8 Safety Analysis: In Italy, safety guidelines are usually documented in textual format, and
contractors do not generate visual safety plans. This minimizes the applicability of the D4AR modeling for automated safety monitoring. Further research is required on (1) how safety plans can be generate to form proper monitoring baselines; (2) how in absence of safety plans, the site visual information can be analyzed to automatically identify unsafe locations and practices.
5.9 Location-based Planning and Monitoring: In activity-based planning and monitoring (CPM,
PERT, MPM), corrective actions are made after the non-compliances or deviations have been detected. Consequently these approaches follow a management-by-exception approach and do not provide proactive warning mechanisms. For the purpose of providing preventive warnings, there is a need for a location-based planning approach which can contemplate aggregated activities in multiple variable physical locations, and consider locations as the main managerial factors. It will be beneficial if a location-based planning is adopted as part of the baseline in the D4AR progress tracking. This enables improvement on the timeliness and reliability of the records and facilitates visual progress reporting. Figure 9.b shows the LBS and WBS color coding of the construction progress.
€ 150.000,00 € 200.000,00 € 250.000,00 € 300.000,00 € 350.000,00 € 400.000,00 € 450.000,00 € 500.000,00 09/1 2/201 0 16/1 2/201 0 23/1 2/201 0 30/1 2/201 0 06/0 1/201 1 13/0 1/201 1 20/0 1/201 1 27/0 1/201 1 03/0 2/201 1 10/0 2/201 1 17/0 2/201 1 24/0 2/201 1 03/0 3/201 1 10/0 3/201 1 17/0 3/201 1 TIME NOW E URO BCWS BCWP
Figure 9: (a) Earned Value Analysis S-curve; (b) Color coded LBS and WBS
5.10 On-demand Query of the Plan and As-built Information: The D4AR models localize images
in a common 3D environment and enable geo-spatial query of the plan and actual progress information. For example such a tool enables the end user to visually select a particular foundation wall from an image, query the budgeted cost of the work scheduled (BCWS), and compare it with the actual cost of the work performed (ACWP) for billing purposes.
6. CONCLUSIONS AND FUTURE WORK
This research aimed to visualize construction progress deviations through integration of daily construction photos and videos with 4D BIM in an augmented reality environment. The level of detail required for BIM and the work breakdown structure required for a proper planning and monitoring were investigated, and a set of recommendations were provided. The challenges associated with the application of the D4AR models and their observed and perceived benefits were discussed. It was observed that instead of an activity-based planning, a location-based planning might not only enable monitoring of physical progress, but also enables control decisions to be made before a deviation is occurred. In addition, the authors evaluated how unskilled end users can collect and upload photos in a remote construction setting. The specific focus was on structural skeleton elements while monitoring interior spaces and construction operations are entailed as future work. As part of a larger research project, several experiments are also being conducted on comparison of Image-based and LADAR-based technologies and the results will be reported soon. More work needs to be done to define criteria suitable for preparing a 4D BIM to comply with the requirements of remote visual tracking systems (granularity, locations, etc.). 3D spatial grids need to be configured properly to enable a location-based planning and monitoring. The construction plans also need to be characterized based on the expected environmental, occupational health, as well as safety performances. The D4AR modeling should also be extended to enable color coding based on WBS, LBS, and OBS. There is also a need for automated tracking of the worker and monitoring their interactions for compliance with occupational health regulations. Further research is needed on automated remote inspection of provisional works (scaffolds, formworks, etc.), automated quality control, automated tracking of the deliveries and detection of shortages of supplies; finally a mechanism to support analysis on the reasons behind deviations and non-compliances.
ACKNOWLEDGMENTS
The authors like to acknowledge the support of the CMB in the Bicocca building project. Any opinions, findings and conclusions or recommendations expressed in this paper are those of the authors and do not necessarily reflect the views of the CMB or other project participants.
REFERENCES
Bosché, F. (2009). “Automated recognition of 3D CAD model objects and calculation of as-built dimensions for dimensional compliance control in construction.” Elsevier J. of Adv. Eng.
Informatics, 24, 107-118.
Cheok, G.S., Stone, W.C., Lipman, R.R. and Witzgall, C. (2000). “LADARs for construction assessment and update.” Elsevier J. of Automation in Construction, 9(5), 463–477.
Golparvar-Fard, M., and Peña-Mora, F. (2007). “Application of Visualization Techniques for Construction Progress Monitoring”, Proc., 2007 ASCE Int. Workshop on Computing in Civil
Engineering, Pittsburgh, PA.
Golparvar-Fard, M., Peña-Mora, F., and Savarese, S. (2010). “D4AR – 4 Dimensional augmented reality - tools for automated remote progress tracking and support of decision-enabling tasks in the AEC/FM industry.” Proc., 10th International Conf. on Innovation in AEC. State College, PA.
Golparvar-Fard, M., Peña-Mora, F., and Savarese, S. (2011). “Integrated sequential built and as-planned representation with D4AR – 4 dimensional augmented reality - tools in support of decision-making tasks in the AEC/FM industry.” ASCE Journal of Construction Engineering and
Management.doi:10.1061/(ASCE)CO.1943-7862.0000371
Golparvar-Fard, M., Peña-Mora, F., and Savarese, S. (2009). “D4AR- A 4-Dimensional augmented reality model for automating construction progress data collection, processing and communication.” Journal of Information Technology in Construction (ITcon), 14, 129-153.
Hendrickson, C. (2008). Project Management for Construction – Fundamental Concepts for Owners,
Engineers, Architects and Builders, version 2.2, http://www.ce.cmu.edu/pmbook/.
Jaselskis, E., Gao, Z. and Walters, R.C. (2005). “Improving transportation projects using laser scanning.” ASCE Journal of Construction Engineering and Management, 131, 377-384.
Navon, R. and Sacks, R. (2007). “Assessing research issues in automated project performance.”
Elsevier Journal of Automation in Construction, 16(4), 474–484.
Turkan, Y., Bosché, F., Haas, C., and Haas, R. (2010). “Towards automated progress tracking of erection of concrete structures.” Proc., 10th Int. Conf. on Innovation in AEC. State College, PA.