1
UNIVERSITÀ DEGLI STUDI DI BRESCIA
PH.D. IN
Genetica Molecolare Biotecnologie e Medicina Sperimentale
(Genetica Molecolare Applicata alle Scienze Mediche)
Settore Scientifico e disciplinare
MED/03
Ciclo
XXXIII
TITOLO DELLA DISSERTAZIONE
Towards Precision Psychiatry: A data-driven strategy for prioritizing antidepressant drug
prescription based on predicted gene expression and drug-induced expression profiles
NOME DEL DOTTORATO DELL’ANNO FINALE
NOME DEL SUPERVISORE
Muhammad Shoaib
Prof. Massimo Gennarelli
Firma
Firma
NOME DEL COORDINATORE DEL PHD
Prof. Eugenio Monti
Contents
Acknowledgments ... 3 Statement of Authorship ... 4 Riassunto ... 5 Abstract ... 6 General part ... 7 1. Introduction ... 81.1 Major Depressive Disorder (MDD) ... 8
1.2 The Pharmacogenetics of Antidepressants ... 9
2. Statistical methods behind pharmacogenomics studies: GWAS, PRS, and TWAS ... 16
2.1 Genome-Wide Association Studies (GWAS) ... 16
2.2 Polygenic Risk Score Analysis ... 22
2.3 Transcriptome-wide association study (TWAS) ... 24
3. The Connectivity Map and its applications in pharmacogenomics. ... 29
3.1 Major components of the CMap analysis pipeline ... 30
3.2 Gene Set Enrichment Analysis (GSEA) to estimate connectivity scores. ... 31
3.3 Application of CMap in pharmacogenomics ... 33
Research Part ... 35
4. Project aims and outline of the thesis ... 36
5. Investigating an in-silico approach for prioritizing antidepressant drug prescription based on drug-induced expression profiles and predicted gene expression ... 37
5.1 Introduction ... 37
5.2 Methods ... 38
5.3 Results ... 46
5.4 Discussion ... 53
6. Prediction of antidepressant response using a supervised learning approach leveraging predicted gene expression and in-vitro drug-related expression profiles... 57
6.1 Introduction ... 57 6.2 Methods ... 57 6.3 Results ... 61 6.4 Discussion ... 63 7. Conclusion ... 65 8. References ... 66
9. Details of scientific activities performed during Ph.D... 78
3
Acknowledgments
First and foremost, I would like to express my gratitude to my supervisor Prof. Massimo Gennarelli for giving me the opportunity to work in his research group and for his continuous support, encouragement, and mentorship throughout my Ph.D. I am also grateful to my senior colleagues, Chiara Magri, Edoardo Giocupuzzi, and Alessandra Minelli for advising me with their knowledge and expertise.
Secondly, my warmest thanks to my co-supervisor Prof. Cathryn Lewis for welcoming me to her research team at King’s College, London. The ten months visiting period helped me to acquire a new set of skills in the field of statistical genetics. I am also grateful to postdocs Oliver Pain and Chiara Fabbri for their great supervision and their input to the research work presented in this thesis. My sincere thanks to the external reviewers Francesco Mazzarotto from the University of Florence and Carlo Maj from the University of Bonn for carefully evaluating my Ph.D. thesis.
Finally, special thanks to my parents, my wife, and son for their unconditional support and love. They have always been an immense source of motivation and encouragement during my Ph.D. journey.
Statement of Authorship
Throughout this thesis, the scientific convention of using the pronoun ‘we’ has been adopted when presenting the research methodology and results. However, all work in Ph.D. thesis was performed and written by Muhammad Shoaib, with the following exception:
In Chapter 5, the genotyping data of STAR*D studies were collected, pre-processed and quality controlled by others prior to analysis. All statistical analysis was performed by Muhammad Shoaib and the first draft of the paper was written by Muhammad Shoaib. Subsequently, it was circulated among co-authors and underwent peer review before publication, which led to the editing of the manuscript and inclusion of additional analysis.
Moreover, supervisors and co-authors of the paper included in this thesis offered valuable advice on the analyses, results interpretation, and editing of the manuscript.
5
Riassunto
Nella pratica clinica, la terapia con antidepressivi è un approccio per tentativi che richiede tempo per essere messo a punto ed in molti casi questo processo è sconfortante per i pazienti. Da qui nasce l’esigenza di sviluppare strumenti che permettano di indirizzare meglio il clinico nella scelta dei migliori farmaci da utilizzare. In questa tesi sono proposti degli approcci in silico per classificare gli antidepressivi in base alla loro ipotetica probabilità di efficacia e sono sviluppati modelli di machine learning per prevedere la risposta antidepressiva in individui affetti da disturbo depressivo maggiore. Partendo dai risultati di uno studio di associazione genome-wide nella coorte STAR*D (N=1163), abbiamo inizialmente imputato la “signature” del profilo trascrittomico dei pazienti che rispondevano alla terapia con citalopram. Successivamente, utilizzando le correlazioni di Spearman, Pearson e il test di Kolmogorov Smirnov, abbiamo correlato il profilo trascrizionale dei pazienti che rispondevano alla terapia con 21 profili di espressione genica indotti da antidepressivi in cinque linee cellulari umane disponibili nel database delle mappe di connettività (Cmap). Infine, abbiamo ordinato gli antidepressivi in modo decrescente in base alla media degli indici di correlazione ottenuti con i tre diversi metodi e abbiamo calcolato la probabilità di ottenere casualmente tale posizione in classifica mediante permutazione. I farmaci con un grado di correlazione positivo più elevato erano quelli con una probabilità di efficacia maggiore.
In MCF7 (linea cellulare di cancro al seno), il farmaco con il rango medio più elevato è risultato essere l’escitalopram (p = 0,0014). Nelle linee cellulari A375 (melanoma umano) e PC3 (cancro alla prostata), escitalopram e citalopram sono risultati essere i più significativi (p = 0,0310 e 0,0276, rispettivamente). Nelle linee cellulari HA1E (rene) e HT29 (cancro del colon), invece, i profili trascrizionali del citalopram e dell'escitalopram non predicevano la risposta al citalopram.
La correlazione significativa tra i profili di espressione dei pazienti che rispondono al citalopram e i profili d’espressione indotti da citalopram e (es)citalopram in tre linee cellulari suggerisce che il nostro approccio può essere utile e, con futuri miglioramenti, può essere applicabile a livello individuale per personalizzare la prescrizione del trattamento.
Inoltre, abbiamo implementato modelli di regressione logistica e di regressione netta elastica per prevedere la risposta antidepressiva individuale in base alla correlazione tra i profili di espressione individuali imputati nei pazienti della coorte STAR*D e i profili d’espressione dei farmaci disponibili in Cmap. Il metodo di regressione logistica ha identificato negli antidepressivi triciclici i migliori predittori della risposta al citalopram. Il modello di regressione netta lineare invece è riuscito a identificare una correlazione significativa solo in una linea cellulare.
Abstract
In clinical practice, antidepressant prescription is a trial-and-error approach, which is time-consuming and discomforting for patients. This study investigated an in-silico approach for ranking antidepressants based on their hypothetical likelihood of efficacy and machine learning models to predict antidepressant response in individuals suffering from major depressive disorder.
We predicted the transcriptional profile of citalopram remitters by performing an in-silico transcriptome-wide association study on STAR*D genome-wide association study data (N=1163). The transcriptional profile of remitters was compared with 21 antidepressant-induced gene expression profiles in five human cell lines available in the connectivity map database. Spearman correlation, Pearson correlation, and the Kolmogorov Smirnov test were used to determine the similarity between antidepressant-induced profiles and remitter profiles and, subsequently, the average rank of antidepressants across the three methods and a p-value for each rank were calculated using a permutation procedure. The drugs with the top ranks were those having a high positive correlation with the expression profiles of remitters and that may have higher chances of efficacy in the tested patients.
In MCF7 (breast cancer cell line), escitalopram had the highest average rank, with an average rank higher than expected by chance (p=0.0014). In A375 (human melanoma) and PC3 (prostate cancer) cell lines, escitalopram and citalopram emerged as the highest ranked antidepressants, (p=0.0310 and 0.0276, respectively). In HA1E (kidney) and HT29 (colon cancer) cell types, citalopram and escitalopram did not fall among the top antidepressants.
The correlation between citalopram remitters’ and (es)citalopram-induced expression profiles in three cell lines suggests that our approach may be useful and with future improvements, it can be applicable at the individual level to tailor treatment prescription.
Furthermore, we implemented logistic regression and elastic net regression models to predict antidepressant response based on the correlation between inferred expression profiles of individuals with major depressive disorder from STAR*D and in-vitro drug profiles from the connectivity map. The logistic regression method suggested tricyclic antidepressants as the most significant predictors associated with the response phenotype. Moreover, when we applied the elastic net regression model to five cell lines, the model performed well only in one cell line (HA1E) to predict drug response in STAR*D participants.
7
1.
Introduction
1.1 Major Depressive Disorder (MDD)
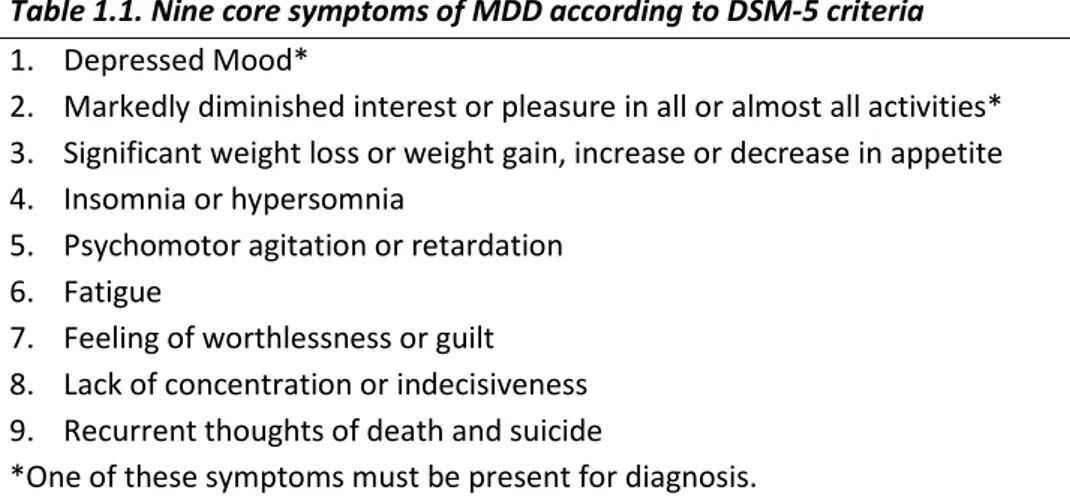
Major Depressive Disorder (MDD), also widely known as depression is a primary health issue and the third leading cause of disability in adolescents and young adults, while being the second leading cause of disability in middle-aged adults on a global scale (James et al. 2018). According to the World Health Organization, more than 264 million people are living with depression worldwide. According to the diagnostic and statistical manual of mental disorder, 5th edition (DSM-5) criteria, the diagnosis of MDD requires observation of at least five or more symptoms in an individual for two weeks (American Psychiatric Associations 2013) (Table 1.1).
Table 1.1. Nine core symptoms of MDD according to DSM-5 criteria 1. Depressed Mood*
2. Markedly diminished interest or pleasure in all or almost all activities* 3. Significant weight loss or weight gain, increase or decrease in appetite 4. Insomnia or hypersomnia
5. Psychomotor agitation or retardation 6. Fatigue
7. Feeling of worthlessness or guilt 8. Lack of concentration or indecisiveness 9. Recurrent thoughts of death and suicide
*One of these symptoms must be present for diagnosis.
Based on family, twin, and adoption studies, it has been observed that genetic factors play an important role in MDD. Forty to fifty percent heritability was reported by twin studies whereas family studies suggested a two to three-fold increment in lifetime risk of developing MDD among first-degree relatives (Lohoff 2010). In 2017, the Psychiatric Genomic Consortium (PGC) identified 44 loci associated with MDD after conducting a genome-wide association study (GWAS) of 130,664 MDD cases and 330,470 controls (Wray et al. 2018). In 2019, the meta-analysis of three large GWASs identified 102 independent variants (246,363 cases and 561,190 controls) associated with MDD. Briefly, from GWASs emerged that MDD is a multifactorial and polygenic disorder, where multiple sets of susceptible genes interact with each other and with the environment, predisposing individuals to the development of the illness.MDD is often comorbid with other health conditions such as cardiac
9
disease, diabetes, and obesity (Whooley and Wong 2003), suggesting that MDD could share genetic and environmental factors with other disorders.
Several therapeutic options are available for treating MDD, including psychological treatments such as behavioural activation, cognitive behavioural therapy (CBT), interpersonal psychotherapy (IPT), and pharmacotherapy. Antidepressants (ADs) are usually prescribed for treating moderate and severe MDD cases. There are five major classes of antidepressants: 1) Selective Serotonin reuptake inhibitors (SSRIs), 2) Serotonin and norepinephrine reuptake inhibitors (SNRIs), 3) Noradrenergic and specific serotonergic antidepressants (NASSAs), 4) Tricyclic antidepressants (TCAs), (5) Monoamine oxidase inhibitors (MAOIs). These different classes of drugs work by preventing the reabsorption of neurotransmitters in the brain. SSRIs inhibit the reuptake of serotonin whereas SNRIs inhibit the reuptake of both serotonin and norepinephrine. Further, TCAs work by modulating three neurotransmitter molecules in nerve cells that are serotonin, norepinephrine, and acetylcholine. The MAOIs function by blocking the effect of monoamine oxidase enzyme, increasing the availability of neurotransmitters for mood regulation. Moreover, NASSAs act by antagonizing alpha-adrenergic receptors and certain serotonin receptors which results in the enhancement of adrenergic and serotonergic neurotransmission in the brain (Fasipe 2018). Antidepressant choice in MDD is based on prescription guidelines and prior clinical experience, but the lack of reproducible predictors of AD response makes it a ‘trial and error’ approach which can take up to several weeks or months and a number of treatment changes before symptom remission is achieved. More than 60% of patients fail to achieve remission after being treated with the first AD. Several studies have demonstrated that AD response is a trait with a genetic component, indeed AD response frequently clusters in families (O’Reilly, Bogue, and Singh 1994) (Franchini et al. 1998) and common genetic variants were estimated to explain 42% of the variance in AD response (Tansey et al. 2013a). Due to the heterogeneous and polygenic attribute of AD response, researchers are employing Big Data, GWAS, and multi-markers approaches to study the AD response trait among MDD patients (Musker and Wong 2019). The lack of reproducible biomarkers predicting AD response and limited knowledge of clinical improvement are primary challenges of depression treatment (Labermaier, Masana, and Müller 2013).
1.2 The Pharmacogenetics of Antidepressants
Based on the above rationale, pharmacogenetics represents a key contributor to the implementation of precision medicine.
The term pharmacogenetics has been in use since 1959. Pharmacogenetics was first referred to as the relationship between phenotypic variation in metabolism and response to certain drugs. Then in
the 1980s, thanks to the scientific advances in human genetics, the genetic basis of this phenotypic variation become clearer and pharmacogenetics becomes the study of how genetic variants affect a person’s response to drugs. At the end of the 1990s, with the advent of the Human Genome Project, the term pharmacogenomics started to be used in addition to pharmacogenetics. Both terms are now used interchangeably in the literature (PharmGKB, 2017a).
In pharmacogenetics (PGx), genomic information is used to study the drug response among individuals and to develop effective, safe medications and define doses that will be tailored to a person’s genetic makeup (Kisor, Hoefer, and Decker 2019). Single nucleotide polymorphisms (SNPs), deletions, insertions, and short tandem repeats are different types of genetic variations that might have a role in drug response and can be utilized as predictive markers to evaluate treatment response in a patient (Kisor, Hoefer, and Decker 2019).
As far as pharmacogenomics of AD is concerned, many studies focalized on genes implicated in the pharmacokinetics or pharmacodynamics of AD, and more recent hypothesis-free approaches have identified novel candidates for AD response. However, results are not always concordant, and the modest effects observed have confirmed the polygenicity of the trait and the involvement of multiple genetic variants of small effect.
In the following sections, an overview of the main pharmacogenomic studies of AD drug response will be provided.
1.2.1 Candidate gene studies
To understand the PGx of AD response, candidate gene studies pointed out several genes that may influence drug response. This approach has focused mainly on two classes of genes. The first class includes those genes that encode proteins involved in the Pharmacokinetics of drugs. The mechanisms, such as drug absorption, metabolism, distribution, and elimination which have an impact on the delivery of drug to the target site, are regulated by pharmacokinetic genes. The cytochrome P450 (CYP) gene family is a category of enzymes with a substantial role in the oxidation and reduction of endogenous and xenobiotic substances. This gene family includes CYP2D6, CYP2C19, CYP2C9, CYP3A4, and CYP1A2 genes and they are important in the metabolism of various ADs (Gaedigk et al. 2018). The isoenzymes responsible for AD metabolism and considered determinant in AD clinical outcome are CYP2D6 and CYP2C19. The genes coding for these enzymes are highly polymorphic and the different alleles encode for an enzyme with normal, partially or totally defective activity or increased activity. Based on the allelic combinations of CYP2D6 and CYP2C19 genes and their effect
11
on enzymatic activity, individuals are categorized into poor metabolizers (PMs), intermediate metabolizers (IMs), extensive metabolizers (EMs), and ultra-rapid metabolizers (UMs) (Nassan et al. 2016). Individuals carrying two defective alleles are PMs whereas UMs carry two alleles with an increased activity or gene duplications. EMs individuals instead have two functional alleles; therefore, they have normal enzymatic functions and drug metabolism. IMs have one defective allele, hence they may have slower drug metabolism (Corponi 2019). Prior studies suggested a relationship between CYP2D6 variants and the concentration of antidepressants in the blood plasma. According to the reported evidence, individuals carrying PMs variant are at higher risk of toxic reactions, while UMs require a higher drug dosage to achieve a therapeutic level of drug concentration in the blood plasma (Hicks et al. 2017). Despite various studies that have advanced our understanding of CYP genes and their role in ADs metabolism, we still do not have strong evidence linking these genes to the clinical outcome for commonly used ADs. For instance, for selective SSRIs, there was not a strong correlation between CYP genes and the clinical outcome, which suggests metabolizer status dependent therapies do not have a significant clinical impact (Fabbri et al. 2018). The second class of genes considered by candidate genes studies are pharmacodynamics target genes which are directly affected by the drugs. As we have a limited understanding of ADs pharmacodynamics, the receptor and target binding sites of ADs and their complete mechanism of actions are unknown. The selection of relevant pharmacodynamics genes thus poses a challenge. Since it has been hypothesized that the monoaminergic system is involved in the pathophysiology of MDD, genes encoding monoamine neurotransmitters have been investigated for the ADs response (Fabbri, Di Girolamo, and Serretti 2013). One notable example in this context is the SLC6A4 gene which has extensively been studied (Licinio and Wong 2011). The allelic differences of SLC6A4 modulate the expression of serotonin transporter protein which results in varied serotonin uptake. Studies based on meta-analysis suggest that the long L allele of serotonin transporter-linked promoter region (5-HTTLPR) predicts better SSRI response in the Caucasian population while it was found to have an opposite effect in the Asian population (Fabbri, Di Girolamo, and Serretti 2013). Additionally, variants of other pharmacodynamic genes (HTR1A, HTR2A, COMT, GNB3, CNR1, NPY, MAOA, FKBP5, and BDNF) has also been previously investigated (A. Serretti and Artioli 2004). Because of the involvement of the hypothalamic-pituitary-adrenal (HPA) axis in MDD pathophysiology, FKBP5 and NR3C1 are important candidates for the heterogeneous behaviour of AD response. Both genes play a significant role in glucocorticoid pathway, hence, they are promising pharmacodynamic candidate genes. Variants of the FKBP5 gene have been found to be associated with differential therapeutic response. MDD patients who were homozygous for the T allele of the rs1360780 SNP in the FKBP5 gene responded faster to SSRIs, TCAs, and mirtazapine compared with the carriers of C alleles. However, these results are still preliminary and
need to be replicated in other samples (A. Serretti, Drago, and Liebman 2009)(Chiara Fabbri et al, 2014). Another interesting candidate is G (guanine nucleotide-binding) protein beta 3 subunit gene (GNB3). Variants of this gene were found to be related with better AD response in multiple investigations. (A. Serretti, Drago, and Liebman 2009). Another candidate gene is the corticotrophin releasing hormone (CRH) receptor 1 gene. Researchers detected fluoxetine therapeutic response associated with the variants of this gene. Also, neurotrophic factors are considered as the promising candidates for pharmacogenomic investigations (A. Serretti, Drago, and Liebman 2009).
Despite valuable contributions made by candidate gene studies, the findings reported are still inconsistent and could not be further replicated. Since, the availability of high-throughput technologies has allowed researchers to conveniently perform a genome-wide analyses. Therefore, PGx studies of AD response have now shifted from the candidate gene to GWAS.
1.2.2 Role of GWAS in elucidating the architecture of antidepressant treatment
response.
GWAS is a hypothesis-free technique to identify SNPs associated with the phenotypes/traits of interest without any prior knowledge of causal variants.
GWAS have contributed significantly to elucidating the etiology of complex polygenic psychiatric diseases. After attaining sufficient sample size and power, GWAS can be used as a powerful tool in the identification of genetic variants associated with a particular trait or a disease. In contrast to candidate gene studies, GWAS is a more pertinent approach to disentangle the complexity of polygenic conditions, such as AD response, where the mechanisms of action are not fully elucidated (Breen et al. 2016). This technique is ideal for studying the genetic component of non-mendelian conditions that are likely determined by a mixture of environmental and genetic determinants, mostly common and with small effect sizes.
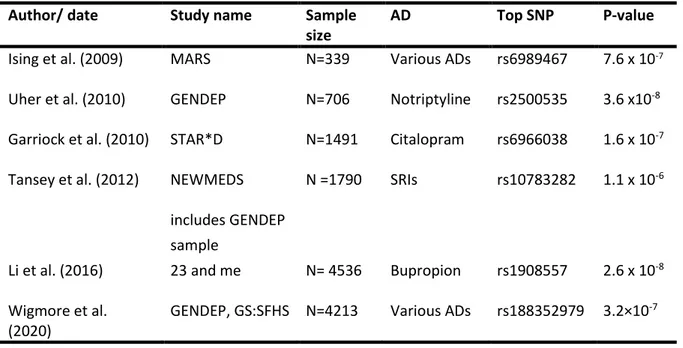
Data from three large trials have been often used in GWASs to detect genomic regions associated with AD response: the Sequence treatment alternative to relieve depression (STAR*D) study (n = 1948) (Garriock et al. 2010), the Genome-based Therapeutic Drugs for Depression (GENDEP) project (n = 706) (Uher et al. 2010), and the Munich Antidepressant Response Signature (MARS) project (n = 339) (Ising et al. 2009). When analyzed in isolation, none of these cohorts led to the identification of genome wide significance associations except for the GENDEP analysis of patient subset treated with Nortriptyline with a finding which achieved GWAS significance threshold as mentioned in the table 1.1. Even two large meta-GWASs of the above data were unable to identify genome-wide significant variants. In the first study, data from GENDEP, MARS, and the STAR*D were meta-analyzed for a total
13
of 2256 MDD cases (Uher et al. 2013). The second study was performed on 2897 MDD cases which included the data from NEWMEDS (Novel Methods Leading to New Medications in Depression and Schizophrenia) and STAR*D (Tansey et al. 2012). When the additional analysis in the first meta-analysis was restrained to citalopram and escitalopram, an intergenic variant rs10783282 in the chromosome region (5q.15.1) was identified. The largest GWAS on AD to date was performed using the clinical and genomic information of the 23 and me cohort. In this GWAS, Li et al compared 1311 treatment-resistant to 7795 responder patients and found no variants reaching the genome-wide significance threshold (P > 5 × 10⁻⁸). For another GWAS cohort of the same study of bupropion responders (n=2675) vs non-responders (n=1861), they found one variant rs1908557 in region (4q22.1) associated with bupropion response (Li et al. 2016) as mentioned in table 1.1. Recently, Wigmore and colleagues tested the association between genetic variants and AD resistance using prescription data in the population and family-based GENDEP cohort, and, however, failed to identify SNPs reaching genome-wide significance. The most significant SNP identified was an intergenic variant located at 10p26.13 (lead SNP rs188352979, P = 3.25 × 10⁻⁷, OR = 2.87, CI = 2.47–3.28) (Wigmore et al. 2020). The main GWAS on AD response are summarized in Table 1.1.
Table 1.1 Summary of published GWAS of antidepressant response.
Author/ date Study name Sample
size
AD Top SNP P-value
Ising et al. (2009) MARS N=339 Various ADs rs6989467 7.6 x 10⁻⁷ Uher et al. (2010) GENDEP N=706 Notriptyline rs2500535 3.6 x10⁻⁸ Garriock et al. (2010) STAR*D N=1491 Citalopram rs6966038 1.6 x 10⁻⁷ Tansey et al. (2012) NEWMEDS N =1790 SRIs rs10783282 1.1 x 10⁻⁶
includes GENDEP sample
Li et al. (2016) 23 and me N= 4536 Bupropion rs1908557 2.6 x 10⁻⁸ Wigmore et al.
(2020)
GENDEP, GS:SFHS N=4213 Various ADs rs188352979 3.2×10⁻⁷
While the candidate gene and GWAS approach have provided useful insights for studying various phenotypes, these techniques have not yet established replicated genetic variants relevant to the AD treatment response with clinical significance. Probably, one possible explanation is that these methods, focusing on single SNPs, and did not model the polygenic nature of AD response. For this
reason, scientists are exploring other analytical methods allowing the integration of multiple SNPs (Lin et al. 2018).
1.2.3 The polygenicity of AD response: the multi-marker approaches
In a polygenic disorder, a single variant is not informative for assessing the risk of disease. Hence individual’s genetic loading for a trait or a disease can be calculated using a statistical technique termed as ‘polygenic risk score’ (PRS). The PRS is a single value estimate of an individual’s genetic liability to a phenotype and this can be calculated as a sum of risk alleles carried by an individual, weighted by the corresponding allele effect sizes derived from GWAS summary statistics (Lewis and Vassos 2020).
The PRS analysis was tested for AD treatment response trait in GENDEP (n=736) and STAR*D cohort (n=1409), but no significant associations were found (García-González et al. 2017). Similarly, another study used PRS for MDD and neuroticism as predictors of antidepressant response within 3 treatment sub-cohorts from GENDEP and 2 sub-cohorts from the Pharmacogenomics Research Network Antidepressant Medication Pharmacogenomic Study (PGRN-AMPS). This study couldn’t significantly predict antidepressant response using PRS of MDD and neuroticism. However, the investigators reported that higher genetic loading for both phenotypes was associated with less favourable drug response (Ward et al. 2018). Moreover, previous studies have reported C-reactive protein (CRP) as a marker of inflammation and its association with antidepressant response. Zwicker et al analysed data from GENDEP studies and calculated PRS for CRP level-based genome-wide results from the Cohorts for Heart and Aging Research in Genomic Epidemiology (CHARGE) consortium. The researchers reported that a higher PRS for CRP protein was associated with a better response to escitalopram and worse response to amitriptyline (Zwicker et al. 2018)
1.2.4 Translating GWAS findings into effective therapeutics: moving from SNPs to
transcriptomic profiles
Previous studies have investigated possible approaches of translating GWAS findings into effective therapeutic options. Researchers studied whether, for example, top GWAS variants can serve as drug targets (Sanseau et al, 2012). There are a number of limitations of considering top GWAS variants only, as most of the time they lie in the non-coding region of the genome and do not encode for drug-targeted proteins. Moreover, there are chances of missing multitarget drugs. Based on PRS analysis, many complex traits are influenced by SNPs with small effect sizes, and prior studies have ignored
15
them and considered only the top significant genes for evaluating drug target proteins. Keeping in mind these limitations, imputing gene expression signatures from GWAS summary statistics may be a refined approach and can be used for comparing traits influenced by transcriptomic changes with drug-induced gene expression patterns. Analysis of in-vitro transcriptional profiles of drugs (from reference databases) and disease signatures (from GWAS studies) is already an established approach in the domain of drug repositioning. For instance, Sirota and colleagues found that cimetidine showed an opposite expression pattern to that associated with lung adenocarcinoma. Cimetidine causes genes that were highly expressed in lung adenocarcinoma to be lowly expressed and vice versa. Researchers experimentally validated this drug as a potential treatment (Sirota et al. 2011). Similarly, topiramate was found as a possible treatment for inflammatory bowel disease and this hypothesis was validated in an animal model (Dudley et al. 2011). So and his colleagues have proposed a drug repurposing strategy for various psychiatric disorders based on the GWAS summary statistics and imputed gene expression profiles corresponding to psychiatric traits. They found a number of repositioning candidates for psychiatric conditions while many of them were also supported by clinical and pre-clinical evidences (So et al. 2017).
2.
Statistical methods behind pharmacogenomics studies: GWAS,
PRS, and TWAS
2.1 Genome-Wide Association Studies (GWAS)
One of the major focus of human genetics is to identify genetic factors responsible for common and rare Mendelian diseases. Besides elucidating the complexity of common and rare diseases, GWAS has successful applications in the domain of pharmacogenetics and personalized medicine (Cooper et al. 2008). The purpose of GWAS is to scan genetic variants across genomes of many people to find those allelic variants or genotypes, which are associated with a disease or phenotype, that is those variants that are observed more frequently than expected by chance in subjects with the phenotype under study. After identifying causal variants, researchers can use this information to develop better methodologies to detect, treat, and prevent the disease. With the completion of the Human genome and International Hapmap projects, these sources of information can be used as important research tools for finding the genetic causes of diseases (Bush and Moore 2012). One of the first major successes of GWAS was the identification of the Complement factor H gene as a risk factor towards the onset of age-related macular generation (Haines and Hauser MA 2005).
In this section, the key steps for conducting GWAS, and the statistical tools for data analysis will be presented. As mentioned earlier, the primary goal of GWAS is to identify SNPs that are responsible for phenotypic variations of complex human traits. Using chip array technology, hundreds of thousands of SNPs are typed and tested across a large number of individuals to find their correlation with the phenotype of interest (O’dushlaine et al. 2015). Broadly, GWAS are developed following four main sequential steps: quality control (QC) of genotyped data, imputation, association testing and interpretation of results.
2.1.1 QC of genotyped and sample data
One of the first QC steps is generally represented by the removal of those variant sites with low calling rate in the analysed dataset. Broadly speaking, some of the mostly used indicators that are representative of data quality are missing call rate (MCR), minor allele frequency (MAF), and Hardy Weinberg equilibrium (HWE) (Pongpanich et al. 2010). Large deviations from HWE could indicate genotyping errors and SNPs with greater missingness rates reflects bad genotype probe performance. Since many calling algorithms perform poorly with minor alleles, therefore, SNPs with lower MAF are more prone to genotyping errors. To map those SNPs which are missed by the sequencing method can be imputed by considering external sources such as HapMap and 1000 genome projects (1000
17
Genome project consortium 2015) (1000 Genome project consortium 2005). The imputations of unmeasured SNPs are carried out by considering LD structure and haplotype frequencies. Association testing for both genotyped and imputed SNPs are performed separately because of the uncertainty involved in the imputation process. However, they can also be performed together possibly by taking into account uncertainties (e.g., dosages). Other indicators include sex discrepancy, heterozygosity, and relatedness among samples. Sex discrepancy indicates sample mix-ups and needs to be addressed during the QC step. X chromosome homozygosity estimate should be greater than 0.8 in males, whereas, in females, it should be less than 0.2. Further, it is important to remove individuals with high or low heterozygosity rates as it indicates sample contamination and inbreeding. Another important QC step is to check relatedness among individuals and to calculate identity by descent (IBD) of all sample pairs in the analysis. Individuals with relatedness above a certain threshold need to be removed as it will affect the results of the association analysis (Marees et al. 2018). However, there are also statistical association test which are robust in terms of relatedness across individuals used in GWAS such as SAIGE (Scalable and Accurate Implementation of Generalized mixed model) (Zhou et al. 2018)
2.1.2 Imputation of the data
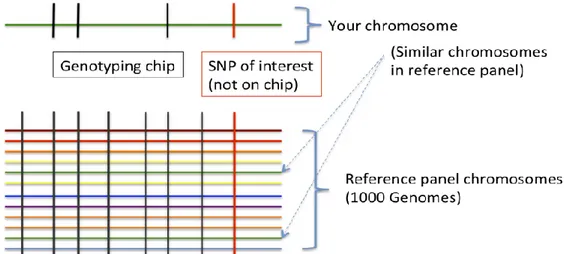
Imputation in genetics refers to the statistical inference of unobserved genotypes (Figure 2.1).
Figure 2.1 Imputation scheme. Imputation is achieved by using known haplotypes in a population, for instance from the HapMap or the 1000 Genomes Project in humans, thereby allowing to test initially-untyped genetic variants for association with a trait of interest. Genotype imputation hence helps tremendously in narrowing-down the location of probably causal variants in genome-wide association studies.
The number of markers in the association studies can be increased by performing the imputation process that infers the missing genotypes and harmonize the datasets for metanalysis used in association testing. The untyped markers in the sample of interest are imputed using the LD structure among the markers which are evaluated in an external reference panel with a dense genetic map (Porcu et al. 2013). For most of the GWASs, the HapMap reference panel has previously been used but now it has been replaced by a 1000 genome reference set with almost 39.7M biallelic variants (1000 Genome project consortium 2015). There are different software available for the genotype imputation such as Plink, Beagle, MaCH/minimac, fastPHASE and IMPUTE/IMPUTE2 (Browning and Browning 2008) (B. Howie et al. 2012) (Howie, Donnelly, and Marchini 2009) (Yun et al. 2009) (Purcell et al. 2007). All of them are based on various algorithms and offers different limitations and accuracy. For balancing the computational cost of large reference panels, the developers of IMPUTE2 and MaCH software introduced 2 steps procedure for carrying out imputation. In the first step, the genotypes of GWAS individuals are phased and their most likely haplotypes are estimated. Subsequently, in the next step, the genotypes of the reference panel are imputed into the phased genotypes of the GWAS sample (Fuchsberger, Abecasis, and Hinds 2015).
2.1.3 Association testing
After the QC and the imputation steps, the statistical analysis of genetic data is performed by testing each SNP for its independent association with the trait of interest. The single-locus statistical tests used are different depending on the quantitative or binary nature of the analysed traits.
The most common tests used to analyse binary traits are the chi-squared test and Fisher exact test, whereas ANOVA and t-test are applied to test the association of single SNP to quantitative variables. When potential confounding variables need to be controlled for, such as age, gender, medication, or population stratification, the generalized linear model (GLM) can be applied.
GLM is a commonly used family of statistical methods to relate several continuous and/or categorical predictors to a single outcome variable. Analysis of variance (ANOVA), which is similar to the linear regression method, is implemented for the analysis of continuous variables (Wang et al. 2019).
a) Linear Regression (GLM)
The assumptions made by GLM are, the residuals are normally distributed, each group has the same trait variance, and the groups are independent.
19
Given an input vector XT = (X1, X2, ……….... XP), a linear regression model can be expressed as:
𝒇(𝒙) = 𝜷𝒐+ ∑ 𝑿𝒋𝜷𝒋+ 𝜺𝒊 𝒑
𝒋=𝟏 (1)
with the error terms 𝜀𝑖~𝑁(0, 𝜎2).
The regression coefficients (βj) are estimated by minimizing the residual sum of squares (RSS) which is the sum of the squared difference between actual yi and predicted output variable f(x):
𝑹𝑺𝑺(𝜷) = ∑𝒏𝒊=𝟏(𝒚𝒊− 𝒇(𝒙𝒊))𝟐 (2)
= ∑ (𝒚𝒊− 𝜷𝒐− ∑𝒑𝒋=𝟏𝑿𝒊𝒋𝜷𝒋) 𝟐 𝒏
𝒊=𝟏 (3)
In a linear regression model, the β values are acquired using maximum likelihood estimation which gives the parameter values that maximize the likelihood of observing the outcome variable y. In practice, t statistics and type III f-tests are used to check the significance of parameter estimates.
When potential confounding variables such as age, sex, and medication need to be controlled for, the extended form of GLM can be written as:
𝒈(µ) = ∑ 𝜷𝒋 𝒋𝑿𝒋+ 𝒖𝑮 +∑ 𝒀𝒌 𝒌𝑷𝑪𝒌 (4)
where μ= E(Y); the g() is the link function that performs a monotone transformation on the mean of the response variable, Xj is the jth covariate representing a clinical or environmental risk factor, βj is the regression coefficient of Xj, G is the genotype of the test SNP with coefficient u, PCk is the kth top principal component calculated from the genotype matrix, and Yk is the effect of PCk. If phenotype Y is a binary variable, then a logit link function can be applied and the GLM reduces to logistic regression (Wang, Cordell, and Van Steen 2019).
b. Logistic Regression
Binary or dichotomous trait data are analysed using contingency tables or logistic regression methods. Logistic regression is an extension of linear regression in which the linear model is transformed using a logistic function. This prediction method is suitable for categorical output variables and calculates the probability of binomial traits, hence performs classification (Peng, Lee, and Ingersoll 2002).
For a binary outcome with two output possibilities A and B, the log odds of class A, as opposed to class B, can be modelled by the following expression:
𝐥𝐨𝐠 (𝑷 (𝒚𝒊 = 𝑨|𝒙𝒊𝟏, 𝒙𝒊𝟐, … , 𝒙𝒊𝒑)
𝑷 (𝒚𝒊= 𝑩|𝒙𝒊𝟏, 𝒙𝒊𝟐, … , 𝒙𝒊𝒑)) = 𝜷𝑶+ 𝜷𝟏𝒙𝒊𝟏+ ⋯ + 𝜷𝒑𝒙𝒊𝒑 (5)
As 𝑃 (𝑦𝑖 = 𝐵|𝑥𝑖1, 𝑥𝑖2, … , 𝑥𝑖𝑝) is 1 − 𝑃 (𝑦𝑖 = 𝐴|𝑥𝑖1, 𝑥𝑖2, … , 𝑥𝑖𝑝), the probability of outcome categorized into class A is given by:
𝑷 (𝒚𝒊 = 𝑨|𝒙𝒊𝟏, 𝒙𝒊𝟐, … , 𝒙𝒊𝒑) =
𝒆𝜷𝒐+𝜷𝟏𝒙𝒊𝟏+⋯+𝜷𝒑 𝒙𝒊𝒑
𝟏+𝒆𝜷𝒐+𝜷𝟏𝒙𝒊𝟏+⋯+𝜷𝒑 𝒙𝒊𝒑 (6)
The above equation shows that the model outputs probabilities in the range between 0 and 1. Due to the linear effects of predictor variables on the outcome function, logistic regression models can be categorized into the class of GLMs.
Results obtained after conducting GWAS are represented in a tabular format known as summary statistics. Summary statistics include for each analysed SNPs: information on chromosome position, SNP identifier, MAF, effect size (odds ratio/beta), standard error, and p-value. Summary statistics files are available for different phenotypes and are made public and stored in dedicated databases. The most famous repository of GWAS summary statistics is the GWAS catalogue maintained by the European Bioinformatics Institute (https://www.ebi.ac.uk/gwas/)
2.1.4 Interpretation of GWAS results
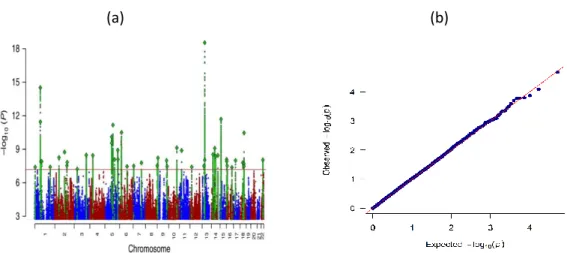
Association testing will generate a test statistic for each SNP, measuring its association with the trait being studied and a p-value reflective of statistical significance. Manhattan and quantile-quantile (QQ) plots (Fig. 2.2) are standard graphical tools for visualizing GWAS results (Jiang and Wang 2018). A Manhattan plot is a scatter plot that displays the level of significance of each SNP based on its chromosomal location, displayed on the x-axis. On the y axis, the negative log-base-10 of the p-value for each of the SNP being tested is presented. This way, stronger association signals are characterized by higher values on the graph and are visible at the top. Another widely used plot for the graphical representation of GWAS results is a QQ plot, in which the x-axis displays the expected distribution of association test statistics under the null hypothesis of no association across millions of SNPs. The expected p-values are compared with the observed p-values which are along the y-axis of the plot.
21
Practically, the majority of SNPs won’t be associated with the trait analysed and, therefore, a large number of p-values will lie on the diagonal. A small deflection of observed p-values from the null hypothesis line at the end represents the true associations among thousands of SNPs not associated with the trait (Fig. 2.2 b) (Jiang and Wang 2018). Genomic inflation factor λ is used to quantify if the genetic signal is inflated or not. λ is defined as the median of the resulting chi-squared test statistics divided by the expected median of the chi-squared distribution. It can be calculated from z-scores, chi square statistics or p-values.
(a) (b)
Fig 2.2. (a) Manhattan plot from the meta-analysis of 135,458 MDD cases and 399,401 controls (Wray et al. 2018). (b) QQ-plot from GWAS comparing STAR*D first stage participants (citalopram remitters
and non-remitters).
a. The problem of multiple test corrections
The null hypothesis is rejected, and a statistical test is considered significant if the p-value is lower than the predefined threshold α = 0.05. This implies that 5% of the time, the null hypothesis is rejected even if is true. This probability test is applicable to the single statistical test. As we usually consider millions of SNPs in GWAS that is why the aggregated likelihood of getting false positives is much higher (Jiang and Wang 2018).
One of the simplest methods to overcome the issue of multiple testing is the ‘Bonferroni correction’ method which adjusts the value of α from 0.05 to α/k where k is the number of statistical tests conducted (Hochberg 1988). The Bonferroni correction at level 0.05 yields the significance threshold 5 × 10⁻⁸, known as the ‘genome-wide significance level’. This test is conservative as it assumes all SNPs are independent of each other and does not consider linkage disequilibrium among GWAS markers.
Alternative methods to solve the issue of multiple testing are ‘False discovery rate (FDR)’ and ‘Permutation procedure’.
The FDR test developed by Benjamini and Hochberg determines the false positives among the tests declared as significant, hence, produces fewer false positives (Benjamani and Hochberg 2016). The permutation procedure is another approach for controlling false positives. This method is computationally intensive but straightforward. It generates an empirical null distribution of test statistics by shuffling the genotype-phenotype relationship of each individual in a dataset and this process is repeated for a predefined number of times to approximate false discovery rate (Martin, Westfall, and Young 1994).
2.2 Polygenic Risk Score Analysis
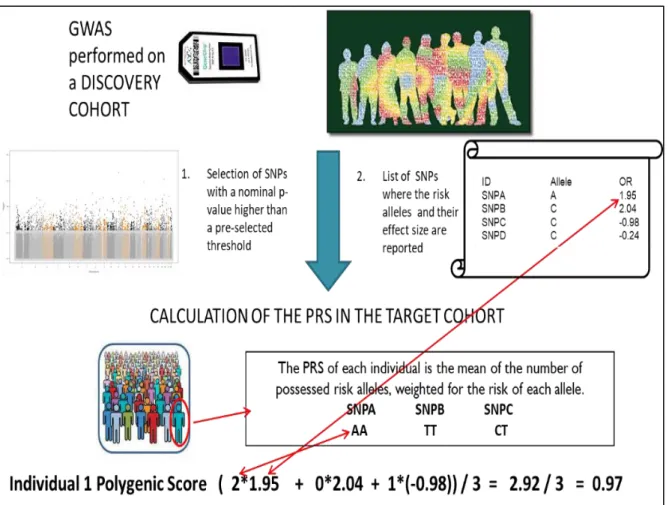
GWAS of a disease tests one SNP at a time, thus, explains a small fraction of disease heritability (Wray et al. 2014). In Common diseases with a polygenic architecture, many genetic variants with small effect sizes act together to increase the risk of a disorder. For this reason, statistical methods (such as polygenic score risk analysis) that analyse the joint effect of many SNPs have been developed. The goal of PRS is to consider thousands of SNPs that could not achieve the GWAS significance threshold but may have a possible role in the disease etiology and may account for the greater amount of heritability. The PRS method utilizes association statistics from discovery GWAS and, after SNPs pruning based on the LD structure and weighing them according to their effect sizes, PRS tests the combined predictive ability in an independent sample (Figure 2.3). P-value informed clumping method is used in LD pruning in which SNPs with the strongest evidence of association within the LD window are retained while the rest of them are discarded.
23
Figure 2.3. To calculate the PRS we need two cohorts: a discovery cohort where we identify the risk alleles and their effect size and a target cohort where the PRS is effectively calculated. In the discovery cohort after performing GWAS, we obtain a list of SNPs with a p-value. The SNPs are ranked according to their p-value in ascending order, and only risk alleles with a p-value higher than a pre-selected threshold will be selected. We obtain in this way a list of risk SNPs with the risk allele and its effect size. This information will be used to calculate the PRS in the target cohort. For each individual, the PRS is calculated as the mean number of risk alleles weighted for the risk of each allele.
For conducting PRS analysis, trait-specific weights (log of the odds ratios for binary traits and beta values for continuous traits) are acquired from a discovery GWAS (Marees et al. 2018). The genotype of individuals in an independent validation sample is weighted based on allele effect sizes from the discovery GWAS. Further, these effects are summed across multiple SNPs and represent a PRS value. PRS in the form of the equation can be given as:
𝑃𝑅𝑆𝑗= ∑𝑚𝑗=1𝑋𝑗𝛽𝑗 (7)
Where each individual’s score, 𝑃𝑅𝑆𝑗, is calculated by the sum of an individual’s risk alleles 𝑋𝑗 weighted by risk alleles effect sizes, 𝛽𝑗, derived from GWAS summary statistics across 𝑚 SNPs.
All common SNPs can be used in PRS analysis, but it is important to first clump the SNPs from GWAS results before calculating the risk scores. Theoretically, for a polygenic trait all SNPs are informative. P-value thresholding is done because the best fitting model can be more oligogenic or more polygenic and this is not known in advance. Basically, a model optimization is performed. It is a common practice among researchers to perform multiple PRS analyses each accounting for varying p-value thresholds. The PRS is tested for association with a disease or control status using the logistic regression method by considering principal components as covariates. The prediction accuracy of PRS in the target sample is given in terms of pseudo R2 for logistic regression (Marees et al. 2018).
The widely used software package for performing PRS analysis is PRS-ice (Euesden, Lewis, and O’Reilly 2015) as it has built-in options for clumping, p-value thresholds, principal components consideration, and plotting of attractive graphs. There are also other methods and tools available for computing PRS. For example lasso regression (LASSOSUM) and Bayesian approaches (LDPred) (Kulm, Mezey, and Elemento 2020)
2.3 Transcriptome-wide association study (TWAS)
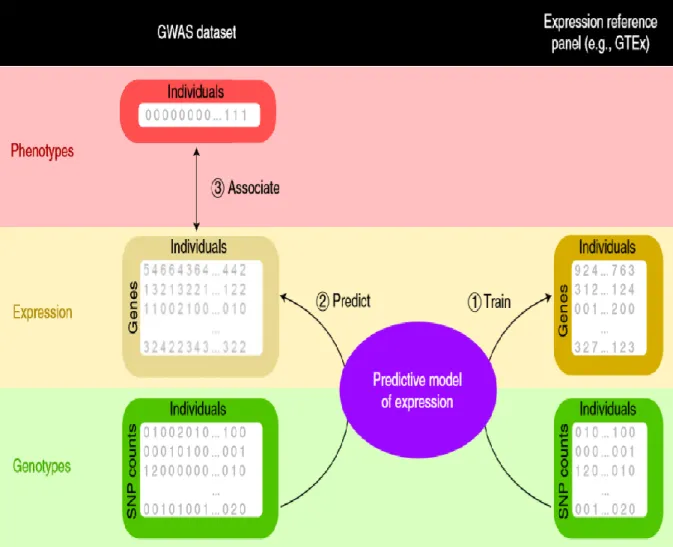
One possible mechanism that a genetic variant may influence the associated trait is through regulating the gene expression of its neighbour genes. A method developed to investigate such a potential mechanism is the transcriptome-wide association study (TWAS). In these studies, rather than directly testing SNPs for association with phenotype, the SNPs are used to predict gene expression levels, and the predicted gene expression measures are then tested for association with the phenotype.
TWAS utilizes reference panels, such as the Genotype tissue expression portal (GTEx) datasets (GTEx Consortium 2013), where both SNP genotypes and gene expression profiles have been measured in a variety of relevant tissues to develop prediction models for gene expression. These matrices are then used to impute the expression profile of a target dataset based only on genotype information. In the final step, statistical associations between genetic variants and the trait under investigation are estimated. The three main steps of TWAS are depicted in Figure 2.4 and described below.
25
Figure 2.4. Three major steps of TWAS. (1) Training of predictive models using GTEx data. (2) Implementation of models to the GWAS cohort (3) Establishing the association between predicted expression and trait using statistical methods (Wainberg et al. 2019).
(1) Training of predictive models using GTEx data
In the first step, predictive models are trained in reference panels (e.g. GTEx data) using SNP and gene expression information. The learning of models is based on the expression variation for each gene using allele counts of genetic variants in the vicinity of the gene (typically 500 kb or 1 MB around the gene). Subsequently, these models estimate weights based on the correlation between SNPs and gene expression values in the training data while accounting for linkage disequilibrium (LD) among SNPs. In S-PrediXcan (Barbeira et al. 2018) the models were trained using the elastic net approach and the authors of this software have deposited the weights and SNP covariances in a publicly available resource (http://predictdb.org/)
(2) Application of TWAS models to the GWAS cohort and association testing
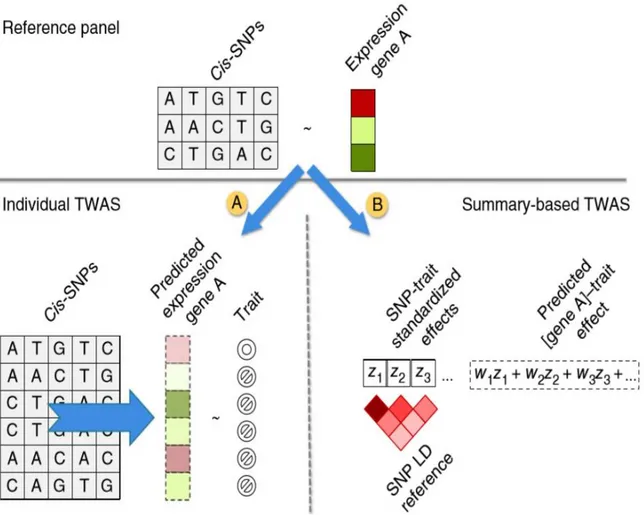
After estimating the effect sizes of genetic variants relative to their impact on gene expression levels in the reference panel, there can be two different ways in which a TWAS is performed to predict gene expression in target samples. One possible route is to predict gene expression at the individual level using effect sizes of cis-SNPs in the reference panel and measuring the association between the predicted gene expression and a trait. Individual-level prediction can be performed using the PrediXcan software (Barbeira et al. 2018). The gene expression value can be predicted using equation 7, where Tg is the gene expression level, wlg is the weight of SNP l responsible for the expression of gene g, calculated by a trained model and Xl is the individual SNP dosage. The regression coefficients of phenotype Y on each gene’s predicted expression can be calculated using equation 8:
𝑻𝒈 = ∑𝒍 𝜺 𝒎𝒐𝒅𝒆𝒍 𝒈 𝑾𝒍𝒈𝑿𝒍 (7)
𝒀 = 𝑻𝒈𝜸 + 𝜺 (8)
Another route involves the estimation of the association between the predicted gene expression levels and a trait, by employing a weighted linear combination of SNP-trait standardized effect sizes (z-scores) and LD between SNPs (Figure 2.5). Fusion and S-PrediXcan software predict gene expression profiles for a group of individuals using GWAS summary statistics as an input file (Gusev et al. 2016)(Barbeira et al. 2018). The expression z-score Zg of a gene can be calculated using equation 9, 𝒁𝒈 = ∑𝒍 Ɛ 𝒎𝒐𝒅𝒆𝒍 𝒈𝒘𝒍𝒈
𝝈𝒍 𝝈𝒈
𝜷𝒍
𝑺𝑬(𝜷𝒍) (9)
The βl term represents the regression coefficients of the SNPs in the regression model built on the GWAS data, with the phenotype/trait as dependent variable. The weights of SNPs Wlg and variance
ratio σl/σg can be estimated from the training data sets by the software. As mentioned previously, the training set can be any reference transcriptomic dataset (1000 Genomes or GTEx data) where the prediction models are trained using the elastic-net method (Barbeira et al. 2018).
27
Fig 2.5. Two possible approaches for carrying out TWAS for imputing gene expression in target individuals (Gusev et al. 2016).
There are several advantages of the individual TWAS technique compared to traditional GWAS and expression studies (So et al. 2017).
(a) An advantage of transcriptomic-wide association studies is that the number of genes to test is generally much lower than the number of SNPs measured in a GWAS, making multiple testing correction less impactful on the raw results.
(b) TWAS sample sizes are usually significantly larger than those used in conventional expression studies and summary statistics are easily accessible for a number of traits.
(c) The expression profiles can be imputed for different tissues which can help to comprehend biological mechanisms at the tissue level.
There are also some disadvantages related to the TWAS method (Wainberg et al. 2019)
a) Only a small proportion of the heritability explained by SNPs can be attributed to gene expression regulation. Thus, with TWAS a significant part of the genetic signal available
with GWAS is removed.
(https://opain.github.io/GenoPred/Functionally_informed_prediction.html)
b) Genes whose expression is mainly driven by environmental factor are not considered in TWAS.
c) The model prediction accuracy might be affected by the sample size used for training the models in the tissue/cell.
d) eQTL could be also context-specific, that is their effect over gene expression might be due to gene-environment interactions and using TWAS model trained on reference tissue cannot detect these effects. This could be an advantage as pointed out (e.g., no confounding effect of treatment) but also a limitation (a disease could also lead to biological changes with specific eQTL regulation, e.g., inflammation related effects).
29
3. The Connectivity Map and its applications in pharmacogenomics.
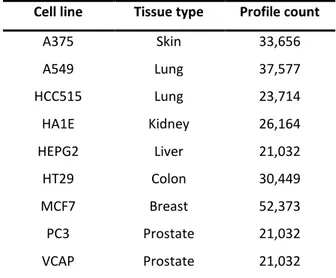
The Connectivity Map (CMap) (Lamb et al. 2006) is a publicly available comprehensive library of transcriptional expression data that can be used to analyze relationships between drugs, cellular physiology, and disease states. For developing CMap database, researchers used the gene expression profiling method which is low cost and highly reproducible as compared to gene expression microarrays and RNA sequencing techniques. The most recent version of CMap has entered into the second phase of implementation as part of NIH’s Library of Integrated Network-Based Cellular Signatures (LINCS) program (Subramanian et al. 2017). The current version of LINCS (also known as LINCS-L1000)contains 591,697 expression profiles generated from 29,668 compounds and genetic modifications (collectively known as ‘perturbagens’) across 98 different cell lines (N. Lim and Pavlidis 2019). Cell lines with the highest number of profiles are listed in Table 3.1. The CMap dataset consists of comparative data from human cells that treated with perturbagens and untreated cells (corresponding vehicle controls) representing a useful resource to identify differentially expressed genes (DEGs) in terms of z-scores. The CMap data can be downloaded from the CLUE Data Library (https://clue.io/data) or from the Gene Expression Omnibus repository (accession number GSE92742).Table 3.1. Cell lines with the highest number of profiles in the LINCS CMap database.
Cell line Tissue type Profile count A375 Skin 33,656 A549 Lung 37,577 HCC515 Lung 23,714 HA1E Kidney 26,164 HEPG2 Liver 21,032 HT29 Colon 30,449 MCF7 Breast 52,373 PC3 Prostate 21,032 VCAP Prostate 21,032 Note. Table adapted from (Musa, Tripathi, et al. 2018)
3.1 Major components of the CMap analysis pipeline
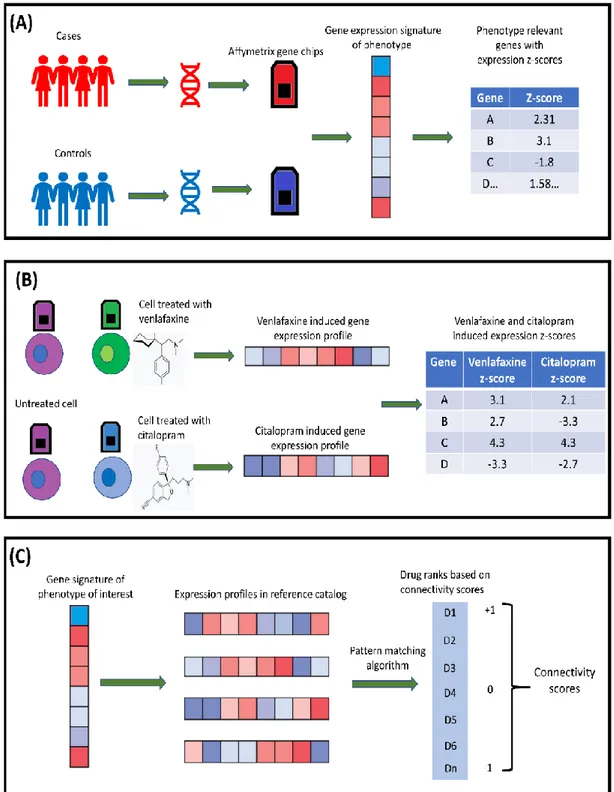
In brief, the analysis pipeline of CMap is comprised of three steps, described in following paragraphs. (1) Gene expression signature of the biological state of interest
In the first step, a list of differentially expressed genes ranked on the basis of their z-score is obtained by comparing gene expression profiles of cases and controls (Fig 3.1A). This list will define the gene expression signature of the trait and will be used as an input query to the reference database. Depending on the nature of the study, the gene expression profile can be derived from human subjects or animal models of diseases. Alternatively, the expression profile can be suggested by disease experts who are able to identify the directionality of expression of specific genes corresponding to disease (Fig 3.1A). Defining a query signature is an essential requirement for CMap analysis. There is no ‘gold standard’ for generating expression profiles of the phenotype of interest and they can be obtained through traditional RNA sequencing methods or bioinformatics approaches based on genome-wide association data (Musa, Ghoraie, et al. 2018).
(2) Reference database
The gene expression signature representing a biological state is given as a query to CMap, which comprises gene expression profiles obtained from the treatment of cultured human cell lines with a large number of perturbagens (see above) (Lamb et al. 2006) (Fig 3.1B). Briefly, by comparing the expression profiles of each cell line before and after the treatment with the perturbagens is possible to know how these perturbagens modulate gene expression and to obtain the expression signature (reference profiles) of each perturbagen in each cell line.
(3) Pattern matching algorithm (gene set enrichment analysis)
Finally, a pattern-matching algorithm is used to compare the gene expression profile of the trait of interest to gene expression profiles included in the reference database and to obtain for each comparison a connectivity score. Connectivity scores are a measure of the similarity between the expression profile of the trait under analysis and the expression profiles included in the CMap database.
The connectivity scores are calculated by means of a gene set enrichment analysis (GSEA, described in the following paragraph), based on Kolmogorov-Smirnov statistics (Lamb et al. 2006) (Fig 3.1C).
31
3.2 Gene Set Enrichment Analysis (GSEA) to estimate connectivity scores.
In the CMap pipeline, the goal of GSEA is to determine whether the genes of a given query signature are randomly distributed in the reference signature gene list or primarily located at the extremes (top or bottom). The resulting connectivity score is calculated by walking down the reference signature gene list increasing a running sum statistics when a gene available in query is encountered in the reference list and decreasing it when the gene of query signature is not present in the reference gene list. The connectivity score corresponds to the weighted Kolmogorov-Smirnov statistics. The magnitude of increment depends on the correlation of profile with the phenotype of interest (z-scores) (Subramanian et al. 2005). The significance value of the calculated score is obtained through the permutation procedure. The values of connectivity scores range between +1 and -1. A positive connectivity score represents a positive correlation, and a negative connectivity score represents a negative correlation between the query signature and drug profiles in the reference database. A null connectivity score occurs when there is no correlation between the query profile and the profiles in the reference catalog (Lamb et al. 2006).Fig 3.1. Overview of CMap concept. (A) Generating the expression signature of the biological state of interest. (B) Mechanism of drug profiles obtained by treating various cell types with perturbagens for CMap database. (C) Major steps of CMap analysis.
33
3.3 Application of CMap in pharmacogenomics
The CMap database has been used in Pharmacogenomics since its introduction in 2006. The concept of CMap has been used in the identification of new therapeutic options for the treatment of several diseases. Moreover, multiple studies adopted this approach to evaluate the drugs’ mechanisms of action (MoA) and to find new implications of already existing, approved drugs (drug repurposing).
3.3.1 Finding novel therapeutic options
The most important application of the CMap database is the discovery of novel treatment options for diseases. In a recent study by Lim et al, a gastric cancer gene signature was used to query CMap (S. M. Lim, Lim, and Cho 2014). The authors of the study found vorinostat and trichostatin A as potential candidates for treating gastric cancer. These findings were validated in experimental settings where vorinostat significantly inhibited cell viability in gastric cancer cell lines. Another study conducted by Siu et al mentioned polyphyllin D as a therapeutic option for non-small cell lung cancer (Siu et al. 2008). This study demonstrated that polyphyllin D can activate the pathways involved in the apoptosis mediated by the estrogen receptor and mitochondria.
3.3.2 Evaluating a drug’s mechanism of action
In pharmacology, studying the exact impact of a drug on the biological systems is important to understand its mechanism of action and it is also crucial to identify new compounds that are active towards specific targets. With the help of CMap, it is possible to identify signalling pathways affected by a drug, which can further help us to comprehend the biology of drug-disease relations. CMap was used to construct a drug network (DN) based on a distance metric with the ability to score the similarity between gene expression profiles and drug treatment (Iorio et al. 2010). The investigators used the graph theory to partition the DN to identify the drugs that were highly interconnected, hence, they have similar MoA and therapeutic purposes. Notably, the study by Iorio et al also found that the MoA of fasudil, a Rho-kinase inhibitor, was highly interconnected with autophagy. The drug, previously used in the treatment of cerebral vasospasm, was experimentally validated and its usage as a repurposed drug was confirmed for other disease.
3.3.3 Drug repurposing
Conventional drug development is a time-consuming process and involves high costs. CMap has been used extensively in the domain of drug repurposing. For instance, Johnstone and his colleagues suggested a possible mechansim of calmodulin signaling using piperazine as promoters of central nervous system (CNS) neurite growth (Johnstone et al. 2012). Moreover, using a CMap-based approach, they found that piperazine and phenothiazine, two antipsychotics, have the potential to be repurposed for neuron regeneration. Similarly, using CMap, Jin and colleagues presented a novel drug repurposing strategy for treating type II diabetes (Jin et al. 2014). They reported that the combination of Trolox C and Cytisine is effective for the treatment of type 2 diabetes, but if these drugs are used separately, neither of them helps in achieving the desired outcome.
35
4. Project aims and outline of the thesis
The main purpose of this thesis work was to investigate computational methods contributing to precision psychiatry. Previous studies have focused on the identification of genetic variants associated with AD efficacy (Uher et al. 2013) (Wigmore et al. 2020), and here we expand the focus to transcriptomic profiles derived from TWAS using data from eQTL studies. The Ph.D. project described here can be divided into two major studies. In the first study, we developed and tested an in-silico approach aiming at the identification of the gene expression profile associated with remission in MDD following citalopram treatment in the STAR*D study, and comparing this profile with various AD-induced (including citalopram-AD-induced) transcriptional profiles available in the CMap database. In the second study, we developed polygenic models using supervised learning algorithms based on the genetic associations of the individual profile of STAR*D subjects and in-vitro antidepressant profiles from CMap for the prediction of AD response.
The two aforementioned studies described in this thesis were developed along the following steps: First study
1. After classifying STAR*D participants as remitters or non-remitters to citalopram, a GWAS was conducted to test the association of SNPs with remission from MDD
2. From the GWAS summary statistics data, a TWAS was performed (using the FUSION software) to identify the gene expression profile corresponding to remission in MDD in STAR*D individuals
3. We extrapolated and processed various AD-induced expression profiles across several human cell lines from the CMap database
4. Finally, we ranked ADs based on the likelihood of efficacy by comparing their associated expression profiles to the one induced by the treatment with citalopram and associated with remission in MDD.
Second study
1. Individual expression profiles were imputed in STAR*D first stage individuals (citalopram remitter and non-remitters) using the Predixcan tool.
2. Development of polygenic models using supervised learning approach to predict citalopram remission based on the genetic associations of individual genetic profiles and in-vitro drug expression profiles.
37
5. Investigating an in-silico approach for prioritizing antidepressant
drug prescription based on drug-induced expression profiles and
predicted gene expression
5.1 Introduction
Antidepressant (AD) prescription is currently based on international guidelines, previous clinical experience, and the presence of co-morbidities, but is largely a ‘trial and error’ practice (Leuchter et al. 2010). SSRIs represent the most common AD class currently used for treating MDD with, however, a highly variable response to SSRI treatment between patients (Biernacka et al. 2015). Any attempt to achieve symptom remission by switching between treatment or combining multiple pharmacotherapies can take weeks to be fully evaluated in terms of clinical effectiveness.
The availability of objective and reproducible predictors of AD response could reduce the time needed to perform such evaluation, and, in turn, to achieve remission and relieve patients’ suffering (Leuchter et al. 2010). Prior studies suggest that AD response and remission are heritable traits (Tansey et al. 2013b), offering the opportunity to use genetic markers in the attempt to predict optimal drug prescription. In light of these observations, the development of strategies taking into account various factors related to the clinical presentation, the patient’s genotype and their metabolism at baseline has been warranted (Gandal et al. 2016).
In this rapidly evolving context, the purpose of the work presented here was to develop a new approach aiming to contribute to precision psychiatry precisely by providing effective ways to predict patients’ response to therapeutic agents. As previously mentioned, several studies published in the last decade have focused on the identification of genetic variants predictive of AD efficacy (Uher et al. 2013)(Wigmore et al. 2020), and here we applied TWAS concept to obtain gene expression profiles using GWAS summary statistics. Transcriptomic profiles associated with the efficacy of specific ADs in clinical trials can be compared with the in vitro AD-induced gene expression changes, in order to test if drug-induced gene expression signatures could be used as markers of clinical efficacy of specific ADs. The main aim of this study was to develop and test this approach by computing gene expression profile associated with remission to citalopram in the STAR*D study and comparing this profile with citalopram and other ADs induced transcriptional responses available from the Connectivity Map (CMap) database. CMap is a genome-scale library of cellular signatures and a catalogue of transcriptional responses to chemical and genetic perturbations (Lamb et al. 2006). A positive correlation between expression profiles of citalopram remission and in vitro citalopram induced gene