Cyanobacteria Proliferation in the Cenomanian
‐Turonian
Boundary Interval of the Apennine Carbonate Platform:
Immediate Response to the Environmental
Perturbations Associated With OAE
‐2?
G. Frijia1 , R. Forkner2, D. Minisini3,4, M. Pacton5, U. Struck6 , and M. Mutti7
1Dipartimento di Fisica e Scienze della Terra, Università di Ferrara, Ferrara, Italy,2Statoil, Austin, TX, USA,3Shell
Technology Center, Houston, TX, USA,4Department of Earth, Environmental and Planetary Sciences, Rice University,
Houston, TX, USA,5Geological Institute, ETH Zurich, Zurich, Switzerland,6Museum für Naturkunde, Berlin, Germany,
7Institut für Geowissenschaften, Universität Potsdam, Potsdam, Germany
Abstract
Oceanic Anoxic Event‐2 (OAE‐2; Cenomanian‐Turonian) is characterized by extensive deposition of organic carbon‐rich deposits (black shales) in ocean basins worldwide as result of a major perturbation of the global carbon cycle. While the sedimentological, geochemical, and paleontological aspects of deep water expressions of OAE‐2 have been intensively studied in the last few decades, much less attention has been given to the coeval shallow water deposits. In this study, we present the results of a detailed facies and petrographic (optical microscope and scanning electron microscopy) and geochemical studies (δ13Ccarb,δ13C org,δ15Nbulk, TOC, and Rock‐Eval pyrolysis) on two key shallow marine sections from the Apennine Carbonate Platform (ACP; Italy). Here a continuous record of shallow water carbonates through the OAE‐2 interval is preserved, offering the unique opportunity to document the archive of paleoenvironmental changes in a neritic setting, at a tropical latitude and far from the influence of a large continental block. Two conspicuous intervals are characterized by abundant and closely spaced“dark” microbial laminites found at correlative stratigraphic horizons in the two stratigraphic sections. These laminites contain elevated concentrations of TOC (up to 1%) relative to microbial capping cycles laminites stratigraphically above and below. The organic matter preserved in thesefine‐grained laminites is dominated by cyanobacteria remains, which accounted for most of the organic matter produced on the ACP in these intervals. Our study suggests that Tethyan carbonate platforms experienced significant biological changes during OAE‐2, alternating, in few kiloyears, between eutrophic phases dominated by microbial communities and mesotrophic/oligotrophic conditions favoring“normal” carbonate production/sedimentation. The synchronous occurrence of microbialite facies at different locations across the ACP and on other platforms worldwide (e.g., Mexico and Croatia) suggests a causal link between Large Igneous Province volcanism and the environmental conditions necessary to trigger cyanobacterial proliferation on shallow carbonate platforms.1. Introduction
Oceanic Anoxic Event‐2 (OAE‐2), encompassing the Cenomanian/Turonian boundary, represented a major short‐term perturbation to the global carbon cycle (<1 Myr), with extensive deposition of organic carbon‐rich deposits in ocean basins worldwide. This perturbation is reflected globally by a positive excursion in δ13C (2‰ to 4‰) in both marine and terrestrial organic and inorganic carbon (e.g., Hasegawa, 1997; Jarvis et al., 2011; Jenkyns, 2010; Schlanger & Jenkyns, 1976; Scholle & Arthur, 1980; Tsikos et al., 2004). Large emissions of CO2were released during this time due to intense volcanic activity associated with the emplacement of Large Igneous Provinces (LIPs; Caribbean and High Arctic LIPs). These periods of enhanced eruptive activity have been invoked as the possible trigger of OAE‐2 (Du Vivier et al., 2014, 2015; Flögel et al., 2011; Jenkyns et al., 2017; Jones & Jenkyns, 2001; Kuroda et al., 2007; Meyers, 2014; Schaife et al., 2017; Schroder‐Adams et al., 2019; Snow et al., 2005; Tegner et al., 2011; Turgeon & Creaser, 2008). Following, the CO2 emitted to the atmosphere would have increased temperature and precipitation extremes (Heimhofer et al., 2018; Van Helmond et al., 2014; Wagner et al., 2013). This would have enhanced terrestrial weathering rates, leading to an increase in the quantity of nutrients delivered to the oceans, which fueled primary productivity (Du Vivier et al., 2015; Flögel et al., 2011; Jenkyns, 2003, 2010; Jenkyns et al., 2017; Leckie et al., 2002; Owens et al., 2013; Pogge von
©2019. American Geophysical Union. All Rights Reserved.
RESEARCH ARTICLE
10.1029/2019GC008306
Key Points:
• A detailed geochemical and petrographic study of the evolution of the Apennine Carbonate Platform (S‐Italy) during the OAE‐2 is presented
• Two laminated intervals, dominated by cyanobacteria remains, were deposited during OAE‐2 • Cyanobacteria proliferation during
the OAE‐2 is coeval with CO2and
nutrient increase Supporting Information: • Supporting Information S1 • Table S1 Correspondence to: G. Frijia, [email protected] Citation:
Frijia, G., Forkner, R., Minisini, D., Pacton, M., Struck, U., & Mutti, M. (2019). Cyanobacteria proliferation in the Cenomanian‐Turonian boundary interval of the Apennine Carbonate Platform: Immediate response to the environmental perturbations associated with OAE‐2? Geochemistry, Geophysics, Geosystems, 20, 2698–2716. https://doi. org/10.1029/2019GC008306
Received 1 MAR 2019 Accepted 8 MAY 2019
Accepted article online 16 MAY 2019 Published online 13 JUN 2019
Strandmann et al., 2013; Poulton et al., 2015; Sweere et al., 2018; Thomas & Tilghman, 2014; Van Helmond et al., 2014). Primary productivity might also have been stimulated by the release of large quantities of hydro-thermal iron and other micronutrients due to submarine volcanogenic activity (Adams et al., 2010), by enhanced nitrogenfixation (Junium & Arthur, 2007; Ruvalcaba Baroni et al., 2015), or by phosphorus regen-eration from organic‐rich sediments (Monteiro et al., 2012; Mort et al., 2007; Ruvalcaba Baroni et al., 2014). Phototrophs such as N‐fixing cyanobacteria may have been a major primary producer of organic material under such conditions (Higgins et al., 2012; Owens et al., 2016) and likely contributed a large proportion of organic material during black shale deposition (Kuypers et al., 2004; Ohkouchi et al., 2015). However, evi-dences of this is yet indirect, supported by the abundance of specific biomarkers for cyanobacteria and δ15N signature in OAE‐2 deep water sediments (e.g., Kuypers et al., 2004). Comparatively little is known about OAE‐2 dynamics in the shallow marine system and if photoautotrophs like cyanobacteria proliferated dur-ing the event.
This represents an important gap in our understanding of ecological responses to abrupt climatic change in the early Late Cretaceous, given that most of the global ocean bioproductivity (and the greatest ecological diversity) today takes place on shallow shelves and basins (Yool & Fashman, 2001, and references therein). Furthermore, the transfer of CO2from the atmosphere to the ocean takes place by diffusion into shallow water masses, a phenomenon observed for more recent climatic episodes such as the Paleocene‐Eocene Thermal Maximum (Zachos et al., 2007). This process would leave shallow marine carbonate‐dominated environments highly susceptible to ocean acidification and sudden warming. The environmental record of OAE‐linked processes within shallow marine settings is therefore critical for a complete understanding of the impact of OAEs on the Earth System.
Most known carbonate platforms experienced a severe biocalcification crisis coeval with OAE‐2, with shal-low water deposits abruptly overlain by facies containing calcispheres and planktic foraminifera, which is an evidence of the demise and eventual drowing of the platform system (e.g., Caus et al., 1997; Jenkyns, 1991; Korbar et al., 2012). Only a few localities preserve a record of nearly continuous carbonate platform growth across OAE‐2 (e.g., Apennine Carbonate Platform [ACP]; Parente et al., 2007, 2008; Frijia & Parente, 2008; Mexico Platform, Elrick et al., 2009), and their study is of key importance to obtain a continuous signal of the response of these settings and communities to the palaeoenvironmental perturbations accompanying the onset and the evolution of the OAE‐2.
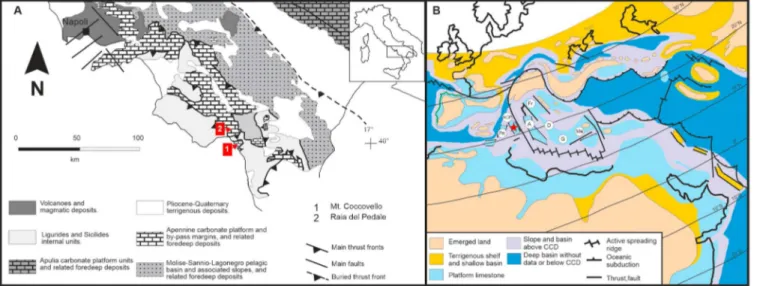
This paper presents the results of a detailed sedimentological and geochemical study investigating the response of a shallow marine carbonate platform to the environmental perturbations associated with OAE‐2. The investigated sections, located in the Apennines of Southern Italy (ACP thereafter in the text), contain a biostratigraphically continuous and expanded record of shallow water carbonate deposition through OAE‐2 (Frijia et al., 2015; Frijia & Parente, 2008; Parente et al., 2007, 2008) offering the unique opportunity of studying the response of these systems to paleoenvironmental changes at high temporal reso-lution in a tropical locality (Figure 1).
2. Geological Setting
The ACP of southern Italy comprises Mesozoic carbonate successions deposited in shallow tropical waters at the southwestern margin of the Neo‐Tethys Ocean (Figure 1). They were part of a palaeotectonic domain, variously called Adria or Apulia, which has been alternatively interpreted as a promontory of the African continent (Channell et al., 1979; Schettino & Turco, 2011) or as an independent continental block, sepa-rated from Africa by an oceanic corridor (Bosellini, 2002; Dercourt et al., 1986; Stampfli & Mosar, 1999). In the reconstructions of the Mesozoic palaeogeography of Adria, the ACP is an element of a more or less articulated system of carbonate platforms separated by deep basins (Mostardini & Merlini, 1986; Sgrosso, 1988; Menardi Noguera & Rea, 2000; Patacca & Scandone, 2007). Shallow water carbonate sedimentation started in the Middle Triassic and was established over large areas in the Late Triassic, persisting with minor interruptions until the Late Cretaceous. After a long phase of subaerial exposure, neritic carbonate sedimentation was locally reestablished in the late Paleocene‐Eocene and again in the early Miocene and was eventually terminated in the middle Miocene by drowning below the photic zone, followed by deposi-tion of deep water siliciclastics (Lirer et al., 2005; Patacca & Scandone, 2007). The total thickness of the exposed portion of the Mesozoic ACP is about 4,000 m (D'Argenio & Alvarez, 1980; Frijia et al., 2005).
The lithostratigraphy of the Upper Cretaceous carbonates of the ACP has been recently redefined in the framework of the new edition of the geological map of Italy at 1:50,000 scale, coordinated by the Italian Geological Survey (project CARG). The successions studied in this work can be referred to the upper part of the “Calcari ad alveoline e dolomie laminate” Member (Alveolinid limestones and laminated dolomites Mb)
3. Materials and Methods
3.1. Sedimentology and Facies AnalysisThe studied sections are located in Southern Italy, 180 km south of the city of Naples (Figure 1). The Raia del Pedale (RdP: 40°23′43″, 15°44′80″E) section is located near the small village of Sanza and the Monte Coccovello section (MC: 40°02′50″N to 15°42′24″E) is located near the village of Maratea. The lithological and sedimentological features of the studied sections were described in detail at the outcrop. Samples for pet-rographic analysis and geochemistry were collected at intervals ranging from ~0.5–1 m. In certain critical intervals samples were collected every 5–10 cm. Samples were subsequently examined using optical and scanning electron microscopy (SEM), the latter after platinum coating or gold/palladium coating using a LEO 1550 at the Max Planck Institute of Potsdam, Germany. To discard sample contamination of specific facies (e.g., laminites), samples were collected by removing the first decimeter of the outcrop surface. They were, then, stored in a sterile box, washed to remove any superficial organic material and other impu-rities, andfinally cut and polished to ensure the surface area was clean.
3.2. Carbon Isotopes
A total of 165 (RdP) and 65 (MC) bulk samples was analyzed forδ13Ccarbat the Museum für Naturkunde, Berlin, using a Thermo GASBENCH II coupled online with a Thermo DELTA V isotope ratio mass spectro-meter. Reference gas was pure CO2(4.5) from a cylinder calibrated to the Vienna‐Pee Dee Belemnite (VPDB) scale using International Atomic Energy Agency (IAEA) and National Bureau of Standards (NBS) reference materials (NBS 18 and NBS 19). Isotope values are shown in the conventionalδ notation in per mil (‰) ver-sus VPDB. Reproducibility of replicate measurements of lab standards (Jurassic limestone) is generally bet-ter than ±0.10‰ (1σ). Additionally, sample powders from 36 rudist and ostreid shells were obtained using a dental microdrill and a New Wave Micromill. Carbon isotopic analyses were conducted at the GFZ, Potsdam (Germany), using a Thermo‐Finnegan MAT253 mass spectrometer coupled to a KIEL IV device. The results were compared to the isotopic standard NBS‐19 and are expressed relative to VPDB standard in conventional
Figure 1. (a) Schematic geological map of the Southern Apennines (modified from Butler et al., 2004) with location of the studied sections (Monte Coccovello—MC and Raia del Pedale—RdP). (b) Paleogeographic map for late Cenomanian of the western Tethys (after Philip et al., 1993) showing the position of the Apennine Carbonate Platform (ACP, red star) and surrounding carbonate platforms. A: Apulia, D: Dalmatia, Fr: Friuli, G: Gavrovo, Me: Menderes Pn: Panormides; CCD: Calcite Compensation Depth.
10.1029/2019GC008306
δ notation. Analytical precision for carbon isotopes was <0.06‰ (1σ). One hundred forty‐eight samples from RdP and 64 samples from MC were decarbonated using 2M HCl, prior to analysis forδ13Corgand organic carbon content. The analyses were performed at the Museum für Naturkunde, Berlin (see below for instru-ment details). Stable isotope ratios are expressed in the conventional δ notation relative to VPDB. Reproducibility of replicate measurements of lab standards (Peptone) is generally better than ±0.10‰ (1σ) and 3% of the concentration analyzed for organic carbon content measurements.
3.3. Nitrogen Isotopes
A total of 67 samples from RdP and 11 from MC was analyzed forδ15N. Nitrogen isotopic analyses were per-formed on bulk sample powder aliquots both on decalcified and nondecalcified sample powders in order to avoid potential contamination from sample pretreatment (in view of the low abundances of N expected in the samples). For this purpose, the analytical setup was modified to cope with sample sizes up to 200 mg, by incorporating a carbon trap to remove carbon from the sample gases. After testing the analytical system with in‐house standards, a minimum N content of at least 12 μg was determined for a reliable δ15
N analysis. In cases when the N content of the bulk samples was below 12μg, we used the δ15N value of the acidified samples. All data are expressed relative to atmospheric nitrogen (Mariotti, 1983). Isotopic measurements were performed with a Thermo Delta V isotope ratio mass spectrometer, coupled to a THERMO Flash EA 1112 elemental analyzer via a Thermo Conflo IV interface in the stable isotope laboratory of the Museum für Naturkunde, Berlin. The nitrogen isotopic measurements were routinely calibrated against IAEA stands N1 and N2. Reproducibility was estimated from repeated measurements of a lab standard material (peptone) and was better than ±0.15‰ (1σ) and 3% of the N concentration analyzed for content measurements.
3.4. Bulk Organic Geochemistry
Rock‐Eval pyrolysis analyses were carried out on 27 selected laminite samples from RdP and 17 from MC using ~100 mg of dried and powdered sample aliquots on a Rock‐Eval 6 at the University of Oxford. Standard notations are used: S1 and S2 are in milligrams of hydrocarbons per gram of dry sediment and Tmax(temperature of maximum hydrocarbon generation during pyrolysis) is expressed in degrees Celsius. The hydrogen index (HI = S2/TOC × 100) and oxygen index (OI = S3/TOC × 100) are expressed in milli-grams of CO2per gram of TOC. The accuracy of R‐E TOC data has been validated for low concentration sam-ples in Dickson et al. (2017) by comparison to Coulomat analyses.
TOC concentrations were measured from 169 samples from RdP and 69 from MC and analyzed at the Institut für Erd und Umweltwissenschaften of Potsdam University. Dried samples (5 to 10 mg of bulk sam-ple) were placed in silver caps and reacted with 4% and then 25% HCl before being dried at 90 °C. Measurements were made using a Vario EL elemental analyzer. The reproducibility for replicate analysis was better than ±15% (1σ). According to the analytical protocol, the reported TOC contents (weight percent) represent OC contents of decarbonated samples calculated as percentage of the bulk sample weight before decalcification.
4. Results
4.1. SedimentologyThe sedimentary successions at MC and RdP share a very similar vertical facies evolution (Figure 2). The two successions are characterized by meter scale subtidal‐peritidal depositional cycles containing benthic fora-minifera, green algae, mollusks (bivalves and gastropods), ostracods, and microproblematica (Thaumatoporella algae), indicating deposition in the inner setting of a carbonate platform, with evidences of subaerial exposure at cycle tops. Subtidal members of the cyclic succession with well‐diversified fauna of larger foraminifera, green algae, and rudist bivalves are common at similar stratigraphic levels in both out-crops (Figure 2). Many of these subtidal levels are capped by buff‐to‐yellowish crinkly laminites, commonly associated with peritidal environments (Demicco & Hardie, 1994).
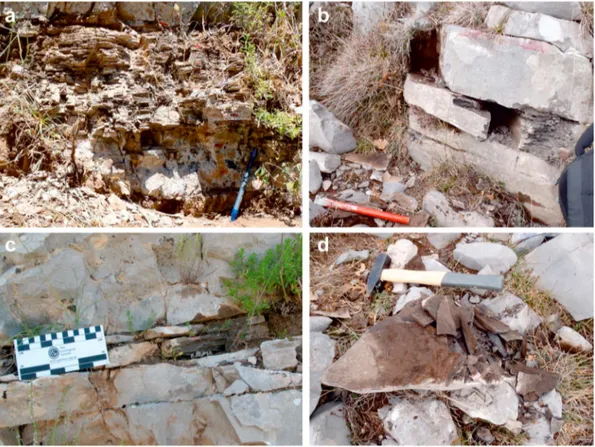
In this general context of repetitive subtidal‐to‐peritidal facies transitions, some very distinctive facies stand out in both sections. These are represented by centimeter‐thick limestone levels (from 4–5 cm to max 20–25 cm), with parallel to crinkly thinly bedding and lamination. These peculiar laminites are dark gray/brown in color and, in places, slightly argillaceous (Figure 3). These laminated limestone levels (“dark” laminites hereafter) are intercalated with nonlaminated limestones and occur within two distinct intervals in which
they are abundant and closely spaced. We define these two intervals as “laminite I and II.” As previously indicated, thin laminated beds also occur at base or top of several peritidal cycles in the lower and upper parts of the sections. However, they are usually thinner (rarely >5 cm), occur more regularly through the sections, are lighter colored, and have lower TOC values (see below) than the laminite I and II units. The laminite I and II units occur at correlatable stratigraphic positions in both sections (Figure 2). The laminite I interval (~8–9 m in thickness) is characterized by the thickest dark laminite beds (10 to 20–25 cm), while the laminite II interval covers a thicker (~12 and 17 m) stratigraphic interval but is characterized by thinner (from 4–5 to max 10–15 cm) and slightly less frequent individual dark laminite levels (Figures 2 and 3).
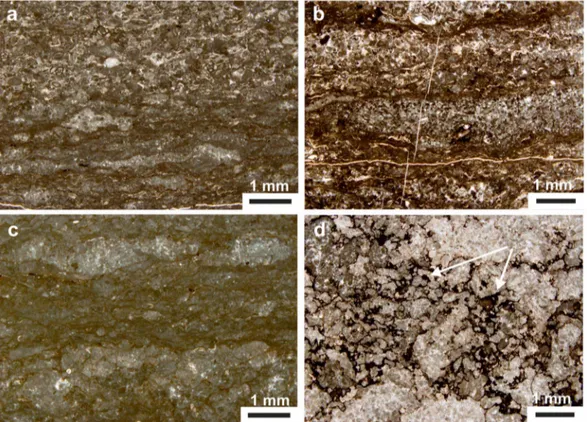
In thin section, the dark laminites show distinct wrinkly millimeter‐scale laminae and centimeter‐scale lamina sets. The laminae are often discontinuous with thin,fine‐grained, dark, micropeloidal layers showing a clotted fabric often with lumps and lenses and rare skeletal components frequently associated with organic‐rich laminae. These often alternate with detrital carbonate layers made by oriented, coarser carbo-nate allochems, including small benthic foraminifera (mainly miliolids), ostracods, Thaumatoporella algae, small crustaceans, and lithoclasts (Figure 4). Observations from SEM on both slightly etched and on fresh surfaces indicate that the dark laminites (mainly the individual organic‐rich and micropeloidal laminae) host abundant microbial remains such as calcified twisted filaments, mineralized cyanobacterial sheaths (e.g., Défarge et al., 1994), and Spirulina‐like microorganisms as well as rods and coccoid bodies. Extracellular polymeric substances (EPS) are widely distributed in these samples (Figure 5). SEM micropho-tographs clearly show that the EPS and bacteria remains are embedded in the matrix; some are calcified, while others show primary mineralization and crystal growth. These observations let us conclude that the observed and reported bacterial features are of primary origin.
Figure 2. Biostratigraphy, lithostratigraphy, andδ13Ccarb,δ13Corg, TOC, andδ15Nbulkprofiles across the OAE‐2 interval in the studied sections. The thick red curve of theδ13Ccarbprofile represents the three‐point moving average of C‐isotope ratios of bulk samples. The thin blue line superimposed to the bulk
δ13C
carbat Raia del Pedale has been obtained from well preserved bivalve shells. The interval representing the OAE‐2 (indicated by red correlation lines) and the
datum levels A, B, and C are placed after correlation using characteristicδ13C peaks and troughs with carbon isotope reference curves of Paul et al. (1999) and Jarvis et al. (2006, 2011; see main text and supporting information for details). In all the geochemical profiles, continuous line indicates organic lean, nonlaminated levels, whereas single (isolated) dots represent samples from laminated levels (see main text). Gray‐shaded areas highlight the stratigraphic position of the laminites I and II intervals (see main text). Laminite I and II intervals are associated with high TOC,δ13Corg, and lowδ15Nbulkvalues. Larger Foraminifera Extintion events
(LFE1 and LFE2) are taken from Parente et al. (2008). OAE‐2 = Oceanic Anoxic Event‐2.
10.1029/2019GC008306
4.2. Carbon Stratigraphy
Theδ13Ccarbcurves at both sections show a pronounced positive excursion of ~4–5‰ and reproduce the fea-tures previously identified from these sections by Parente et al. (2007, 2008). These features are comparable to theδ13C reference curves from pelagic carbonate successions that are linked to OAE‐2 (Jarvis et al., 2006, 2011; Paul et al., 1999; Tsikos et al., 2004).δ13Ccarbmeasurements from RdP were also obtained from micro-drilled material from well‐preserved rudist and ostreid shells and show absolute values and isotopic trends comparable with those of bulk curve (Figure 2 and Tables S1, S2, and S11 in the supporting information). This is likely indicative of preservation of the original isotopic signal in bulk carbonate material.δ13Ccarb measurements obtained by microdrilling of well‐preserved bioclasts also allow for precise placement of the onset of the OAE‐2 at RdP. Using the chemostratigraphic nomenclature established in published δ13C
carbreference curves (Jarvis et al., 2006; Paul et al., 1999), we can readily identify afirst peak (A), a trough (B), a second peak (C), and a plateau phase, which yields a precise temporal framework for the OAE‐2 interval in the studied sections (Figure 2). Additional correlation between the two sections is given by the presence of the larger foraminifera Cisalveolina fraasi which is an important biostratigraphic marker for the late Cenomanian of the ACP whose range has been constrained by C‐isotope stratigraphy (Parente et al., 2007; Frijia et al., 2015). At the bedding scale, dark laminite units haveδ13Ccarbcompositions that are up to 3‰ lower than the surrounding carbonates (Figure 2). This relationship is maintained at the scale of individual laminated levels, where samples with high OM content also generally have lowerδ13Ccarb values (Table S7 in the supporting information).
Theδ13Corgcurves are also comparable between the two sections but have a different stratigraphic trend compared to theδ13Ccarbrecord. The absolute isotopic values measured fromδ13Corgof bulk carbonates vary from−19.5‰ to −26.6‰ (average −22.5‰, n = 95) at RdP and from −17.7‰ to −25.5‰ (average −22.8‰, n
Figure 3. Field photographs of laminated limestones (« Laminites I and II intervals »; see main text) intercalated with non-laminated levels, from the studied sections (Monte Coccovello and Raia del Pedale). (a, b) Laminite I interval, 10‐ to 20‐cm thick planar to crinkly laminites from Raia del Pedale (a) and Monte Coccovello (b) sections. Bedding pattern is enhanced by surface weathering. (c, d) Laminite II interval, 5‐ to 10‐cm‐thick planar to wavy laminites, from Raia del Pedale (c) and Monte Coccovello (d) sections. Note the overallfissile character and brownish dark color of the laminated beds.
= 51) at MC (Tables S3 and S4 in the supporting information). In both sections, two distinct positive excursions can be identified. These excursions are separated by a plateau with the lowest δ13
Corg compositions found in each section. Thefirst positive excursion interval encompasses the onset of OAE‐2, whereas the second one occurs in the plateau phase of the event. These positive δ13Corg intervals correspond stratigraphically to the dark laminite intervals (Figure 2). The dark laminite beds themselves have higherδ13Corg compositions than the surrounding carbonates and show the highest values of the
whole data set (max −17.9‰, min −24‰, average −21.2‰, n = 50 at RdP and max −18.4‰, min
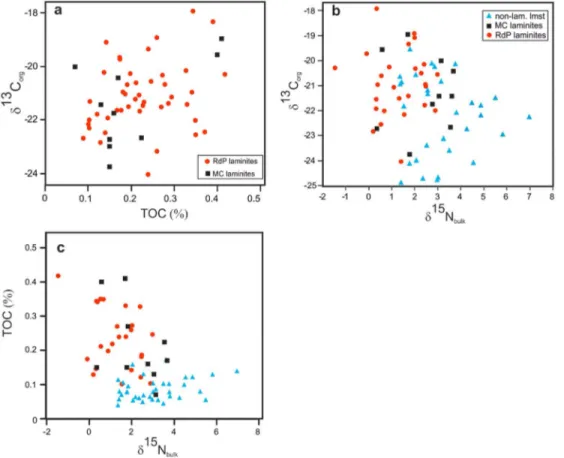
−27.2‰, average −21.7‰, n = 13 at MC; Figure 2). Furthermore, within a single dark laminite level, samples with higher TOC have the highestδ13Corgvalues (Figure 6).
4.3. TOC and Rock‐Eval Pyrolysis
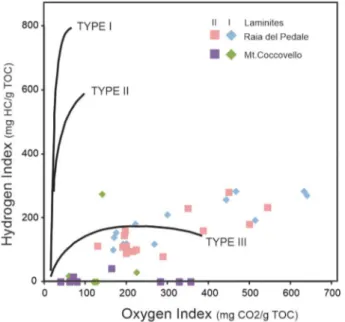
TOC values in the carbonate beds are quite low in both sections (average 0.08% for RdP and 0.21% for MC; Figure 2 and Tables S3 and S4 in the supporting information), which is typical of platform carbonates (Hunt, 1995). However, two peaks in the bulk carbonate TOC are found in both sections coinciding with the two dark laminite intervals (average ~0.2% at RdP [min 0.09%, max 0.42%, n = 59] and ~0.3% at MC [min 0.07%, max 0.87%, n = 16]). Rock‐Eval data indicate that all dark laminite samples are very similar in terms of their bulk organic geochemistry (Table S10 in the supporting information). A Van Krevelen cross‐plot of the hydrogen index (HI) versus the oxygen index (OI) suggests that all the measured samples are character-ized by a mixture of type II and III kerogen (Figure 7). The average Tmaxof 425 °C indicates that the organic matter in these samples is immature to early mature (Espitaliè, 1986; Peters, 1986).
4.4. Nitrogen Isotopes
The bulkδ15N values at RdP average 3.2‰ (min 1.3‰, max 6.9‰, n = 39) in the TOC‐lean carbonates with an excursion to ~7.5‰ in the upper dark laminite unit. The data resolution for the lower dark laminite unit is
Figure 4. Selected thin section images of the laminated facies. (a, b) Wrinkly laminations with micropeloidal clotted layers with wisps of organic‐rich, millimeter‐thick laminae and rare skeletal debris alternating to coarser detrital layers with small miliolids, Thaumatoporella, ostracods, possible small crustaceans, and other undetermined carbonate debris. (c) Discontinuous wrinkly laminations of micropeloidal clotted layers with small and rare bioclasts, associated with dark organic‐rich laminae. (d) Nonlayered micropeloid clots with remains of organic‐rich material (white arrows).
10.1029/2019GC008306
comparably coarse, so discerning a similar shift is problematic, though a positive value of 7‰ is recorded in the upper part of the dark laminite I interval.δ15N values average ~1.3‰ (min −1.5‰, max 3‰, n = 28) in the dark laminite beds from Rdp and 2.4‰ (min 0.3‰, max 3.7‰, n = 11) in the dark laminites of MC (Figures 2 and 6 and Tables S5, S6, and S9 in the supporting information).
5. Discussion
5.1. Origin of the Dark Laminite Units on the ACP
An intriguing feature of the two ACP sections in this study is the difference betweenδ13Ccarbandδ13Corg across OAE‐2, with the δ13
Corg profile diverging from the typical shape of the OAE‐2 carbon isotope excursion as recorded byδ13Ccarb (Figure 2). The highest measured values in δ13Corg composition are recorded within the laminite I and II intervals and actually include both TOC‐lean subtidal carbonates and the interbedded dark laminite levels. This is a consistent stratigraphic pattern in δ13Corg at both MC and RdP and mitigates against any local diagenetic overprint on the individual δ13Corg data sets and confirms that the depositional controls on the major stratigraphic trends in δ13Corg were regional in extent. Possible explanation for the divergence ofδ13Corg from δ13Ccarb at MC and RdP, particularly in view of the low TOC abundances and the Rock‐Eval data, at both locations, is that the bulk OM com-position was controlled principally by (i) the mixing of different organic matter sources, (ii) changes in local pCO2, and (iii) change in the growth rate of primary producers.
Figure 5. Scanning electron microscopy photomicrographs of the laminite facies showing (a) cyanobacteria trichome (arrow), (b) mineralized sheaths offilamentous cyanobacteria (arrow), (c) spirulina‐like microorganism (arrow), (d) microbialfilaments (arrows) and colony of coccoid bacteria (dashed arrow), (e) filamentous bacteria (arrow), and (f) extracellular polymeric substance (arrows).
Although mechanisms relating to local variability in pCO2 cannot be entirely ruled out, several lines of evidence support the interpretation that principal control on the δ13Corgvariations at MC and RdP, and the very high values inδ13Corg within the dark laminite intervals, in particular, relate to changes in the composition and abundance of the marine organic matter buried on the platform. The ACP was located far from emergent continental landmasses during the Cenomanian‐Turonian (see Figure 1). Therefore, a significant terrestrial organic matter contribution toδ13Corgis difficult to interpret, even though Rock‐Eval data suggest that a portion of the organic matter in the dark laminites is terrestrially derived (Type III kerogen). The possibility that this organic matter was previously wholly of marine origin and was degraded during burial diagenesis to a degree that it turned into a type II/III mix can be dismissed as the Tmaxdata and petrographic observations do not suggest significant thermal alteration. In addition, known Cretaceous isotopic composition of terrestrial organic matter was approximately −23‰ to −26‰ (Jarvis et al., 2011, and references therein; Takashima et al., 2011; Meyers, 2014), which is lower than the average values measured in the laminites (−21‰ to −22‰). Moreover, the most positive values of terrestrial OM reported in literature are found associated with the main positive peaks of theδ13Ccarbcurve (A‐B‐C peaks in Figure 2). On the other hand, in our sections, the heavierδ13Corgvalues, associated with the laminites, show an offset with respect to theδ13Ccarbcurve. Finally, when comparing C/N ratios with theδ13Corgvalues of the laminites (Table S12 in the supporting infor-mation), a positive covariance can be noted, likely suggesting productivity variations (Meyers, 1994). These lines of evidence suggest that the presence of terrestrial organic matter in the dark laminites was likely volumetrically minor and not the reason for the observed positiveδ13Corgpeaks in these intervals. More likely, higherδ13Corg values resulted from in situ fractionation of Carbon by photosynthetic microorganisms (Dean et al., 1986). Petrographic studies of the dark laminites show (i) alternation of thin organic‐rich laminae with thicker detri-tal laminae; (ii) the presence of clotted fabrics; (iii) abundant calciticfilaments, rod, and coccoid structures; and
Figure 6. Cross‐plots of TOC and isotopic data for Laminites I and II samples and organic lean, nonlaminated samples at Monte Coccovello (MC) and Raia del Pedale (RdP) sections. (a)δ13Corgversus TOC. (b)δ13Corgversusδ15Nbulk. (c) TOC
versusδ15Nbulk. Note the positive correlation betweenδ13Corgand TOC values and the negative correlation between
δ15Nbulkversusδ13Corgandδ15Nbulkversus TOC.
10.1029/2019GC008306
(iv) the ubiquitous presence of EPS, which are all indicative of microbially induced sedimentary structures (e.g., Noffke, 2009; Noffke & Awramik, 2013). The presence of EPS allowed the preservation of specific microbial remains such as abundant mineralized sheaths of cyanobacteria trichomes andfilaments resembling Spirulina‐like microorganisms. These remains are comparable to those observed in aquatic organisms that are found inha-biting present‐day freshwater tropical environments (e.g., Seo et al., 2013) or microbial mats in tropical marine settings (Charpy et al., 2012). These comparisons allow for the interpretation that changes in the abundance of cyanobacteria in the marine‐derived organic matter matrix may be the principal control on theδ13Corg variations at MC and RdP. It has been demonstrated that elevated growth rates of photozoa and/or specific bio-geochemical processes can result in lowerδ13Corgfractionation (Fogel & Cifuentes, 1993; Pancost et al., 2004). In addition, Schidlowski et al. (1994) showed, in an experimental study of cultured cyanobacteria, that heavy values ofδ13Corgwere associated to maxima in biomass bacterial den-sity and independent from T and salinity.
Several studies have shown that ancient marine sediments and their derived bulk‐sediment N‐isotopic composition record the original isotopic composition of dissolved inorganic nitrogen with minor or negligible diagenetic effects (Algeo et al., 2014, and references therein; Struck, 2012). In cases of mixed organic matter sources (e.g., marine vs. terres-trial), the relatively poor content of N in the terrestrial organic matter has very little influence on bulk sediment δ15N for modest contamination (Algeo et al., 2014). In the studied sections the low thermal maturity, high carbonate content, and low siliciclastic content of the studied depos-its suggest that the bulk nitrogen isotope ratios should primarily record a marine organic matter signal. Additional evidence from studied sections indicates that our samples preserve a consistent, likely original δ15N signature. The similar isotopic ratios between correlatable dark laminite intervals in the two sections suggest preservation of the same signal. Moreover, theδ15N values in the dark laminite levels are in the range of those found across the Cenomanian‐Turonian interval in deep water sections worldwide (organic‐rich OAE‐2 sediments comprises δ15N values between−3‰ and +2‰), which we interpret as pri-mary evidence of a marine‐derived δ15
N signal (Algeo et al., 2014; Junium et al., 2017 and reference therein; Zhang et al., 2014, 2019).
It is highly likely that the high abundance of cyanobacteria in the dark laminite intervals at MC and RdP contributed to nitrogenfixation in the shallow waters overlying the ACP. However, although our laminite samples have the lighterδ15N values of the entire data set, those are in average sligtly above 0‰ (Figure 2 and Table S8 in the supporting information). These values seem in contrast with those reported from various sites of the proto‐North Atlantic and western Tethys where δ15N values of the black shale are often signifi-cantly below 0‰ (down to −3‰ , Kuypers et al., 2004; Jenkyns et al., 2007; Junium & Arthur, 2007; Meyers et al., 2009; Higgins et al., 2012; Ruvalcaba Baroni et al., 2015). High rate of N‐fixation (Kuypers et al., 2004; Ruvalcaba Baroni et al., 2015), incomplete assimiliation of ammonium by eukaryotic algae in the euxinic photic zone (Higgins et al., 2012), and the“alternative” nitrogenase process triggered by the presence of anoxic conditions (Zhang et al., 2014) are the main hypotheses to explain the very negativeδ15N values dur-ing the OAE‐2 (Junium et al., 2017; Zhang et al., 2018). The presence of an intense anoxic environment, irre-spective of which theory is correct, seems necessary to create very negativeδ15N values. On the other hand δ15N values similar to our laminite ones (above 0‰) are reported from the eastern Tethys (Zhang et al., 2018) and attribute to a limited oxygen depletion of water masses. Considering the shallow water depositional environment of our deposits, this hyphotesis seems possible. An alternative explanation to interpret the “positive” δ15N values of the Apennine laminites could rely on the fact that we analyzed bulk sedimentary rocks. Therefore, the measured values reflect not the total cyanobacteria biomass but instead the bulk nitro-gen from the entire ecosystem production. In several studies it has been shown that the bulk sedimentary nitrogen in areas under strong influence of nitrogen fixation has δ15N values above 0‰ up to
Figure 7. Plots of Oxygen Index versus Hydrogen Index for the organic mat-ter analyzed from laminite I and II samples at Monte Coccovello and Raia del Pedale. The samples from organic matter composition indicate a possible mix of Type II (marine) and Type III (continental) kerogen.
10.1029/2019GC008306
approximately 2–3‰ (Carpenter et al., 1997; Cremonese et al., 2014; Fogel & Cifuentes, 1993; Struck, 2012; Struck et al., 2001, 2004). The negative correlation betweenδ15N and TOC (Figure 6) indicates that an increasing amount of nitrogen was contributed from cyanobacterial N‐fixation and dominated in intervals of elevated TOC. Despite the inferred link between cyanobacterial abundance and nitrogenfixation at MC and RdP, there is distinct variability in theδ15N compositions of TOC lean samples measured from within individual laminite intervals, whereδ15N increases to higher values (Figure 2). These increases are best explained by the bacterial reduction of nitrate, (denitrification) a process which leads to higher sedimentary δ15
N (Sepulveda et al., 2009 and references therein). This process usually occurs under low oxygen condi-tions with high primary productivity (e.g., Struck, 2012). Zhou et al. (2015) recently used I/Ca data to suggest that low‐oxygen waters did indeed occupy the shallow ACP over RdP during OAE‐2. Furthermore, coupled N‐fixation and denitrification has been described and modeled in recent studies and linked to organic matter quality/quantity with the timing of organic matter deposition determining the magnitude of these processes (Fulweiler et al., 2013 and references therein). Given the evidence for microscale variations in bacterial abundance in the dark laminite intervals, it is possible that the shallow ACP oscillated between intervals of abundant bacterial growth and nitrogenfixation (lower δ15N) and active nitrogen consumption during periods of less abundant bacterial growth. We interpret this sort of process to be a driver behind the occur-rence of the dark laminite levels at RdP and MC.
5.2. Palaeoenvironmental Significance of the ACP Laminite Intervals
The stratigraphic placement of the two dark laminite intervals relative to the OAE‐2 δ13C excursion is likely indicative of a genetic link between the anoxic event and the dark laminites (Figure 2). This forms the basis of establishing a temporal framework for the deposits around the OAE. OAE‐2 has been associated with LIP volcanism commencing ~30–315 kyr before the onset of the event, as indicated by Os isotope data (Du Vivier et al., 2014, 2015; VP‐1 in Figure 8). Combining the chemostratigraphic framework established for OAE‐2 on the ACP, approximating an event duration of ~445 to 820 kyr (Eldrett et al., 2014, 2015; Li et al., 2017; Ma et al., 2014; Sageman et al., 2006; Voigt et al., 2008), and presuming no large hiatus in the sedimentary suc-cession during the OAE‐2 interval (Frijia & Parente, 2008; Parente et al., 2007), the beginning of the first dark laminite unit can be placed ~40 to 70 kyr before thefirst positive δ13Ccarbshift that denotes the onset of OAE‐ 2. This timing suggests a close relationship between thefirst pulse of LIP Volcanism recorded by Os‐isotopes (Du Vivier et al., 2014; Schroder‐Adams et al., 2019) and bacterial proliferation observed on the ACP (Figure 8).
In terms of mechanism, volcanic activity associated with LIP emplacement would have led to rapid increase in atmospheric CO2and temperature (Forster et al., 2007; Barclay et al., 2010; van Bentum et al., 2012, Figure 8) and release of Fe and other biolimiting micronutrients to oceanic waters (Jenkyns, 2010; Jenkyns et al., 2017; Poulton et al., 2015) and to an increase in weathering (Blätter et al., 2011; Frijia & Parente, 2008; Hetzel et al., 2009; Pogge von Strandmann et al., 2013). Increased runoff associated with increased rates of weathering would have enhanced the supply of nutrient P to the oceans (Mort et al., 2007; Ruvalcaba Baroni et al., 2014; Figure 8). Increase in nutrient supply then would lead to enhanced pro-ductivity, yielding the higher‐TOC sedimentary record that is associated with the OAE‐2.
It is possible that cyanobacterial nitrogenfixation may have also been favored during the OAE‐2 due to ele-vated pCO2, as shown for many extant species (Fu et al., 2008; Hutchins et al., 2007, 2013; Hutchins et al., 2009; Kranz et al., 2009; Levitan et al., 2007; Qiu & Gao, 2002). Elevated temperature can also play a role in favoring cyanobacteria production over other phytoplankton species such as diatoms and green algae (Paerl & Huisman, 2008; Ramos et al., 2005; Robarts & Zohary, 1987). Elevated temperatures would have
Figure 8. Correlation of the geochemical signature of carbonates (continuous lines) and Lamitites I and II data (dots) from the ACP (this study) with, Phosphorus (P) accumulation rates from Eastbourne (Mort et al., 2007), paleo–sea surface temperature (SST, °C) record from ODP Site 1276 based on biomarker data (TEX86,
Sinninghe Damsté et al., 2010),δ13C paleo CO2proxy,δ13Corg, and bulk marineδ13Ccarbcurves from pelagic section of western Tethys (Jarvis et al., 2011) and
terrestrialδ13Corgand CO2record (colored envelope indicates 95% confidence intervals) estimated based on stomatal index from the Western Interior Seaway USA
(Barclay et al., 2010) across the OAE‐2. Orange bars (VP‐1 and VP‐2) represent inferred volcanic pulses. VP‐1, at the onset of the event, is drawn based on Os isotope data (Du Vivier et al., 2014, 2015). VP‐2, during of the Plenus Cold Event (PCE in blue box), is taken from Zheng et al. (2013) and Jenkyns et al. (2017). Yellow‐ shaded boxes indicate the stratigraphic distribution of Laminites I and II interval recognized in the ACP. LFE1 and LFE2 indicate the two horizons of selective extintion among larger foraminifera on the ACP (see text for explanation). ACApennine Carbonate Platform; LFE = Larger Foraminifera Extintion.
provided cyanobacteria a competitive advantage in greenhouse situations such as that which prevailed dur-ing OAE‐2 (e.g., Forster et al., 2007; Sinninghe Damsté et al., 2010; Van Helmond et al., 2014). Furthermore, an increase in phosphorus has been shown to enhance nitrate utilization and therefore to be favorable for nitrogenfixers to dominate (Sañudo‐Wilhelmy et al., 2001). Cyanobacteria can compete with non‐N2‐fixing algae when N concentrations are low relative to bioavailable P (Kuypers et al., 2004; Struck et al., 2004). The presence of oxygen‐depleted water in the open oceans during OAE‐2 would have increased denitrification, which would have decreased the supply of biologically available nitrogen in seawater, thus giving N‐fixing cyanobacteria a competitive advantage over algae (Kuypers et al., 2004; Sepulveda et al., 2009). According to these observations, it can be argued that the lower dark laminite interval recorded at MC and RdP repre-sents the immediate (first) response of the carbonate platform to the perturbations in global ocean chemistry and climate that took place before the onset of OAE‐2 (Figure 8). By contrast, the presence of thick bedded, nonlaminated, carbonates with high faunal diversity and abundance of extreme K strategists such as larger foraminifera, immediately above thefirst laminated interval (Figures 2 and 8), suggests a return to more oli-gotrophic conditions (Parente et al., 2008). By comparing theδ13Ccarbrecord to age‐calibrated successions (Eldrett et al., 2014; Li et al., 2017; Ma et al., 2014; Sageman et al., 2006), this return to oligotrophic condi-tions can be estimated to have occurred ~30–50 kyr after the onset of OAE‐2.
The second dark laminated interval in the ACP occurs a few meters above the beginning of the plateau phase of theδ13Ccarbexcursion and records a second increase in cyanobacterial productivity (Figures 2 and 8). Taking into account the interpreted origin of the lower laminite interval, it might be speculated that the upper laminite interval records the impact of a second volcanic pulse on the platform carbonate facies during OAE‐2. Trace element enrichment data from several sites in the Western Interior Seaway and the northern proto‐North Atlantic Ocean (Eldrett et al., 2014; Orth et al., 1993; Snow et al., 2005) and Nd isotopes from Eastbourne (Zheng et al., 2013) have been used to infer a second volcanic pulse (VP‐2 in Figure 8) starting in the so‐called Plenus Cold Event (PCE)/Benthic Oxic Zone (as defined by Gale & Christensen, 1996; Prokoph et al., 2013; Eldrett et al., 2014). This may have been associated with cooling‐induced change in cir-culation and the southward spread of Arctic water masses (Jenkyns et al., 2017; Zheng et al., 2013, 2016) and had a major effect on fauna and water chemistry (Clarkson et al., 2018; Jenkyns et al., 2017; Sweere et al., 2018). However, considering temporal equivalency, the second dark laminite interval at MC and RdP clearly lags the timing of the PCE, which can be located chemostratigraphically using a prominent decrease in δ13
Ccarb(Figure 2). The difference in timing may suggest a different trigger mechanism for the formation of the upper dark laminite interval. Most likely the renewed increase of pCO2and temperature after the PCE reflected continued volcanogenic degassing from the Caribbean LIP (Jarvis et al., 2011, and references therein; Du Vivier et al., 2014) which has been calculated to last for ~200–250 kyr after the onset of OAE‐2 (Du Vivier et al., 2014, 2015). In association with this hypothesis, the sea surface temperature cooling during the PCE (interval B of the C‐isotope curve; Figures 2 and 8) could have introduced thermal instability in the water masses, thus stimulating enhanced mixing and recycling of nutrients to the surface fueling productiv-ity (Flögel et al., 2011; Forster et al., 2007; Jarvis et al., 2011; Jenkyns et al., 2017; Sweere et al., 2018; van Bentum et al., 2012). The latter was probably sustained by continued remobilization of P from sediments, favored by anoxic deep waters (Kraal et al., 2010; Monteiro et al., 2012; Tsandev & Slomp, 2009; van Cappellen & Ingall, 1994) which would have reduced the N:P ratio in surface waters giving a further advan-tage to N‐fixing cyanobacteria (Monteiro et al., 2012). Nutrient spiking and resultant productivity increase may also have been sustained by introducing a range of redox‐sensitive trace metals in global seawater dur-ing a reoxygenation phase occurdur-ing durdur-ing the PCE (Clarkson et al., 2018; Jenkyns et al., 2017; Sweere et al., 2018). The delivery of nutrient‐rich waters to the Tethyan carbonate platforms would have triggered slow changes in the trophic levels across the platform which is suggested by the stepwise extinction pattern among larger foraminifera (Parente et al., 2008; Larger Foraminifera Extintion events 1 and 2 in Figures 2 and 8) and by a perturbation of the Zn cycle characterized by light Zn‐isotope values during the PCE (Sweere et al., 2018). As a result of these inputs, when a trophic threshold was crossed, a second episode of microbial‐dominating facies took place over the ACP coeval with the final extinctions of the larger foraminifera (Figure 8).
The gradual biotic changes on the ACP during OAE‐2 represent a typical ecological succession under rising nutrient levels (Hallock, 2000; Mutti & Hallock, 2003; Parente et al., 2008). Sedimentary facies formed under eutrophic and mesotrophic conditions are present beyond the end of OAE‐2 until the mid‐Turonian, when
10.1029/2019GC008306
the systemfinally started to recover (Frijia et al., 2015). Indeed, organic‐matter rich dark laminite levels also occur in the lower‐middle Turonian interval but much more sporadically.
5.3. N‐Fixing Cyanobacteria and OAE‐2
The presence of abundant cyanobacterially derived organic matter in OAE‐2 deposits has been suggested based on both biomarker and stable N isotopic analyses (Blumenberg & Wiese, 2012; Junium & Arthur, 2007; Karakitsios et al., 2007; Kashiyama et al., 2008; Kuypers et al., 2002, 2004; Meyers, 2006; Meyers et al., 2009; Ohkouchi et al., 1997, 2006). Although most of these studies have utilized material from deep water deposits, they postulate that cyanobacteria played an important wider role in OM production during OAE‐2 that may include both pelagic and neritic, open‐shelf settings.
The data presented in this study show that the very shallow and coastal carbonate platform environments were also dominated by cyanobacteria during distinct intervals of OAE‐2. Interestingly, in Mexico two intervals of thick laminated microbialites (Figures 3 and 6 in Elrick et al., 2009; Bomou et al., 2010) have been reported from shelf carbonates at stratigraphic positions similar to the dark lami-nite clusters on the ACP. In Croatia a thick microbialite bed is also described in the lower part of the OAE‐2 interval (Korbar et al., 2012), correlatable with our laminite I cluster. These observations also point to the widespread occurrence of microbial proliferation in shallow carbonate platforms during OAE‐2. Further studies are needed to characterize these deposits in order to enable a detailed compari-son with those from the ACP.
6. Conclusions
A detailed geochemical, sedimentological, and petrographic study has been carried out on two limestone outcrop successions spanning the OAE‐2 from the ACP of southern Italy. Of particular focus in this case are two intervals characterized by abundant and closely spaced dark colored microbial laminites that have been found at correlative stratigraphic horizons at both locations. The lowermost dark laminite interval occurs at the onset of the OAE‐2, whereas the second dark laminite interval occurs during the plateau phase of OAE‐2 (as defined by the respective δ13Ccarbrecords).δ15N,δ13Corg, and TOC data, together with field and petrographic observations, suggest that these beds were dominated by N‐fixing cyanobacteria and that they accounted for a unique concentration of organic matter produced on the ACP in these intervals.
The timing of the deposition of the dark laminite intervals relative to other drivers of OAE‐2 supports the concept that LIP volcanism, enhanced nutrient delivery to the oceans, and the environmental conditions necessary to trigger cyanobacterial proliferation on the (Apennine) carbonate platform are linked. The clus-ters of dark laminated intervals from the ACP seem to be temporally coeval with similar deposits in Mexico and Croatia. It is intriguing to speculate whether cyanobacterially derived organic matter accumulation on carbonate platforms is therefore linked to specific periods of environmental perturbation during OAE‐2. Further, the occurrence of higher‐TOC shallow water dark laminites provides a heretofore underrecognized facies marking OAE‐2 processes in the shallow water realm, much as deep water environments preserve black shales in association with OAE‐2 worldwide.
The response of the Apennine carbonate system to global changes in ocean chemistry, pCO2, and climate at the onset of OAE‐2 indicates the high sensitivity of these coastal/shallow settings to palaeogeographic and palaeoenvironmental events. This study indicates that Tethyan carbonate platforms experienced significant biological changes during OAE‐2, alternating, in few kiloyears, between high‐CO2, eutrophic phases domi-nated by microbial communities and low‐CO2, mesotrophic/oligotrophic conditions favoring“normal” car-bonate production/sedimentation. These findings demonstrate the rapid pace of carbonate platform response to global‐scale changes in ocean chemistry. In addition, this study confirms recent biogeochemical models showing how opportunistic N‐fixing bacteria could dominate a future anthropogenically acidified ocean under the projected double to triple atmospheric pCO2values that could be reached by the end of the century.
References
Adams, D. D., Hurtgen, M. T., & Sageman, B. B. (2010). Volcanic triggering of a biogeochemical cascade during Oceanic Anoxic Event 2. Nature Geoscience, 3(3), 201–204. https://doi.org/10.1038/ngeo743
Algeo, T. J., Meyers, P. A., Robinson, R. S., Rowe, H., & Jiang, G. Q. (2014). Icehouse–greenhouse variations in marine denitrification. Biogeosciences, 11(4), 1273–1295. https://doi.org/10.5194/bg‐11‐1273‐2014
Barclay, R. S., McElwain, J. C., & Sageman, B. B. (2010). Carbon sequestration activated by a volcanic CO2pulse during Ocean Anoxic
Event 2. Nature Geoscience, 3(3), 205–208. https://doi.org/10.1038/ngeo757
Blätter, C. L., Jenkyns, H. C., Reynard, L. M., & Henderson, G. M. (2011). Significant increase in global weathering during Oceanic Anoxic Event 2 by calcium isotopes. Earth and Planetary Science Letters, 309(1‐2), 77–88. https://doi.org/10.1016/j. epsl.2011.06.029
Blumenberg, M., & Wiese, F. (2012). Imbalanced nutrients as triggers for black shale formation in a shallow shelf setting during the OAE 2 (Wunstorf, Germany). Biogeosciences, 9(10), 4139–4153. https://doi.org/10.5194/bg‐9‐4139‐2012
Bomou, B., Adatte, T., Föllmi, K., Arnaud‐Vanneau, A., Fleitmann, D., 2010. Persistence of carbonate platform environments in central Mexico during the Oceanic Anoxic Event 2: Impact of the Carribean Plateau? Geophysical Research Abstracts 12, 2682.
Bosellini, A. (2002). Dinosaurs“re‐write” the geodynamics of the eastern Mediterranean and the paleogeography of the Apulia Platform. Earth‐ Science Reviews, 59(1‐4), 211–234. https://doi.org/10.1016/S0012‐8252(02)00075‐2
Butler, R. W. H., Mazzoli, S., Corrado, S., De Donatis, M., Di Bucci, D., Gambini, R., et al. (2004). Applying thick‐skinned tectonic models to the Apennine thrust belt of Italy—Limitations and implications. In K. R. McClay (Ed.), Thrust tectonics and hydrocarbon systems, AAPG Memoir(Vol. 82, pp. 647–667).
Carpenter, E. J., Harvey, H. R., Fry, B., & Capone, D. G. (1997). Biogeochemical tracers of the marine cyanobacterium Trichodesmium. Deep Sea Research Part I: Oceanographic Research Papers, 44(1), 27–38. https://doi.org/10.1016/S0967‐0637(96)00091‐X
Caus, E., Teixell, A., & Bernaus, M. (1997). Depositional model of a Cenomanian‐Turonian extensional basin (Sopeira Basin, NE Spain): Interplay between tectonics, eustasy and biological productivity. Palaeogeography, Palaeoclimatology, Palaeoecology, 129(1‐2), 23–36. https://doi.org/10.1016/S0031‐0182(96)00051‐X
Channell, J. E. T., D'Argenio, B., & Horvath, F. (1979). Adria, the African Promontory, in Mesozoic Mediterranean palaeogeography. Earth‐ Science Reviews, 15(3), 213–292. https://doi.org/10.1016/0012‐8252(79)90083‐7
Charpy, L., Casareto, B. E., Langlade, M. J., & Suzuki, Y. (2012). Cyanobacteria in coral reef ecosystems: A review. Journal of Marine Biology, 2012, 1–9. https://doi.org/10.1155/2012/259571
Clarkson, M. O., Stirling, C. H., Jenkyns, H. C., Dickson, A. J., Porcelli, D., Moy, C. M., et al. (2018). Uranium isotope evidence for two episodes of deoxygenation during Oceanic Anoxic Event 2. Proceedings of the National Academy of Sciences of the United States of America, 115(12), 2918–2923. https://doi.org/10.1073/pnas.1715278115
Cremonese, L., Shields‐Zhou, G. A., Struck, U., Ling, H. F., & Och, L. M. (2014). Nitrogen and organic carbon isotope stratigraphy of the Yangtze Platform during the Ediacaran–Cambrian transition in South China. Palaeogeography, Palaeoclimatology, Palaeoecology, 398, 165–186. https://doi.org/10.1016/j.palaeo.2013.12.016
D'Argenio, B., & Alvarez, W. (1980). Stratigraphic evidence for crustal thickness changes on the southern Tethyan margin during the Alpine cycle. GSA Bullettin, 91(12), 681–689. https://doi.org/10.1130/0016‐7606(1980)91<681:SEFCTC>2.0.CO;2
Dean, W. E., Arthur, M. A., & Claypool, G. E. (1986). Depletion of13C in Cretaceous marine organic matter: Source, diagenetic, or
envir-onmental signal? Marine Geology, 70(1‐2), 119–157. https://doi.org/10.1016/0025‐3227(86)90092‐7
Défarge, C., Trichet, J., & Coute, A. (1994). On the appearance of cyanobacterial calcification in modern stromatolites. Sedimentary Geology, 94(1‐2), 11–19. https://doi.org/10.1016/0037‐0738(94)90144‐9
Demicco, R. V., and Hardie, L.A., 1994. Sedimentary structures and early diagenetic features of shallow marine carbonate deposits. SEPM Atlas Series No. 1. 265 p.
Dercourt, J., Zonenshain, L. P., Ricou, L. E., Kazmin, V. G., Le Pichon, X., Knipper, A. L., et al. (1986). Geological evolution of the Tethys belt from the Atlantic to the Pamirs since the Lias. Tectonophysics, 123(1‐4), 241–315. https://doi.org/10.1016/0040‐ 1951(86)90199‐X
Dickson, A. J., Saker‐Clark, M., Jenkyns, H. C., Bottini, C., Erba, E., Russo, F., et al. (2017). A Southern Hemisphere record of global trace‐ metal drawdown and orbital modulation of organic‐matter burial across the Cenomanian–Turonian boundary (Ocean Drilling Program Site 1138, Kerguelen Plateau). Sedimentology, 64(1), 186–203. https://doi.org/10.1111/sed.12303
Du Vivier, A. D. C., Condon, D. J., Selby, D., Takashima, R., & Nishi, H. (2015). Pacific187Os/188Os isotope chemistry and U–Pb
geo-chronology: Implications for global sychronicity of OAE 2. Earth and Planetary Science Letters, 416, 121–131.
Du Vivier, A. D. C., Selby, D., Sageman, B. B., Jarvis, I., Gröcke, D. R., & Voigt, S. (2014). Marine187Os/188Os isotope stratigraphy reveals
the interaction of volcanism and ocean circulation during Oceanic Anoxic Event 2. Earth and Planetary Science Letters, 389, 23–33. https://doi.org/10.1016/j.epsl.2013.12.024
Eldrett, J. S., Ma, C., Bergman, S. C., Lutz, B., Gregory, F. J., Dodsworth, P., et al. (2015). An astronomically calibrated stratigraphy of the Cenomanian, Turonian and earliest Coniacian from the Cretaceous Western Interior Seaway, USA: Implications for global astrochro-nology. Cretaceous Research, 56, 316–344. https://doi.org/10.1016/j.cretres.2015.04.010
Eldrett, J. S., Minisini, D., & Bergman, S. C. (2014). Decoupling of the carbon cycle during Ocean Anoxic Event 2. Geology, 42(7), 567–570. https://doi.org/10.1130/G35520.1
Elrick, M., Molina‐Garza, R., Duncan, R., & Snow, L. (2009). C‐isotope stratigraphy and paleoenvironmental changes across OAE2 (mid‐ Cretaceous) from shallow‐water platform carbonates of southern Mexico. Earth and Planetary Science Letters, 277(3‐4), 295–306. https:// doi.org/10.1016/j.epsl.2008.10.020
Espitaliè, J. (1986). Use of Tmax as a maturation index for different types of organic matter. Comparison with vitrinite reflectance. In J. Burrus (Ed.), Thermal modelling in sedimentary basins. Edited by (pp. 475–496). Paris: Editions Technip.
Flögel, S., Wallmann, K., Poulsen, C. J., Zhou, J., Oschlies, A., Voigt, S., & Kuhnt, W. (2011). Simulating the biogeochemical effects of volcanic CO2degassing on the oxygen‐state of the deep ocean during the Cenomanian/Turonian Anoxic Event (OAE2). Earth and
Planetary Science Letters, 305(3‐4), 371–384. https://doi.org/10.1016/j.epsl.2011.03.018
Fogel, M. L., & Cifuentes, L. A. (1993). Isotope fractionation during primary production. In M. H. Engel, & S. A. Macko (Eds.), Organic geochemistry(pp. 73–98). New York: Plenum Press. https://doi.org/10.1007/978‐1‐4615‐2890‐6_3
Forster, A., Schouten, S., Moriya, K., Wilson, P. A., & Sinninghe Damsté, J. S. (2007). Tropical warming and intermittent cooling during the Cenomanian/Turonian Oceanic Anoxic Event 2: Sea surface temperature records from the equatorial Atlantic. Paleoceanography, 22, PA1219. https://doi.org/10.1029/2006PA001349
10.1029/2019GC008306
Geochemistry, Geophysics, Geosystems
Acknowledgments
Sascha Kuske, Denise Jekel, and Nele Richter‐Harder are greatly
acknowledged for their work and help in thefield and for sample preparation. Alex Dickson (Royal Holloway University, London) is warmly aknow-ledged for taking care of Rock Eval analyses and for providing scientific inputs wich improved the manuscript. Marianne Falk (Museum für Naturkunde, Berlin) is deeply thanked for performing C and N isotopes ana-lyses. We are grateful to Antje Musiol and Christina Fisher (Potsdam University) for taking care of TOC ana-lyses and thin sections preparation to Birgit Plessen and Silvia Pinkerneil (GFZ, Potsdam) for performingδ13C
carb
analyses on bivalve shells material and to Luca Bertinetti (Max Plank institute, Potsdam) for helping with SEM analy-sis. The data are available as supporting information. The Editor Claudio Faccenna is greatly acknowledged for his help with the manuscript. We thank Domenico Cosentino and an anon-ymous reviewer for their detailed and constructive comments that improved the manuscript. This paper has been partly funded by a Shell grant to G. F.
Frijia, G., & Parente, M. (2008). Strontium isotope stratigraphy in the upper Cenomanian shallow‐water carbonates of the southern Apennines: short‐term perturbations of marine87
Sr/86Sr during the Oceanic Anoxic Event 2. Palaeogeography, Palaeoclimatology, Palaeoecology, 261(1‐2), 15–29. https://doi.org/10.1016/j.palaeo.2008.01.003
Frijia, G., Parente, M., Di Lucia, M., & Mutti, M. (2015). Carbon and strontium isotope stratigraphy of the Upper Cretaceous (Cenomanian‐ Campanian) shallow‐water carbonates of southern Italy: Chronostratigraphic calibration of larger foraminifera biostratigraphy. Cretaceous Research, 53, 110–139. https://doi.org/10.1016/j.cretres.2014.11.002
Frijia, G., Parente, M., & Iannace, A. (2005). Thermal maturity of the southern apenninic platform unit (southern Italy): Constraints from rock‐eval pyrolysis Tmax data. Atti Ticinensi di Scienze della Terra, 10, 95–98.
Fu, F.‐X., Mulholland, M. R., Garcia, N. S., Beck, A., Bernhardt, P. W., Warner, M. E., et al. (2008). Interactions between changing pCO2, N2
fixation, and Fe limitation in the marine unicellular cyanobacterium Crocosphaera. Limnology and Oceanography, 53(6), 2472–2484. https://doi.org/10.4319/lo.2008.53.6.2472
Fulweiler, R. W., Brown, S. M., Nixon, S. W., & Jenkins, B. D. (2013). Evidence and a conceptual model for the co‐occurrence of nitrogen fixation and denitrification in heterotrophic marine sediments. Marine Ecological Progress Series, 482, 57–68. https://doi.org/10.3354/meps10240 Gale, A. S., & Christensen, W. K. (1996). Occurrence of the belemnite Actinocamax plenus in the Cenomanian of SE France and its
sig-nificance. Bulletin of the Geological Society of Denmark, 43, 68–77.
Hallock, P. (2000). Symbiont‐bearing foraminifera: Harbingers of global change. In: lEE, J.J. & P.H. mullEr (eds), Advances in the biology of Foraminifera. Micropaleontology, 46, 95–104.
Hasegawa, T. (1997). Cenomanian‐Turonian carbon isotope events recorded in terrestrial organic matter from northern Japan. Palaeogeography, Palaeoclimatology, Palaeoecology, 130(1‐4), 251–273. https://doi.org/10.1016/S0031‐0182(96)00129‐0
Heimhofer, U., Wucherpfennig, N., Adatte, T., Schouten, S., Schneebeli‐Hermann, E., Gardin, S., et al. (2018). Vegetation response to excep-tional global warmth during Oceanic Anoxic Event 2. Nature Communications, 9(1), 3832. https://doi.org/10.1038/s41467‐018‐06319‐6 Hetzel, A., Böttcher, M. E., Wortmann, U. G., & Brumsack, H.‐J. (2009). Paleo‐redox condi‐ tions during OAE 2 reflected in Demerara Rise
sediment geochemistry (ODP Leg 207). Palaeogeography, Palaeoclimatology, Palaeoecology, 273(3‐4), 302–328. https://doi.org/10.1016/j. palaeo.2008.11.005
Higgins, M. B., Robinson, R. S., Husson, J. M., Carter, S. J., & Pearson, A. (2012). Dominant eukaryotic export production during ocean anoxic events reflects the importance of recycled NH4+. Proceedings of the National Academy of Sciences, 109(7), 2269–2274. https://doi. org/10.1073/pnas.1104313109
Hunt, J. M. (1995). Petroleum geochemistry and Geology (2nd ed.). New York: Freeman.
Hutchins, D. A., Fu, F.‐X., Webb, E. A., Walworth, N., & Tagliabue, A. (2013). Taxon‐specific response of marine nitrogen fixers to elevated carbon dioxide concentrations. Nature Geoscience, 6(9), 790–795. https://doi.org/10.1038/ngeo1858
Hutchins, D. A., Fu, F.‐X., Zhang, Y., Warner, M. E., Feng, Y., Portune, K., et al. (2007). CO2control of Trichodesmium N2fixation,
photosynthesis, growth rates, and elemental ratios: Implications for past, present, and future ocean biogeochemistry. Limnology and Oceanography, 52(4), 1293–1304. https://doi.org/10.4319/lo.2007.52.4.1293
Hutchins, D. A., Mulholland, M. R., & Fu, F.‐X. (2009). Nutrient cycles and marine microbes in a CO2‐enriched ocean. Oceanography,
22(4), 128–145. https://doi.org/10.5670/oceanog.2009.103
Jarvis, I., Gale, A. S., Jenkyns, H. C., & Pearce, M. A. (2006). Secular variation in Late Cretaceous carbon isotopes and sea‐level change: Evidence from a newδ13C carbonate reference curve for the Cenomanian‐Campanian (99.6‐70.6 Ma). Geological Magazine, 143(5), 561–608. https://doi.org/10.1017/S0016756806002421
Jarvis, I., Lignum, J. S., Gröcke, D. R., Jenkyns, H. C., & Pearce, M. A. (2011). Black shale deposition, atmospheric CO2drawdown, and
cooling during the Cenomanian‐Turonian Oceanic Anoxic Event. Paleoceanography, 26, PA3201. https://doi.org/10.1029/ 2010PA002081
Jenkyns, H. C. (1991). Impact of Cretaceous sea level rise and anoxic events on the Mesozoic carbonate platform of Yogoslavia. AAPG Bulletin, 75, 1007–1017.
Jenkyns, H. C. (2003). Evidence for rapid climate change in the Mesozoic‐Palaeogene greenhouse world. Philosophical Transactions of the Royal Society of London, Series A, 361(1810), 1885–1916. https://doi.org/10.1098/rsta.2003.1240
Jenkyns, H. C. (2010). Geochemistry of Oceanic Anoxic Events. Geochem.Geophys. Geochemistry, Geophysics, Geosystems, 11, Q03004. https://doi.org/10.1029/2009GC002788
Jenkyns, H. C., Dickson, A. J., Ruhl, M., & Van Den Boorn, S. H. J. M. (2017). Basalt–seawater interaction, the Plenus Cold Event, enhanced weathering and geochemical change: Deconstructing Oceanic Anoxic Event 2 (Cenomanian–Turonian, Late Cretaceous).
Sedimentology, 64(1), 16–43. https://doi.org/10.1111/sed.12305
Jenkyns, H. C., Matthews, A., Tsikos, H., & Erel, Y. (2007). Nitrate reduction, sulfate reduction, and sedimentary iron isotope evolution during the Cenomanian‐Turonian Oceanic Anoxic Event. Paleoceanography, 22, PA3208. https://doi.org/10.1029/2006PA001355 Jones, C. E., & Jenkyns, H. C. (2001). Seawater strontium isotopes, Oceanic Anoxic Events, and seafloor hydrothermal activity in the
Jurassic and Cretaceous. American Journal of Science, 301(2), 112–149. https://doi.org/10.2475/ajs.301.2.112
Junium, C. K., & Arthur, M. A. (2007). Nitrogen cycling during the Cretaceous, Cenomanian‐Turonian Oceanic Anoxic Event II. Geochemistry, Geophysics, Geosystems, 8, Q03002. https://doi.org/10.1029/2006GC001328
Junium, C. K., Meyers, S. R., & Arthur, M. A. (2017). Nitrogen cycle dynamics in the Late Cretaceous Greenhouse. Earth and Planetary Science Letters, 481, 404–411.
Karakitsios, V., Tsikos, H., van Breugel, Y., Koletti, L., Sinninghe Damsté, J. S., & Jenkyns, H. C. (2007). First evidence for the Cenomanian‐ Turonian Oceanic Anoxic Event (OAE2,‘Bonarelli’ event) from the Ionian Zone, western continental Greece. International Journal of Earth Sciences, 96(2), 343–352. https://doi.org/10.1007/s00531‐006‐0096‐4
Kashiyama, Y., Ogawa, N. O., Kuroda, J., Shiro, M., Nomoto, S., Tada, R., et al. (2008). Diazotrophic cyanobacteria as the major photo-autotrophs during mid‐Cretaceous Oceanic Anoxic Events: Nitrogen and carbon isotopic evidence from sedimentary porphyrin. Organic Geochemistry, 39(5), 532–549. https://doi.org/10.1016/j.orggeochem.2007.11.010
Korbar, T., Glumac, B., Cvetko Tešović, B., & Cadieux, S. B. (2012). Response of a carbonate platform to the Cenomanian‐Turonian Drowning and OAE2: A case study from the Adriatic Platform (Dalmatia, Croatia). Journal of Sedimentary Research, 82(3), 163–176. https://doi.org/10.2110/jsr.2012/17
Kraal, P., Slomp, C. P., Forster, A., & Kuypers, M. M. M. (2010). Phosphorus cycling from the margin to abyssal depths in the proto‐Atlantic during Oceanic Anoxic Event 2. Palaeogeography, Palaeoclimatology, Palaeoecology, 295(1‐2), 42–54. https://doi.org/10.1016/j. palaeo.2010.05.014
Kranz, S., Sültemeyer, D., Richter, K.‐U., & Rost, B. (2009). Carbon acquisition in Tri‐chodesmium: The effect of pCO2and diurnal changes.