DIPARTIMENTO DI SCIENZE DELL’AMBIENTE FORESTALE E DELLE SUE RISORSE
CORSO DI DOTTORATO DI RICERCA IN
ECOLOGIA FORESTALE – XX CICLO
An investigation of ozone uptake by plants and
antioxidant effect of plant isoprenoids
Settori Scientifico-Disciplinari – AGR/05, BIO/04
Dottorando: Silvano Fares
Firma __________________________
Coordinatore: Prof. Paolo De Angelis
Firma _____________________________
Tutore: Dr. Francesco Loreto Co-Tutore: Prof. Paolo De Angelis
Università degli Studi della Tuscia
Dipartimento di Scienze dell’Ambiente Forestale e delle sue Risorse (DISAFRI) Via S. Camillo de Lellis, snc 01100 Viterbo
Corso di Dottorato di Ricerca in Ecologia Forestale Coordinatore: Prof. Paolo De Angelis
Tesi di Dottorato di Ricerca in Ecologia Forestale (XX ciclo) di: Silvano Fares
TABLE OF CONTENTS
Summary ... 6
1. Introduction ... 8
1.1 Ozone, a threat for forest ecosystems... 8
1.1.1 Ozone effects on plants and the antioxidant mechanisms of plant protection... 9
1.1.2 Processes of ozone uptake ... 12
1.1.3 Strategies and policies to assess ozone damage ... 13
1.2 Volatile Organic Compounds, a defensive mechanism against oxidative stresses ... 15
1.2.1 BVOC formation and environmental control on emissions ... 17
1.2.2 The antioxidant role of volatile isoprenoids... 20
1.3 Methods to measure BVOC and ozone fluxes... 21
1.3.1 Proton Transfer Reaction Mass Spectrometry (PTR-MS) for BVOC measurement ... 22
1.3.2 Enclosures... 23
1.3.3 Micrometeorological techniques ... 28
1.3.4 Models to estimate and predict ozone and BVOC fluxes... 30
2. Cases of studies ... 33
2.1 Impact of high ozone on isoprene emission and on anatomical and physiological parameters of developing Populus alba leaves directly or indirectly exposed to the pollutant... 33
2.1.1 Aims of the study... 33
2.1.2 Methods ... 33
2.1.2.1 Plant material... 33
2.1.2.2 The cuvettes and the ozone fumigation system ... 34
2.1.2.3 Gas exchange and fluorescence measurements... 36
2.1.2.4 Histological observations of leaf anatomy ... 37
2.1.2.5 Isoprene synthase (PaISPs) RNA isolation and analysis ... 37
2.1.3 Statistics... 38
2.1.4 Results ... 38
2.1.5 Discussion... 44
2.2 Ozone uptake by leaves of different species, and the implications on BVOC emitted 48 2.2.1 Aims of the study... 48
2.2.2 Methods ... 48
2.2.2.1 Plant material... 48
2.2.2.2 Measurement of physiological parameters and ozone injuries... 49
2.2.2.3 Ozone fumigation and measurement of ozone uptake ... 50
2.2.2.4 Biochemical measurements ... 51
2.2.3 Results and discussion... 52
2.2.3.1 Stomatal conductance is the key driver of ozone uptake ... 52
2.2.3.2 The feedbacks between ozone uptake and VOC emission ... 55
2.2.3.3 An investigation of antioxidant systems alternative to isoprenoids ... 59
2.3 Partitioning of ozone sinks in enclosures containing isoprene and monoterpene emitting plants ... 65
2.3.2 Methods ... 65
2.3.2.1 The experimental system... 65
2.3.2.2 The theory for calculation of ozone flux... 69
2.3.3 Results ... 72
2.3.3.1 Wall losses ... 72
2.3.3.2 Populus nigra (exp. a) ... 72
2.3.3.3 Quercus ilex (exp. b)... 74
2.3.3.4 The intercellular ozone concentration in Populus nigra... 80
2.3.4 Discussion... 81
2.3.4.1. Isoprene-ozone interaction... 81
2.3.4.2 A hypothesis about the intercellular concentration of ozone ... 82
2.4 Characterization of a dune vegetation Ecosystem: BVOC emission and possible involvement in ozone-forming reactions... 84
2.4.1 Aims of the study... 84
2.4.2 Methods ... 85
2.4.2.1 Site specifications ... 85
2.4.2.2 Vegetation... 85
2.4.2.3 Experimental set up and measurements ... 86
2.4.3 Results and Discussion ... 88
3. Conclusions ... 95
4. References ... 98
Ringraziamenti ... 116
Legend to Tables Table 1: Anatomical features of leaves expanding above the cuvettes, and of leaves developing inside the cuvettes since the beginning of the ozone treatment... 40
Table 2: Quantum yield of PS2 in darkened leaves and in illuminated leaves. ... 42
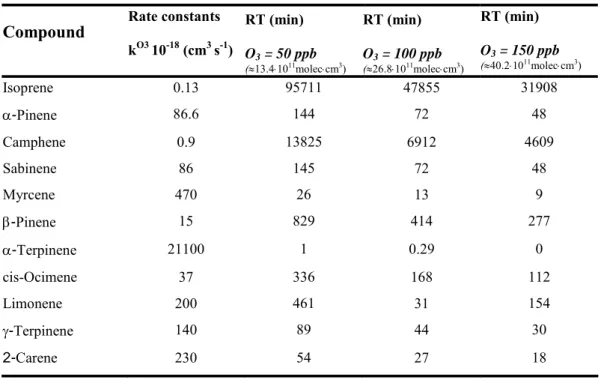
Table 3: Main isoprenoids emitted by plants and their rate constants with ozone and retention time in the enclosure at different ozone levels. ... 57
Table 4: H2O2, malonyldialdehyde, total phenolics and ascorbic acid concentration of leaves of NC-S and NC-R clones of Trifolium repens. ... 61
Table 5: Most abundant monoterpenes emitted from Quercus ilex... 75
Table 6: Ozone concentrations at the inlet of the reaction chamber, absolute, relative ozone losses, and reaction rates.. ... 79
Table 7: Blend of isoprenoids emitted, photosynthesis and stomatal conductance by the plant species in the experimental area of Castelporziano, Rome, central Italy. ... 86
Legend to Figures Figure 1: Scheme of a crosscut through one stomatal pore and stomatal and non stomatal fluxes of ozone.. ... 9
Figure 2: BVOC emission % over the total estimated emission. ... 16
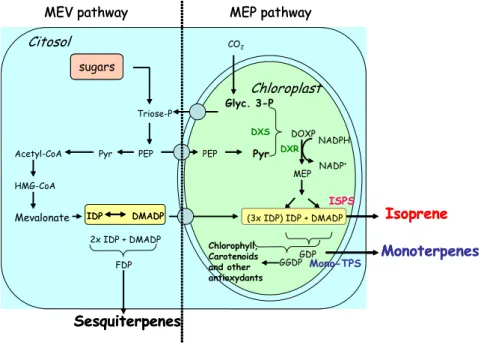
Figure 3: Synthesized overview of isoprenoids metabolic pathways localized into the cytosol (MEV) and into the chloroplasts (MEP) of plants... 18
Figure 4: Examples of cuvette systems for measurements of plant BVOC and physiological parameters... 24 Figure 5: View of the experimental system used for ozone fumigation in case-stuy 1... 34 Figure 6: Effects of ozone fumigation on fully expanded leaves directly exposed to the
pollutant... 39 Figure 7: Light microscopy images of sections of leaves developing in the cuvettes during
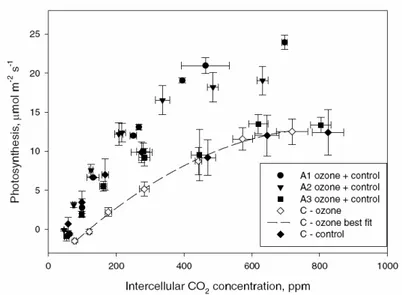
the experiment. ... 40 Figure 8: Photosynthesis response to intercellular CO2 concentration in leaves expanding
above the cuvettes, and in leaves developing inside the cuvettes since the beginning of the ozone treatment... 41 Figure 9: Electron microphotograph of cells of the third leaves expanding above the cuvettes
in which ozone was (A) or was not fumigated (B)... 43 Figure 10: Emission of isoprene in leaves expanding above the cuvettes, and in leaves
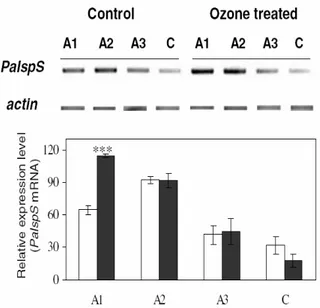
developing inside the cuvettes since the beginning of the ozone treatment... 43 Figure 11: Expression analysis of isoprene synthase mRNA (PaISPs) in Populus alba leaves
expanding above the cuvettes, and in leaves developing inside the cuvettes since the beginning of the ozone treatment.. ... 44 Figure 12: Ozone uptake related to the stomatal conductance of different plant species. ... 52 Figure 13: Emission of VOC, stomatal conductance, ozone flux, and photosynthesis, of two
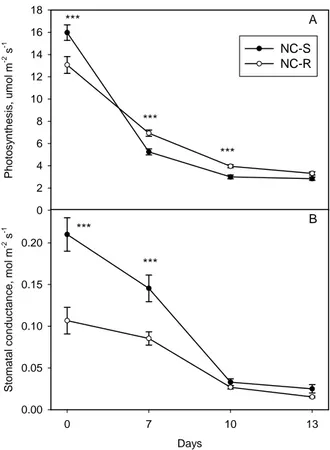
sets of Populus nigra.. ... 54 Figure 14: Photosynthesis and stomatal conductance of a resistant (NC-R) and a sensible
(NC-S) clone of Trifolium repens cv “Regal”. ... 55 Figure 15: Ozone uptake by leaves of two plant species that do not emit isoprenoids
(Nicotiana tabacum and Betula pendula), by a species emitting monoterpenes, Quercus
ilex, and by two species emitting isoprene, common reed and white poplar.. ... 56
Figure 16: Ozone damage in leaves naturally emitting volatile isoprenoids (Quercus ilex,
Phragmites australis, and Populus alba) and in leaves of plants that do not emit
isoprenoids but were fumigated with 3 ppm of exogenous isoprene during the ozone treatment (Betula pendula and Nicotiana tabacum)... 59 Figure 17: Oxygenated VOC emission before and at the end of the ozone fumigation on
NC-S and NC-R clones of Trifolium repens. ... 62 Figure 18: Set up of the experiment using two coupled chambers with Quercus ilex in
case-study 2. ... 68 Figure 19: Emission of isoprene and of isoprene reaction products, methyl-vinyl-ketone and
methacrolein, during different light conditions before and during ozone fumigation of poplar plants in a typical experiment in CSTRs... 73 Figure 20: Relationship between ozone conductance and stomatal conductance to ozone in
plant cuvettes experiments with poplar plants... 74 Figure 21: Percent ozone uptake in response to photosynthetic photon flux density during
different days in Quercus ilex plants. ... 76 Figure 22: Relationship between ozone conductance and stomatal conductance in plant
cuvettes experiment with Quercus ilex plants.. ... 77 Figure 23: Percent ozone uptake and stomatal conductance to ozone in Quercus ilex plants
exposed to ambient or low CO2... 78
Figure 24: Time course of ozone concentrations exiting the reaction chamber when ozone concentration at the inlet of the reaction chamber was 89 ppb and monoterpene concentration generated in the plant chamber by four Quercus ilex illuminated plants was 50+11 ppb, under different PPFD levels in the reaction chamber.. ... 79
Figure 25: relationship between [O3]ci and ozone flux for Populus nigra. ... 80
Figure 26: Overview of the experimental site inside Castelporziano Estate, central Italy. ... 87 Figure 27: Polar plots showing percentage of wind distribution and ozone concentration
during night and day hours in Castelporziano Estate, central Italy... 89 Figure 28: Ozone concentration in Castelporziano Estate, central Italy and in Montelibretti
EMEP station, 25 Km north from Rome city center, central Italy. ... 90 Figure 29: Fluxes of Oxygenated compounds compounds and isoprenoids measured with a
PTR-MS in the Estate of Castelporziano, central Italy.. ... 91 Figure 30: Daily corse of BVOC emission in Castelporziano Estate, central Italy... 91 Figure 31: Measured and modeled emission of isoprenoids at Castelporziano Estate, central
Italy... 93 Figure 32: Relationship between BVOCs fluxes and ozone concentration at Castelporziano
Summary
Ozone is a pollutant and oxidant molecule for humans and plants in the atmosphere, present in the range of parts per billion (ppb). Plant ecosystems represent a sink for ozone, although the mechanisms of removal and the damages are still unclear. The aims of this PhD study were a) to investigate the capacity of plants to remove atmospheric ozone, b) to partition between stomatal and non-stomatal components of the ozone flux c) to determine if BVOC (Biogenic Volatile Organic Compounds) emitted by the plant can scavenge ozone, in turn detoxifying the plant. The approach of the study was the use of cuvette systems, namely enclosures. Different of these enclosures were used, containing portions of leaves, entire leaves or the all plants. The uptake of ozone (ozone removed by the plant) was calculated considering the difference in ozone concentration between the inlet and the outlet of the enclosure. The work is articulated in a general introduction on ozone effects on plants and BVOC emission, including the state of the arts on these topics. Following are presented 4 cases of study, each one focussing the attention on different aspects of the plant-ozone-BVOC interactions. Results showed that the main responsible for ozone uptake are stomata, and BVOC emitted by the plants (isoprene and monoterpenes) increase the detoxification and the ozone uptake, thus suggesting that the notion that ozone damage is proportional to ozone uptake is not always correct.
Sommario
L’ozono è una molecola inquinante ed ossidante per le piante e per gli esseri umani, presente in atmosfera nell’ordine di parti per bilione (ppb). Gli ecosistemi vegetali riescono a rimuovere ozono dall’atmosfera, sebbene i meccanismi di rimozione ed i danni che l’ozono provoca non sono ancora stati completamente svelati. Gli obiettivi di questo dottorato sono stati a) verificare la capacità delle piante nel rimuovere ozono in bassa troposfera, b) distinguere tra componente stomatica e non stomatica del flusso di ozono, c) determinare se i BVOC (Biogenic Volatile Organic Compounds – Composti Organici Volatili Biogenici) emessi dalle piante hanno funzione antiossidante, contribuendo a rimuovere ozono prima che questo entri in contatto con le pareti cellulari. Lo studio è stato condotto principalmente mediante l’uso di cuvette contenenti porzioni di foglie, intere foglie o intere piante. La tesi è
articolata in una introduzione in cui vengono descritti gli effetti dell’ozono sulle piante e l’emissione di BVOC, inquadrando lo stato delle conoscenze in questo specifico settore dell’ecofisiologia. A seguire, vengono descritti 4 casi di studio, ognuno dei quali approfondisce un diverso aspetto delle interazioni ozono-BVOC. I risultati mostrano che l’apertura stomatica controlla gran parte del flusso di ozono, ed i BVOC emessi dalle piante (isoprene e monoterpeni) contribuiscono a rimuovere ozono aumentando il flusso totale, ed invalidando la teoria per la quale il danno da ozono è proporzionale al flusso stomatico.
1. Introduction
1.1 Ozone, a threat for forest ecosystems
Ozone (O3) can be considered as a greenhouse gas, since it may be responsible of an increase
of temperature of 0.5 °C after the industrial revolution (IPCC 2001, Shindell et al. 2004). Ozone is a very reactive molecule, which is rapidly formed and destroyed in the atmosphere. Ozone is present in the low troposphere in the range of 0 to more than 100 ppb depending of the abundance of its precursors, mainly NOx (nitrogen oxides) and VOC (biogenic and anthropogenic Volatile Organic Compounds), through a photochemical cycle (Prinn, 2003; Monks, 2005). Reactions below describe this cycle in a simplified way:
O O hv O2+ → + (R1) O NO hv NO2+ → + (R2) M O M O O+ 2 + → 3 + (R3) 2 2 3 NO O O NO+ → + (R4)
being hv the UV radiation, M a general molecule absorbing excess energy and allowing the stabilization of O3, NO and NO2, respectively, nitrogen monoxide and nitrogen dioxide.
High presence of atmospheric NO favours the rate of removal of O3, but the presence of
VOC can increase the ratio NO2/NO by reacting with hydrossilic radicals (HO•) and forming
other radical species (alchiperoxyradical, RO•, and hydroperoxyradical, HOO•):
2 NO RO ROO NO+ • → •+ (R5) 2 NO HO HOO NO+ • → •+ (R6)
Ozone concentration in the troposphere is increasing due to increasing production of precursors (Chameides 1988). In clean air, an equilibrium between ozone formation and in situ photochemical destruction and deposition at the earth’s surface is reached (Roelofs and Lelieveld 1997) resulting in a daily “mixing ratio” of 10 to 40 ppb. The background concentration (a level not directly interested by local anthropogenic influence) is continuously increasing (Virganzan 2004) and levels exceeding 60 ppb, considered as
phytotoxic, are predicted to occur in year 2100 on 50% of the global forest area (Fowler et al. 1999). Ozone has also other important chemical interactions, forming reactive hydroxyl radicals (OH), and thus influencing the retention time of many gasses in the atmosphere (Prinn 2003). Ozone is also involved in nucleation events when reacting with VOC, leading to aerosol and particle formation (Bonn and Moortgat 2003).
1.1.1 Ozone effects on plants and the antioxidant mechanisms of plant protection
Since the sixties, scientists started to focus the attention on the negative effects of ozone on vegetation (Berry and Ripperton, 1963). Ozone is now considered the most dangerous oxidant molecule for plants. Chronic stresses with exposure to moderate ozone concentrations usually produce biochemical and physiological changes (Darrall, 1989; Sandermann et al. 1997; Zheng et al. 2002). The attack of ozone to the chloroplast membranes inhibits the ribulose bisphosphate carboxylase/oxygenase enzyme (Rubisco) leading to a limited carbon assimilation by photosynthesis and a decrease in plant growth (Guderian et al. 1985). Exposure to acute tropospheric ozone levels leads to visible injuries (Bussotti et al. 2003; Vollenweider and Gunthardt-Georg 2005).
Plants act as a sink for ozone, adsorbing it by cuticle deposition or absorbing it thorough stomatal apertures (Fig. 1).
O3ci No n-stom atal O3flu x St om at a l O3 fl u x O3ci No n-stom atal O3flu x St om at a l O3 fl u x
Figure 1: Scheme of a crosscut through one stomatal pore and stomatal and non stomatal fluxes of ozone. O3ci is the intercellular ozone concentration.
The first process is relevant only under high surface moisture (Altimir et al. 2006). Chronic exposures to ozone can however damage the cuticle of plants, negatively modifying the
protective action of cuticle. For instance, wax denaturation by ozone may increase cuticular water loss, increasing leaf permeability, and thus negatively affecting the water balance (Shreuder et al. 2001). However, Paoletti et al. (2006) observed an increase of wax formation under acute ozone stress, and Vanhatalo et al. (2000) found an increase of wax formation when high chronic ozone was associated to high CO2 levels. The stomatal absorption of
ozone is often dominant (UNECE 2004), because permeability of ozone through the cuticle is very low (0.001 mm s-1,Kerstiens and Lendzian, 1989). This aspect will be analyzed more in detail in the next chapter. In conditions of intense light, ozone damage is increased both when stomata are closed, and when they are fully opened. In the first case, the energy in excess captured by the photosystems is not quenched by the electron transport, due to the limited amount of CO2 at the carboxylation site. This, and the large amount of reactive
oxygen species formed by ozone, rapidly leads to photoinhibition (Guidi et al. 2002). In the second case, the high amount of ozone entered through stomata reacts directly with cell surfaces, and indirectly induces the formation of free radicals, with a cascade of negative effects on plant physiology and biochemistry.
It is still unclear which are the reactions that ozone drives inside the cells, and that lead to cellular damage. A first mechanism of damage is the direct membrane peroxydation which alters membrane permeability (Heath, 1994) and results in an accumulation of end-products of lipid peroxydation such as malonyldialdheyde (MDA) (Heath and Parker 1968). Most probably however ozone indirectly affects the denaturation of membrane lipids (Pell et al. 1997) rapidly reacting with all compounds in the apoplast and in the gas phase, and generating reactive oxygen species (O′2, OH′, and H2O2, collectively denoted as ROS
(Reactive Oxygen Species)). ROS are per se strong oxidants and also act as signal molecules in plants. ROS start hypersensitive responses, including the activation of ethylene, salycilic acid and jasmonate, and lead to programmed cell death in response to ozone (Kangasjarvi et al. 2005). The main effects of ozone on cell structures are the increase of thylacoid size (Sutinen et al. 1990), the production of plastoglobules (Holopainen et al. 1996), and a collapse of the mesophyll cells with H2O2 accumulation in the cytoplasm
(Oksanen et al. 2004).
Plants respond to ozone stress with different antioxidant mechanisms. Volatile isoprenoids produced by the leaf may lead to hydroperoxides when reacting with ozone (Hewitt and Kok 1991; Taylor et al. 1999), but other studies have shown that VOC may actually remove ROS
in leaves (Loreto and Velikova 2001; Loreto et al. 2004). The Halliwell-Asada cycle removing ROS formed through the direct photoreduction of ozone by an array of antioxidant enzymes (superoxide dismutase (SOD), ascorbate peroxidase (APX), monodehydroascorbate reductase (MDAR) and glutathione reductase (GR)), and their metabolites, is one of the most powerful mechanisms of protection against ROS (Foyer et al. 1994; Strohm et al. 2002; Edreva 2005). Ascorbic acid (AA, Vitamin C) is a particularly well studied compound of this defensive line in the apoplast, being capable of scavenging the harmful radicals (especially H2O2) produced in endogenous metabolism and in response to environmental stresses
(Smirnoff 2000; Arrigoni and De Tullio 2000). AA has been detected in the majority of plant cell types, their organelles, and in the apoplast. The ability to donate electrons in a wide range of enzymatic and non enzymatic reactions makes AA the main reactive oxygen species-detoxifying compound in the aqueous phase. Studies with AA deficient mutants and clones (Conklin et al. 1996, 2000) have related the low concentration of AA in the plant tissue to deficient growth and enhancement of ozone sensitivity. Moreover, AA regenerates tocopherol from tocopherolxyl radical providing further indirect membrane protection (Thomas et al. 1992).
The increase in the synthesis of phenolic compounds is another common response to environmental stresses in plants (Dixon and Paiva, 1995). Phenols constitute several secondary metabolites (flavonoids, tannins, hydroxycinnamate esters and lignin) abundant in plant tissues (Grace and Logan, 2000) and have different protective functions in plants (e.g. protection from grazing, protection from UV light, and biocidal effects against bacteria and fungi). Polyphenols possess ideal structural chemistry for free radical scavenging activity, as they are high reactive as hydrogen or electron donor and can be involved in the hydrogen peroxide scavenging cascade in plant cells (Takahama and Oniki, 1997). Chloroplast-located flavonoids were found to effectively scavenge singlet oxygen (Agati et al. 2007).
Some studies confirmed the hypothesis that ROS act as signal molecules for gene expression of plant metabolites in stress condition. Pellinen et al. (1999) found that H2O2 is a signal for
1.1.2 Processes of ozone uptake
Forests act as a sink for ozone. Ozone disappears when reacting in the gas phase or when making contact with cuticles and apoplastic compounds. These reaction processes are controlled by transport phenomena. At a canopy scale, the transport of air masses containing ozone is driven by wind turbulence. At a leaf scale, the transport of ozone consists in the diffusion through stomatal pores (Marrero and Mason, 1972; Laisk et al. 1989). The fate of ozone after entering the stomata is not fully understood. The rate of ozone scavenged by the plant, normalized per time unit and unit area (usually a leaf surface) is termed “ozone flux”. This term will be mentioned very often in this thesis, together with the term “ozone uptake”. Uptake refers to the ozone concentration scavenged by the leaf (or the plant). It will be expressed as a concentration (ppb) or as a % of the atmospheric ozone concentration impinging the leaf (or the plant), without scaling to time and area.
As shortly described in chapter 1.1.1 (Fig. 1), ozone flux inside leaves has two components. The first component is ozone adsorption (by stems, cuticles, and, in general, external surfaces), also called non-stomatal, dry and wet deposition. At the cuticle level, ozone can react with a multitudes of waxes, salts, ions, biogenic and anthropogenic VOC and many other compounds, especially in conditions of wetness (Altimir et al. 2006). The percentage of non-stomatal ozone flux over the total ozone flux in a Mediterranean ecosystem was found consistent, reaching up to 60 % over the total ozone flux (Gerosa et al. 2005). Similar results were found by Kurpius and Goldstein (2003), which attributed a large part of the non-stomatal ozone flux to gas phase reactions between ozone and VOC outside the leaf. The second component is the absorption of ozone through stomatal pores. This is often the major component of the total ozone uptake by leaves. Stomatal conductance to ozone is also a flux which represents the reciprocal of the sum of an array of resistances that ozone meets along the path from outside the leaf to the reaction site inside the apoplast. The dominant resistances at a leaf level are the boundary layer (the relatively unstirred layer of air surrounding the leaf), the stomata apertures, the mesophyll tissue and, if ozone has not yet been fully scavenged, the chloroplasts. Stomatal conductance to gases is calculated once the flux and the concentration gradient between outside and inside the leaf are measured or calculated. The intercellular concentration of ozone is thought to be zero (Laisk et al. 1989) because of the fast reactions occurring with the cell walls. However, Moldau and Bikele
(2002) demonstrated by exposing only one side of a leaf to high ozone that the intercellular concentration of ozone could be higher than zero, hypothesizing that in conditions of high atmospheric ozone, the molecule does not completely disappear through reactions in the apoplast, thus accumulating in the intercellular spaces (Fig. 1) and decreasing the ozone gradient between intercellular spaces and outside the leaf. If this theory is true, the actual methods to calculate ozone fluxes would lead to an overestimation of the flux. Further details will be given in case study 3. Ozone absorption increases with increasing stomatal opening. The latter is regulated by environmental variables such as light, temperature and water availability in the plant-soil system (Löw et al. 2006). The light dependency of ozone uptake suggests a very high absorption level in comparison to the adsorption level (Fredericksen et al. 1996), although the above mentioned flux studies at ecosystem level lead to the conclusion that the non-stomatal flux is also considerable. Moreover, Musselmann and Minnick (2000) measured high levels of stomatal uptake of ozone during night, when stomatal aperture is supposed to be limited. The mechanisms of nocturnal stomatal uptake of ozone are still unclear. Other studies (Vitale et al. 2007) showed that acute ozone exposures can increase stomatal aperture and maintain stomata open at night.
Although ozone damages plants through deposition on the cuticles (Paoletti et al. 1998), it is reasonable to assume that ozone damage mainly occurs via stomata, and partitioning between the two mechanisms is important for ozone risk assessment. This aspect will be considered in the next paragraph.
1.1.3 Strategies and policies to assess ozone damage
Ozone is the more dangerous oxidant molecule for plant ecosystems, with detrimental effects on forests and crop yield (Karenlampy and Skarby, 1996), in turn decreasing the benefits (economical, social) that natural and cultivated plant ecosystems can offer. Since 1985, several working groups belonging to UNECE (United Nations Economic Commission for Europe) - CLRTAP (Convention on Long Range Transboundary Air Pollution) were set to study air quality and to implement air quality standards. The International Cooperative Programme (ICP) was funded with the aim of monitoring different forest areas over Europe (level I approach), particularly studying crown conditions, chemical composition of leaves
and soils upon ozone exposure. An intensive monitoring activity of ozone damage was successively started, based on many other parameters such as the micrometeorology of the experimental sites, and the deposition of the pollutants on leaves (level II approach). Currently, 39 countries participate to the programme. In Italy, the EC decisions within the ICP programme were adopted through different national programmes. In particular, in 1995 the CONECOFOR (Integrated National Programme for the Control of Forest Ecosystems) was started, with 31 permanent monitoring sites representing the most representative ecosystems where the directives of the ICP-level II approach are applied.
Translating the political scheme into scientific findings, the systematic ozone monitoring started at the end of 80s and the first approach was to determine the effects of ozone on plants, by comparing the damage with the tropospheric ozone concentration measured with passive samplers (Buffoni, 2002). The term “exposure” was used to indicate the amount of ozone concentration occurring near to the experimental sites. A critical level of ozone for vegetation, the concentration of ozone after which damage to vegetation occurs, was established. The most used index of damage was the AOT40 (Accumulated Ozone over a Threshold) (Karenlampy and Skarby 1996; Fuhrer et al. 1997), expressed as the sum of average hourly ozone concentrations exceeding 40 ppb during the day hours in which the global radiation is equal or above 50 W m-2 (equation 1).
[
O t AOT Wm Rad O ∆ − =∑
− > > 2 3 50 . 40 ] [ 3 40 ] [ 40]
(1)The night hours were excluded since night ozone concentrations are often negligible. The AOT40 for forest ecosystems was fixed at 10000 ppbh averaged on 5 years during the vegetative season.
In several cases, atmospheric concentration not always correlated with the to ozone damage. As a result, the critical dose (level I) approach has been criticised in the last years because it does not take into account the physiology of plants and the effective dose of ozone absorbed by plants. For instance, drought stress in Mediterranean area induce stomatal closure, with the consequent limitation of ozone uptake by stomatal absorption even at high tropospheric ozone concentrations (Emberson et al. 2007). This may result in a much lower damage than predicted by the AOT40 index. In order to establish a cause – effect relationship considering only the effective concentration of ozone entering the leaf, a flux-based index proposed by
the level II approach seems more tenable. A short description of the model and its parameterization is reported in chapter 1.3.4.
A critical level (AFstY, accumulated stomatal flux of ozone (Fst) above a flux threshold (Y))
derived as the sum over time of the differences between hourly mean values of Fst and Y for
the period when Fst exceeds Y) can be then calculated. Karlsson et al. (2004) proposed for
birch and beech a flux threshold (Y) of 1.6 nmol m-2 s-1 (AFst1.6), and found that a value of
cumulative stomatal ozone flux of 4 mmol m-2 over a growing season caused a 5% reduction in biomass under the experimental conditions.
The scientific recommendation for planning air quality standards promoted by the UNECE mapping manual in 1996 were originally based on the level I approach, but the last UNECE protocol (2004) underlined the need to adopt the flux-based approach because it is more physiologically relevant. The next 2008 mapping manual will probably adopt the level II approach.
A parallel approach to determine ozone levels and injuries to vegetation is the use of bioindicators. A largely used bioindicator is tobacco, being some cultivars of this plant species (e.g. Nicotiana tabacum cv Bel-w3), very sensitive to ozone (Beauchamp et al. 2005). An ICP protocol (2006) suggests the use of two clones (sensitive vs. resistant) of white clover (Trifolium repens cv. regal) or brown knapweed (Centaurea jacea) to assess the risk of ozone injuries, especially in rural areas where ozone concentration cannot be directly measured. Clover clones were used in experiments simulating exposure to high tropospheric levels of ozone (D’Haese et al. 2005; Ferreira Severino et al. 2007; Crous et al. 2006) and in this study (see case study 2).
1.2 Volatile Organic Compounds, a defensive mechanism against oxidative stresses
Plants emit in the atmosphere Biogenic Volatile Organic Compounds (BVOC), and emissions are estimated at 1-1.5 TgC year-1 on a global scale (Guenther et al. 1995, Fig. 2). These emissions account for no more than 3% of the total carbon exchange between biota and the atmosphere (Kesselmeier and Staudt 1999; Crutzen et al. 1999), but they play an indirect and often important role in the oxidative chemistry of the atmosphere, consuming hydroxyl radicals and consequently the lifetime of radiatively active trace gases like methane (Brasseur and Chatfield, 1991). Even more importantly, BVOC may contribute, in the
presence of anthropogenic pollutants, namely NOx, to the formation of ozone, photochemical smog, and particulate matter (Chameides et al. 1988; Kavouras et al. 1998; Di Carlo et al. 2004). In non-stressed conditions, isoprenoids are the main constituent of BVOC, and forest plant species are the most important isoprenoid emitters (Kesselmeier and Staudt, 1999).
Isoprene (44 %) Monoterpenes (11 %) other BVOC ( 43 %)
Figure 2: BVOC emission % over the total estimated emission (1150 Tg C y-1) based upon Guenther et al. (1995) inventory.
Isoprene (2 mehyl-1,3 butadiene), is a monomer of 5 carbon atoms and the most abundant isoprenoid, accounting for about half of the total emission of BVOC into the atmosphere (Guenther et al. 1995; Fuentes et al. 2000).
Monoterpenes are 10-carbon atoms very representative emitted by plants, especially oak species (Loreto, 2002) in the regions with Mediterranean climate. The most abundant monoterpenes species emitted are linalool, α- and pinene, limonene, and cis and trans β-ocimene. These compounds are emitted by a large class of tree species. Moreover, a large group of plants evolved the capacity to store monoterpenes in specialized organs like ducts or glands. In these plants, monoterpenes are massively emitted when storage organs are broken under mechanical stress (Alessio et al. 2004). Even if monoterpene emission is lower than isoprene at a global scale (Guenther et al. 1995), monoterpenes play a more decisive and important role in the atmospheric chemistry, because they react faster than isoprene with pollutants like ozone and NOx (Atkinson et al. 1997), and because monoterpenes contribute to form particles and secondary organic aerosols (Kanakidou et al. 2005; Lee et al. 2006; Iinuma et al. 2007) .
Sesquiterpenes are 15-carbon BVOC and they are synthesized by plants also emitting isoprene or monoterpenes. Due to their high reactivity, often higher than for monoterpenes, they are very important in the chemistry of the atmosphere, but difficult to measure for their fast reaction in the atmosphere. They have been reported to be emitted by vegetation of southern and central Europe (Seufert et al. 1997).
A second class of BVOC is represented by the oxygenated hydrocarbons (OVOC). Methanol is one of the most abundant compound among the emitted OVOC, especially in developing leaves, being an indicator of leaf expansion (Nemecek-Marshall et al. 1995). Other compounds emitted in response to injury are methyl-jasmonate and ethylene (Farmer and Ryan 1990), acetaldehyde (Kreuzwieser et al. 1999), methyl-butenol (Goldan et al. 1993), and C-6 compounds formed by the breakdown of membrane lipids (Hatanaka, 1993) which are responsible for the “green leaf smell” of cut vegetation.
1.2.1 BVOC formation and environmental control on emissions
The pathway of formation of isoprene and monoterpenes is strictly dependant on photosynthesis. This was postulated by early studies based on the observed light dependence of isoprenoid emission (Loreto and Sharkey, 1990) and on the complete and fast labelling of the skeleton of volatile isoprenoids, reminiscent of the labelling pattern of photosynthesis intermediates (Loreto et al. 1996). Isoprene and monoterpenes are formed through a chloroplastic pathway described by Lichtentaler et al. (1997) on the basis of experiments of intramolecular labelling showing a characteristic pattern for the moiety derived from chloroplastic carbon. This isoprenoids biosynthesis is called “MEP pathway” from the specific intermediate 2-methyl-D-erythritol 4-phopshate formed by reactions between cytosolic pyruvate, and the photosynthesis intermediate glyceraldehyde-3-phosphate (Fig. 3). Further details on the metabolic pathways are given in Laule et al. (2003). The contribution of the cytsolic pathway of isoprenoid formation, often called mevalonic or MEV pathway (Fig. 3), to the formation of volatile isoprenoids in the chloroplasts is still under debate. It appears that a cross-talk between the two pathways exist (Laule et al. 2003), and that the non-chloroplastic pathway may supply considerable amount of carbon for isoprene
formation under heavy stress conditions that inhibit photosynthesis (e.g. drought stress, Brilli et al. 2007). DOXP Pyr MEP Glyc. 3-P
PEP PEP Pyr
Triose-P Isoprene GDP GGDP CO2 Acetyl-CoA HMG-CoA
Mevalonate IDP DMADP (3x IDP) IDP + DMADP
sugars ISPS Mono-TPS NADPH NADP+ DXR 2x IDP + DMADP FDP DXS
MEV pathway MEP pathway
Sesquiterpenes Chloroplast Citosol Monoterpenes Chlorophyll, Carotenoids and other antioxydants DOXP Pyr MEP Glyc. 3-P
PEP PEP Pyr
Triose-P Isoprene GDP GGDP CO2 Acetyl-CoA HMG-CoA
Mevalonate IDP DMADPIDP DMADP (3x IDP) IDP + DMADP(3x IDP) IDP + DMADP
sugars sugars ISPS Mono-TPS NADPH NADP+ DXR 2x IDP + DMADP FDP DXS
MEV pathway MEP pathway
Sesquiterpenes Chloroplast Citosol Monoterpenes Chlorophyll, Carotenoids and other antioxydants
Figure 3: Synthesized overview of isoprenoids metabolic pathways localized into the cytosol (MEV) and into the chloroplasts (MEP) of plants. Evidence was given to the main intermediate biosynthetic products (in black), on the enzymes (coloured, respectively 1-deoxy-D-xylulose phosphate synthase and deoxy-D-xylulose 5-phosphate riductase in green, isoprene synthase in red, and monoterpene synthases in blue).
The last step of isoprene synthesis is under the control of isoprene synthase, a light-activated enzyme that catalyzes the elimination of pyrophosphate from dimethylallyl diphosphate (DMADP, Silver and Fall, 1991; Wildermuth and Fall, 1996). Isoprene emission can be regulated by substrate availability or by enzyme activity, as explained more in detail below. The biosynthesis of monoterpenes and other chloroplastic isoprenoids (e.g. carotenoids) occurs by successive addition of branched chains, each chain consisting of one molecule of DMADP and of its isomer, IDP (isopentenyl diphosphate). Monoterpenes are synthesized by the head to tail condensation of DMADP and IDP to form geranyl diphosphate (GDP, Ruzika, 1953). GDP is then transformed in monoterpenes. Interestingly, while isoprene is the main C-5 compound emitted by the MEP pathway, the blend of monoterpenes emitted by the plant is highly variable and species-specific. The monoterpenes are produced under the catalytic action of specific enzymes, each one responsible for the biosynthesis of only one product or of a blend of different products. Many of these enzymes have been found, but other still wait for proper identification and description of their catalytic properties (Tholl et
al. 2005; Laule et al. 2003). The most abundant monoterpenes emitted from Quercus ilex were measured in this study and are listed in table 3.
As for isoprene, also monoterpene biosynthesis is light-dependent. The light dependence reflect the availability of the precursor, and, ultimately, the availability of photosynthetic carbon that enter the biosynthetic pathway. Both isoprene and monoterpene emissions are temperature dependent. Temperature primarily affects the activation state of the enzymes involved in isoprenoid biosynthesis, rather than substrate production. Being the Q10 of enzyme activity typically between 2 and 4 (that is, an increase of 10°C results in a 2 to 4 time higher production of the final compound), isoprenoid emission is mainly controlled by temperature, especially at temperatures between 20 and 45 °C. The latter is the optimal temperature of isoprene synthase, being the enzyme rapidly denatured at higher temperatures (Monson et al. 1992).
The emission of isoprenoids seems to be insensitive to small variations of atmospheric CO2
(Loreto and Sharkey, 1990; Loreto et al. 1996) but other experiments have shown that growth at elevated temperatures may inhibit isoprene (Rosenstiel et al. 2004; Scholefield et al. 2004) and monoterpene (Loreto et al. 2001) emission. Why rising CO2 negatively affects
isoprenoid biosynthesis and uncouples the process of isoprenoids formation from photosynthesis is unknown. It has been hypothesized that at high CO2 respiration could more
successfully compete for a common metabolic precursor in the cytosolic, pyruvate (Rosenstiel et al. 2004), although recent experiments do not support this view (Loreto et al. 2007). It should be mentioned that the concurrent increase of temperature caused by CO2
accumulation in the atmosphere (IPCC, 2001) may offset the CO2-driven reduction of
isoprenoids, eventually leading to an increase of the net isoprenoid emission.
The biosynthesis of sesquiterpenes occurs in the cytosol, and can be shortly described as a further addiction of 2 IDP molecules to the DMADP to form Farnesyl diphosphate (FDP), successively transformed to sesquiterpenes through enzymatic reactions (Laule et al. 2003). The oxygenated volatile organic compounds (OVOC) are formed through processes which are not as directly related to photosynthesis as in the case of isoprene and monoterpenes. OVOC emissions are often caused by biotic and abiotic stresses. Methanol is formed from the demethylation of pectins in cell walls (Galbally and Kirstine, 2002). Large but transient releases of methanol in the atmosphere may be associated to cell wall damage occurring because of wounding (Karl et al. 2001). However, methanol can be also released by rapidly
expanding leaves (Nemecek-Marshall et al. 1995) and by senescing leaves, perhaps again because of irreversible decomposition of cell walls (Fall, 2003).
C-6 compounds (primarily hexenal, hexanal, hexenol) are formed from the breakdown of membrane lipids, predominantly those made by unsaturated fatty acids, under the action of lipoxygenase and hydroperoxide lyase enzymes (Hatanaka, 1993). C-6 emissions are always observed after mechanical stresses (Loreto et al. 2006). Recently, however, emission of C-6 compounds has been also reported as a consequence of insect feeding, high temperature (Loreto et al. 2006), or ozone exposure (Heiden et al. 2003). Beauchamp et al. (2005) observed a good relationships between ozone uptake and C-6 compound emissions, indicating that the emission was probably related to the ozone damage to membranes.
Acetaldehyde is predominantly formed by the enzymatic oxidation of ethanol, which is formed in roots under anoxic conditions and is then translocated to leaves through the transpiratory stream (Kreuzwieser et al. 1999). Acetaldehyde is also emitted following wounding (Fall et al. 1999) and ozone stress episodes (Cojocariu et al. 2005). The release of acetaldehyde is associated to the amount of ozone to which the leaves have been exposed, but the biochemical origin of this pool of acetaldehyde is still elusive (Cojocariu et al. 2005).
1.2.2 The antioxidant role of volatile isoprenoids
Why isoprenoids are emitted by plants giving away a considerable fraction of the fixed carbon, especially under stress conditions? It was observed that isoprenoid emission is stimulated in plants that have been exposed to stress conditions, namely drought (Sharkey and Loreto, 1993) and ozone (Loreto et al. 2004). In 1995, Sharkey and Singsaas found that isoprene is involved in a mechanism of thermal protection. They observed that the photosynthetic machinery of isoprene-emitting leaves was more resistant to high temperature than in non-emitting leaves. More recently, Loreto et al. (2001), attributed to isoprene a more general antioxidant role after observing improved protection from ozone damage in isoprene emitting leaves or in leaves exposed to exogenous isoprene during ozone treatment. Further experiments demonstrated that reactive oxygen species (H2O2, singlet oxygen) are reduced,
and membranes are better preserved in isoprene emitting leaves than in non-emitting leaves, after an ozone treatment (Loreto and Velikova, 2001). Sharkey and Yeh (2001) raised the
hypothesis that the lipophylic isoprenoids interact with lipids in membranes, strengthening membrane resistance to stresses. Theoretical confirmation of this action has been recently obtained (Siwko et al. 2007). This action may usefully defend leaf structure against both high temperature and ozone stress. Isoprenoids may also scavenge pollutants in the intercellular spaces reducing the potential level of reactive oxygen species that impinge on membranes causing their oxidation (Loreto et al. 2001). Whether this occurs by direct reaction or indirectly is not known, although a direct quenching of singlet oxygen in presence of isoprene has been reported (Velikova et al. 2004). Finally, Velikova et al. (2005b) found that, in isoprene-emitting leaves that were exposed to ozone, the accumulation of NO and H2O2 in the mesophyll was highly quenched. Since NO and H2O2 are the
signalling molecules that start the sequence of biochemical events leading to programmed cell death, it was surmised that isoprene could modulate molecular signalling in leaves. The observation that high ozone exposure can stimulate the emission of isoprenoids was also made in tobacco leaves by Beauchamp et al. (2005) and in poplar leaves (this study). However, other studies observed a reduction of isoprene emission during and after the ozone treatment (Velikova et al. 2005a; Calfapietra et al. 2007). It was hypothesized that when ozone largely affects photosynthesis, also the metabolic pathway of isoprenoid formation is negatively influenced.
Isoprenoids play a defensive role also against biotic stress. They can deter insects, attact their parasitoids and block the colonization of wounding by bacteria and fungi (Parè and Tumlison, 1997). While these effects have been found to be elicited by monoterpenes and sesquiterpenes, isoprene role in biotic stress defense remains more elusive. In any case, the interaction between isoprenoids and biotic stresses is beyond the scope of this study and will not be further addressed.
1.3 Methods to measure BVOC and ozone fluxes
Various methods and modelling approaches can be used to detect ozone flux at leaf, plant, ecosystem scale. The purpose of a research and the instruments available should assist with the selection of the most appropriate technique to use for measurements. The precision of the measurements unavoidably decreases with increasing level of observation. In the present study, I mostly concentrated on measurements of BVOC and ozone fluxes at leaf level, using
the enclosure technique, with technical adjustments to further render this technique suitable for accurate measurements of these very reactive gases. Special enclosures were also used to upscale measurements at whole plant level. Details of the enclosure system will be given in the next section, and in the Materials & Methods section of each case of study. The most used micrometeorological techniques for canopy scale fluxes, as well as models to calculate ozone and BVOC fluxes from vegetation will also be mentioned, but further information on these experimental techniques can be retrieved on the cited literature.
1.3.1 Proton Transfer Reaction Mass Spectrometry (PTR-MS) for BVOC measurement
This section is dedicated to the novel approach (PTR-MS) used in this study to measure BVOC emission. The Proton Transfer Reaction-Mass Spectrometer (PTR-MS) was developed by Lindinger et al. (1998) and consists of a discharge ion source to produce H3O+
ions, a drift-tube reactor, in which the proton-transfer reactions between H3O+ and BVOC
take place, and a quadrupole mass spectrometer for the detection of reagent and product ions. The ionization reaction is described as follow:
O H BVOCH BVOC O H3 + → + 2 + + (R7)
The ion source consists of a hollow cathode discharge in water vapour and provides a source of H3O+ ions. In a small intermediate chamber, ions from the hollow-cathode are then
converted into H3O+ ions while being transported towards the drift tube. The latter is
separated from the second intermediate chamber by a small orifice, and most of the air is pumped away by a turbo pump. A fraction of the ions is extracted through the nose cone into the quadrupole mass spectrometer, which consists of a commercial Vacuum mass filter and an electron multiplier for ion pulse counting. In the present experiments, the mass spectrometer was run in selected-ion mode, in which only certain ions (BVOCH+) of interest are analyzed rather than scans over a range of masses.
These reactions are exothermic if the proton affinity (PA) of R is higher than the PA of water (166.5 kcal mol-1), in which case the reaction proceeds at a rate close to the collision rate of 10-9 cm3 molecule-1 sec-1. Isoprenoids and oxygenated compounds studied in this work have
a proton affinity much higher than water. For VOCs that have a PA only slightly higher than that of water, the exothermicity of reaction is small and the rate coefficient of the reversed reaction 7 is not-negligible. This is the case, for example, for formaldehyde, and such compounds were not investigated in this study.
The BVOCH+ ions produced from reaction 7 can undergo fragmentation, especially when exceeding a molecular weight above 100. This is the case of monoterpenes (m/z 136). Fragmentation is function of the humidity of the sampled air and the voltage of the drift tube influencing the electron impact between protons and VOCs (Tani et al. 2004). However, the masses and patterns of monoterpene fragmentation are well known (Rinne et al. 2005), and it is possible to measure the concentration of monoterpenes simply measuring their main fragment with protonated m/z 81.
Due to the continuing sampling and the short residence time of sample gas in the drift tube, the response of the PTR-MS is very fast, varying from 0.2 to 5 sec (de Gow and Warneke, 2007). Moreover, the high sensitivity of the quadrupole allows a low detection limit of 10 to 50 ppt, thus making the PTR-MS a powerful detector for trace gases.
1.3.2 Enclosures
Enclosure systems, namely “cuvettes”, have become increasingly popular in the field of on-line analysis of gases exchanged by the plant (Tholl et al. 2006). In association with suitable detection systems, cuvette measurements allow precise and rapid monitoring of the air composition and the release or uptake by plants of gaseous compounds such as CO2, H2O,
ozone and BVOC enabling accurate in vivo studies of the relationships between primary metabolism (photosynthesis) and secondary metabolism (BVOC synthesis). Cuvette systems also allow the investigation of physical constraints to ozone and BVOC fluxes such as those caused by stomatal opening (Niinemets et al. 2004) or mesophyll resistances.
Three types of cuvettes are in general used: leaf, branch and plant cuvettes. Leaf cuvettes are made of a frame in which a leaf, or a portion of it, is enclosed. They generally have a very small and fixed volume, rarely exceeding 0.5 liters. Cuvettes used for measuring BVOC emissions from tree branches have a larger volume (>2 l) and are often inflatable (with or without solid frames). A selection of different leaf and branch cuvettes is shown in Figure 4.
CO2, H2O,
O3, BVOC
out
To IRGA (CO2and H2O)
To GC or PTR-MS (BVOC) To UV detector (O3) Off-line BVOC measurements CO2, H2O, O3 in
A
B
C
D
E
Figure 4: Examples of cuvette systems for measurements of plant BVOC and physiological parameters. (A) A simplified sketch of a typical cuvette allowing measurements of the concentration of CO2 and H2O (by infrared analysis) and BVOC emissions by on-line analysis via PTR-MS or GC, or off-line analysis via cartridge trapping and subsequent analysis by GC-MS.
(B) Special cuvette for simultaneous measurements of gas exchange and fluorescence properties of the leaf. (C) Cuvette system used to monitor gas exchanges from entire branches under field conditions.
(D) Cuvette system for gas exchange analysis from whole small plants. (E) Plant enclosures allowing to enclose one or more transplants.
All cuvettes (except (C)) allow full control of the principal environmental parameters (temperature, light intensity and quality, wind speed and relative humidity).
Cuvettes have transparent windows of glass or plastic material to allow illumination of the enclosed plant specimens on the adaxial and, occasionally, also on the abaxial side of the leaf. Light is provided by external, generally artificial, sources such as light-emitting diodes (LEDs) with wavelengths needed for physiological light reactions to occur (Tennessen et al. 1994). As a cold and easy modular light source, LEDs can generate very high and uniform light intensities without overheating the leaf cuvette. However, LEDs only provide few wavelengths and do not generally reconstitute the solar spectrum. Moreover, LEDs are currently difficult to use in branch cuvettes due to insufficient and inhomogeneous illumination over large and uneven surfaces. When using branch or whole plant cuvettes the solar spectrum is provided by batteries of powerful lamps (e.g. the Osram, Hg vapour, Power Star series) which however also generate large infrared radiation. Overheating must be then
avoided by intercepting the infrared radiation with appropriate filters (e.g. water layers circulating to remove the heat).
Leaf cuvettes are generally thermoregulated by Peltier resistances or, more simply but less effectively, by water circulating in the body walls at the desired temperature. Water regulation of temperature is slower and less homogenous than the regulation by thermoelectric devices. In both cases, the actual leaf temperature is constantly measured by thermocouples attached to the side of the leaf which is not directly exposed to incident light. Leaf temperature may be considerably different than air temperature, and generally lower when latent heat is dissipated by stomatal transpiration. Large-volume branch cuvettes are often not thermostated and temperature is simply monitored by one or more thermocouples close to the leaves in strategic positions (e.g. in the shaded areas and close to air stirring devices). In all cuvette systems, air circulates inside the cuvette entering/exiting from one or more inlet/outlet holes. The geometry of the cuvette must favour rapid and turbulent air motion to avoid air stagnation, which may in turn cause condensation of water on cold spots of the cuvette and the formation of a boundary layer resistance restraining the exchange of gases between the leaf and the atmosphere. Therefore, built-in fans are often used to stir the air inside the cuvettes. Fan engines however often generate ozone and for this reason their use should be avoided when working on ozone measurements. Ozone-free fan engines are however available on the market if the volume is too high or uneven to be satisfactorily exchanged without the help of fans. In general, the volume of the cuvette must be replaced at least twice per minute to avoid the above-mentioned condensation and low boundary layer conductance problems.
The humidity of the air in the cuvette can be easily controlled when working with laboratory equipment by bubbling, prior to insertion in the cuvette, air into water and passing then the air stream in a condenser. Condensation of excess humidity is generally achieved placing the condenser in a water bath maintained at a temperature lower than air temperature. Humidity can be also removed by using water chemical adsorbants, such as drierite, silica gel or magnesium chloride. Air humidity can be calculated from psichrometric tables, knowing exactly the air temperature before the cuvette and in the cuvette, or can be actually measured with capacitors (e.g. Vaisala condenser).
Laboratory equipment also allows excellent control of the composition of the air, especially when mixing air components from gas cylinders and regulating the concentration of each
gas precisely, with the assistance of mass flow controllers. When using contaminat-free mixtures of N2, O2 and CO2, to reconstitute the desired air composition, measurements of
trace-gases released by plants are easy and clean. Single pollutants (e.g. ozone or hydrocarbons) may also be added to the mixture at ppb level, and their uptake can be detected very effectively when the background is that clean. It should be noted, however, that such measurements under contaminant-free conditions may not reflect ‘real life’ conditions, in which gases may e.g. react before coming in contact with the leaf (e.g. BVOC + ozone). On the positive side, cuvettes are ideal to study the effect of one single pollutant (e.g. ozone) on the leaf physiology, or to focus the attention on the species-specific emission rates of BVOC, and for the parameterization of these compounds on the basis of single environmental or physiological factors.
Beside using ozone-free synthetic air from cylinders, rapid reactions of BVOC with ozone present in the inflowing air can be avoided scavenging ozone from ambient air with appropriate chemical traps or physical devices, such as a simple piece of metal.
Like other devices used in the collection of BVOC, cuvettes should be entirely constructed with materials which are inert to BVOC and ozone. Glass and Teflon, also manufactured as a transparent film (Fig. 4) are suitable materials. If metal is to be used, the metal parts (generally the cuvette frame) can be wrapped in Teflon film or sprayed with a liquid layer of Teflon. When fumigating leaves with very reactive compounds, fittings and pipelines external to the cuvette should also be made of inert materials (Fig. 4). In all cases, a measurement of the uptake of ozone, BVOC, or other reactive materials by the empty cuvette must be performed, and this blank measurement can be subtracted to the leaf uptake. To ensure a correct estimation of the cuvette wall contribution, the cuvette uptake measurement should be repeated at each condition set for leaf uptake measurements (e.g. at different temperatures, light intensities, etc.) and memory effects (persistent emission of sticky compounds once the leaf has been removed by the cuvette, or fumigation has ended) should be properly measured.
In this work, I measured gas exchange adopting the theory of diffusion in isotropic substances (Nobel, 1974), which is based on the physical law stating that the rate of transport of diffusing substances through unit area cross section is proportional to the concentration gradient normal to that section:
z x D x ∂ ∂ − = Φ (2)
where Φ is a flux, the rate of transfer for a diffusing substance through a unit area of cross-section, x is the concentration of the different gases (CO2, BVOC, and ozone in this study), z
is the space coordinate measured normal to the section and D is the diffusion coefficient. When assuming that /D is equal to a resistance, the inverse of resistance is a conductance (g
z
∂
x), which can also be measured according to equation 3:
[ ] [ ]
[ ] [ ]
x x x x A F g i in L x − − ⋅ = (3)where F is the air flux passing at a certain amount through the cuvette, AL is the leaf area inside the cuvette, [x] and [x] in are the concentrations of a gas inside and outside the cuvette.
The term [x] – [x] in is considered an uptake. The term [x]i is the intercellular concentration of
a gas in the cuvette, assumed to be zero in the case of ozone (Laisk et al. 1989) and 100% in case of water.
When substituting equation 3 to the gx term of equation 2, the flux (Φx) of a generic gas is
given by:
[ ] [ ]
in L x x x A F ⋅ − = Φ (4)Cuvette measurements are a favorite in vivo method for studying at the same time the BVOC emission, photosynthesis, transpiration, and ozone uptake. Simultaneous on-line measurements are best performed when air leaving the cuvette is split to reach an infrared gas analyzer for CO2/H2O detection, an UV detector for ozone (Loreto et al. 2001), and a
fast detector for BVOC emissions such as PTR-MS (Lindinger et al. 1998). Off-line measurements can also be performed by entrapping air samples in canisters or solid adsorbent and successively analyzed with a GC-MS (Gas Chromatograph-Mass Spectrometer (Helmig, 1999)).
Finally, special cuvettes allow rapid freeze-clamping of the enclosed leaves for biochemical analysis of enzyme activities and metabolites with very rapid turnover. In a system
developed by Sharkey (Loreto and Sharkey, 1993) the leaf enclosed in the cuvette is frozen extremely quickly (<0.1 sec) by smashing it between the plastic windows of the cuvette under high pressure (>100 bar) with metallic drums previously frozen in liquid nitrogen. This system was effectively used, with slight modification, to determine pools of dimethylallyl diphosphate (DMADP), the last intermediate in isoprene biosynthesis (Loreto et al. 2004), and to measure the activities of isoprene and monoterpene synthases (Loreto et al. 2001).
1.3.3 Micrometeorological techniques
When studying the fluxes of ozone and/or BVOC at ecosystem level rather than at leaf level, it is necessary to use suitable methods which do not rely on enclosures. Measurements are made under uncontrolled environmental conditions and are averaged over long time periods. For ozone, the most used method to determine fluxes exchanged by vegetation is the Eddy Covariance (Hicks and Matt, 1998; Bauer et al. 2000). This method allows to calculate the flux of a scalar (energy, mass) at a point centered on instrument placed at a certain height above the canopy. The flux (Φx) is then calculated multiplying the gas concentration at the
set height (X ) by the vertical wind velocity (w), as shown in equation 5:
' ' X
w
X =
Φ (5)
The prime symbols indicate the instantaneous deviations from the mean, and the overbar indicates the time averaging, usually 30 min. Fluxes for BVOC are generally positive, indicating emission from the canopy to the atmosphere; ozone fluxes are always negative, indicating an uptake by vegetation. The value is expressed in mol m-2 s-1 or g (DW) m-2 s-1, the same unit of the fluxes measured with enclosures, but is referred to m-2 of surface, not foliar area. This makes comparisons between leaf and whole ecosystem measurements difficult, unless introducing a term for biomass density (g m-2) of the specific site of measurement.
The Eddy Covariance approach requires fast response sensors for gases and wind, usually collecting data with a frequency around 10 Hz. For BVOC a reasonably fast sensor is the
PTR-MS, but this instrument can often collect data at frequencies of around 1 Hz, especially when several masses are measured simultaneously. The Disjunct Eddy Covariance technique (Rinne et al. 2001; Karl et al. 2002) allows to measure BVOC using an approach similar to the EC, but in which BVOC are sampled at lower frequency and are correlated with the wind value along a continue time series. This method needs very accurate calculation of the exact timing of BVOC sampling, since a wrong correlation would give misleading results. It also needs to average data collected on a rather long period and to use a rather complicate statistical package, to smooth data, eliminating measurements that are biased by occasionally uneven meteorological conditions.
A second and indirect method to determine fluxes is the “Gradient diffusion” approach (Ciccioli et al. 1997). This method assumes that a hydrocarbon flux can be characterized by the product of the concentration gradient (∂χ/ z∂ ) defined between two levels above the source, and an atmospheric eddy diffusivity (Kχ) of the hydrocarbon constituent (equation 6). z Kx X ∂ ∂ − = Φ χ (6)
Kχ can be obtained by invoking the Monin and Obukhov (1954) similarity hypothesis, as
shown below: h X d z k u K φ ) ( − = ∗ (7)
where φhdenotes the diabatic influence function for heat, signifies the friction velocity, k is the von Kármán constant (= 0.4), and d represents the forest zero plane displacement. An advantage of this method is that the gas measurement is very detailed, especially for BVOC, and can be done off-line by analyzing with a GC-MS the gasses previously trapped in canisters. However, this technique cannot be applied for ozone, since it is impossible to store ozone in canisters or traps.
∗ u
A third method to measure fluxes of gases by vegetation is the “Relaxed Eddy Accumulation” (REA), which involves the separation of gas samples into two reservoirs for
ascending and descending air. The flux (equation 8) is related to an empirical coefficient
) (ζ
b , the standard deviation of the vertical wind speed σw, the difference in the mean gas concentration stored in updrafts (χu) and downdrafts ((χd) Businger and Oncley, 1990):
) ( ) ( w u d X =b ζ σ χ −χ Φ (8)
The vertical wind speed provided by sonic anemometers is used to divert through fast solenoid valves air to reservoirs associated with updrafts and downdrafts. An adsorbent cartridge can also be used to store samples in lieu of reservoirs (Ciccioli et al. 1997). This last technique is very labour intensive, but it gives very specific information about BVOC species, since the off-line analysis can be performed with a GC-MS. However also in this case ozone cannot be measured, because of the too high reactivity of this compound inside reservoirs or cartridges.
1.3.4 Models to estimate and predict ozone and BVOC fluxes
Modelling ozone fluxes has to consider the high gas reactivity, and the still unknown deposition processes that can remove ozone. The most relevant processes involved in ozone uptake by plants are related to transport in gas and liquid phases, through surfaces, until the reaction sites. The transport of a molecule is a physical phenomenon occurring in the atmosohere (Seinfeld and Pandis, 1989).Until reaching the reaction site, a molecule is transported by turbulent air masses, and meets an array of resistances. The most successful models are those used to predict ozone deposition on a large, regional scale considering the deposition on different surfaces, in relation to environmental parameters: light, temperature, rain, snow. At a plant scale, the environmental inputs are required to simulate the stomatal behaviour influencing the stomatal ozone flux (Vautard et al. 1995; Simpson et al. 2003). There is evidence, however, that stomatal uptake at ecosystem level cannot explain alone ozone deposition. In some field measurements (Gerosa et al. 2005; Kurpius and Goldstein, 2003) the modelled non-stomatal contribution based on resistance analogies and water exchange accounted for 50-70 % of the total flux. It is important to understand the purposes of the model, if the aim is to assess the total ozone deposition, or it is necessary to quantify
the stomatal ozone flux. If the model needs to serve for risk assessment, the accuracy in determining the stomatal flux is fundamental (Grünhage et al. 2000; Erisman et al. 2004; Emberson et al 2000, 2007). The parameterisation of stomatal ozone flux from the model of Emberson et al. (2000) and also present in the UNECE mapping manual (UNECE, 2004) considers the stomatal flux of ozone as the final product between the atmospheric ozone concentration at canopy top ([O3]) assuming intercellular ozone concentration = 0, and the
stomatal conductance to water vapour (gsto) including the deposition rate to the leaf through
resistances: c b c sto O r r r g O + = Φ 3 [ 3]* * (9)
where rc the leaf surface resistance, abd rb is the quasi laminar resistance. The core of this
ozone flux model is the multiplicative algorithm to calculate gsto according to the following
formulation:
{
,( * * )}
max * * )] , [min( * 3 minmax phen O light temp VPD SWP
sto g f f f f f f f
g = (10)
Where gmax is is the species-specific maximum stomatal conductance, and the f parameters
are all expressed in relative terms (taking values between 0 and 1) for leaf phenology (fphen),
the influence of ozone concentration on stomatal conductance (fO3), the light conditions
(flight), the minimal estimated levels of gmax (fmin), temperature (ftemp), Vapour Pressure Deficit
(fVPD) and soil water potential (fSWP). This model is applied to sunlit leaves of canopies in
ecosystems, and is actually used to assess ozone risk on crops, and the ongoing research activity is performing this methods for forest ecosystems (UNECE “level II” approach, see section 1.1.3). This method is accurate when a high number of ground-based measurements on the physiology of plants and environmental variables is performed.
At a leaf level, there were some efforts not described in this work (Chameides et al. 1987; Cape et al. 1998) to parameterize ozone uptake considering the reactions occurring on the cuticula and inside the leaf, and also considering the leaf wetness and resistance analogies. In the field of BVOC emissions, large efforts have been made to model the emission of isoprenoids, the most abundant and reactive compounds. Isoprenoid emissions are controlled
by light and temperature (Monson et al. 1992; Tingey et al. 1991). Based on these dependencies, an algorithm was elaborated by Guenther et al. (1995, 1999), which applies two correction factors to a standard emission rate (SE) measured in basal conditions (T = 30°C and PPFD (Photosynthetic Photon Flux Density) = 1000 µmol m-2 s-1). A simplified form of the equation is reported in equation 11:
(
)
(
)
⎥ ⎥ ⎥ ⎥ ⎥ ⎦ ⎤ ⎢ ⎢ ⎢ ⎢ ⎢ ⎣ ⎡ ⎟⎟ ⎠ ⎞ ⎜⎜ ⎝ ⎛ − + ⎟⎟ ⎠ ⎞ ⎜⎜ ⎝ ⎛ − ∗ ⎥ ⎦ ⎤ ⎢ ⎣ ⎡ + = T RT T T C T RT T T C PPFD PPFD C SE D E S M T S S T L s Isoprenoid 2 1 2 2 exp 1 exp 1 * α α (11)where CL, α, CT1, CT2, and TM are empirical coefficients, R is the universal gas constant, D is
the foliar density, T is the leaf temperature and TS in the leaf temperature at standard
conditions (303 °K). It was found that the basal emission is changing with the seasonality and with rising CO2 concentartion in the atmosphere, and the algorithm has been modified
introducing a seasonality factor ( Ciccioli et al. 2003) or a CO2-dependent factor (Arneth et