www.impactjournals.com/oncotarget/ Oncotarget, 2017, Vol. 8, (No. 64), pp: 107356-107373
MicroRNAs sequencing unveils distinct molecular subgroups of
plasmablastic lymphoma
Maria Raffaella Ambrosio1,*, Lucia Mundo1,*, Sara Gazaneo1, Matteo Picciolini2,
Prasad Satya Vara3, Shaheen Sayed4, Alessandro Ginori1,5, Giuseppe Lo Bello1,
Leonardo Del Porro1, Mohsen Navari6,7,8, Stefano Ascani9, Amhed Yonis10, Lorenzo
Leoncini1, Pier Paolo Piccaluga7,8,* and Stefano Lazzi1,*
1 Department of Medical Biotechnology, Section of Pathology, University of Siena, Siena, Italy 2 Diatech Pharmacogenetics, Jesi, Italy
3 Aga Khan Hospital, Kisumu, Kenya
4 Aga Khan University Hospital, Nairobi, Kenya
5 Pathology Unit, Ospedale Civico di Carrara, Carrara, Italy
6 Research Center of Advanced Technologies in Medicine, Torbat Heydariyeh University of Medical Sciences, Torbat Heydariyeh, Iran
7 Department of Experimental, Diagnostic, and Experimental Medicine, Bologna University School of Medicine, Bologna, Italy 8 Euro-Mediterranean Institute of Science and Technology (IEMEST), Palermo, Italy
9 Section of Pathology, Azienda Ospedaliera S. Maria di Terni, University of Perugia, Perugia, Italy 10 Alexandria University, Alexandria, Egypt
* These authors have contributed equally to this work Correspondence to: Lorenzo Leoncini, email: [email protected]
Correspondence to: Pier Paolo Piccaluga, email: [email protected]
Keywords: plasmablastic lymphoma; miRNA expression profiling; Burkitt lymphoma; extramedullary plasmacytoma; Epstein-Barr
virus; Pathology section
Received: June 20, 2017 Accepted: September 08, 2017 Published: October 31, 2017
Copyright: Ambrosio et al. This is an open-access article distributed under the terms of the Creative Commons Attribution License 3.0 (CC
BY 3.0), which permits unrestricted use, distribution, and reproduction in any medium, provided the original author and source are credited.
ABSTRACT
Plasmablastic lymphoma (PBL) is an aggressive lymphoma, often arising in the context of immunodeficiency and associated with Epstein-Barr virus (EBV) infection. The most frequently detected genetic alteration is the deregulation of MYC gene through the translocation - t(8;14)(q24;q32). The diagnosis of PBL is often challenging because it has an overlap in morphology, immunophenotype, cytogenetics and virus association with other lymphomas and plasma cell neoplasms; further, its molecular basis remains elusive. In the present study we aimed to better define the possible contribution of EBV infection as well as miRNA deregulation in PBL pathogenesis.
We studied 23 cases of PBL, 19 Burkitt lymphomas (BL), and 17 extra-medullary plasmacytoma (EMPC). We used qPCR and immunohistochemistry to assess EBV latency patterns, while micro-RNA (miRNA) profiling was performed by next generation sequencing (Illumina) and validated by qPCR.
Our analysis revealed a non-canonical EBV latency program with the partial expression of some proteins characterizing latency II and the activation of an abortive lytic cycle. Moreover, we identified miRNA signatures discriminating PBL from BL and EMPC. Interestingly, based on the miRNA profile, PBL appeared constituted by two discrete subgroups more similar to either BL or EMPC, respectively. This pattern was confirmed in an independent set of cases studied by qPCR and corresponded to different clinico-pathological features in the two groups, including HIV infection, MYC rearrangement and disease localization.
INTRODUCTION
Plasmablastic lymphoma (PBL) is a rare highly aggressive lymphoma that occurs most often in the context of Human Immunodeficiency Virus (HIV)-infection (40-50%), or in other settings of decreased immune surveillance [1]. Tumor cells have a well-defined morphology resembling B-immunoblasts, and express plasma cells markers [1]. However, a more or less pronounced plasmacytic differentiation as well as a variable expression of CD20 and PAX-5 can be encountered [2]. Therefore, the diagnosis of PBL is challenging because it has an overlap in cytomorphologic and immunophenotypic features with plasma cell neoplasms and with lymphomas that show blastic appearance (i.e. more immature, plasmablast-like morphology) [3]. Even using a comprehensive panel of immunostains, a confident differential diagnosis between PBL and anaplastic or plasmablastic extramedullary plasmacytoma (EMPC) is not always possible. Nonetheless, a proper distinction of these entities is mandatory as EMPC and PBL have different prognoses and currently benefit from different therapeutic strategies. On the other hand, the differential diagnosis between PBL and other lymphoma types with blastic appearance is often straightforward due to the lack of B-cell marker expression in PBL. However, BL shares numerous biologic similarities with PBL. In fact, the most frequently detected genomic alteration in PBL is t(8;14) (q24;q32) leading to MYC/IGH rearrangement observed in about 50% of cases [1, 3]. Other overlaps include cell morphology with the starry sky appearance, the high proliferation rate, the MYC protein over-expression and the association with EBV infection.
A common feature is the presence of the Epstein-Barr virus (EBV) DNA in tumor cells in 50 to 75% of cases, with higher frequency in HIV-positive cases [1, 3]. The molecular and genetic mechanisms underlying PBL pathogenesis remain largely unknown and are likely dependent on the complexity of biological interplays between immunodeficiency, molecular events (MYC gene rearrangements), co-infecting oncogenic viruses (EBV) [4] and chronic immune activation (expression of immune-checkpoint proteins) [5]. It is unknown, however, whether MYC translocation represents the initiating or a late genetic event in PBL pathogenesis, and furthermore the latency program of EBV in neoplastic cells is still debated. In fact, although the type I latency is commonly detected, type III latency can be observed in patients with HIV infection and in those patients with post-transplant PBL [3].
In the present study we aimed to better define the pathogenesis and molecular features of PBL by 1) assessing the EBV latency patterns in PBL by qPCR and immunohistochemistry; 2) performing, for the first time to the best of our knowledge, an unbiased miRNA profiling of PBL, EMPC, and BL by next generation sequencing (NGS).
RESULTS
qPCR and immunohistochemistry reveal a non-canonical latency type and an abortive lytic cycle of EBV in plasmablastic lymphoma
We checked the expression of EBNA-1, EBNA-2,
EBNA-3, LMP-1, LMP-2A, EBER transcripts, BZLF-1/
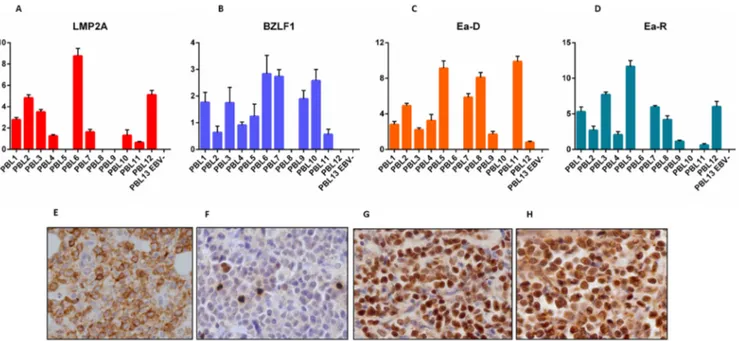
ZEBRA, BMRF-1/Ea-D, BHRF-1/Ea-R, BLLF1/gp350 across the 13 PBL cases (12 positive and 1 EBV-negative). EBNA-1 was detected in 12/13 cases (92.3%), LMP-1 and LMP-2 in 1/13 and 10/13 (7.7% and 76.9%, respectively) (Figure 1), EBNA-2 and EBNA-3 in 0/13, and EBER in 12/13 (92.3%). BZLF-1/ZEBRA was found in 12/13 cases (92.3%) and both BMRF-1/Ea-D e
BHRF-1/Ea-R in 10/13 (76.9%) (Figure 1), while none of the
cases expressed BLLF1/gp350 (Figure 1).
We then determined the expression of all the corresponding encoded-proteins. Immunohistochemistry (IHC) confirmed the non-canonical latency associated program with the partial expression of some proteins characterizing latency II (i.e. 1 in 1/13 and LMP-2 in 6/13 of the cases) (Figure 1). There was also the expression of proteins characterizing the lytic phase of the virus (i.e. BZLF-1/ZEBRA in 12/13, and BHRF-1/ Ea-R and BMRF-1/Ea-D in 9/13 of the cases) (Figure 1). BLLF1/gp350 was not detected in any case. The qPCR data substantially corresponded to those obtained by IHC; however, slight differences emerged likely due to the higher sensitivity of qPCR.
The same analyses were then carried out in the validation cohort with substantially identical results (Figure 1; Table 3).
Together, these data indicate a non-canonical EBV-latency pattern in PBL.
In conclusion, we uncovered for the first time 1) an atypical EBV latency program in PBL; 2) a miRNA signature distinguishing PBL from the closest malignant counterparts; 3) the molecular basis of PBL heterogeneity.
Plasmablastic lymphomas can be divided into two groups based on the miRNA profiling
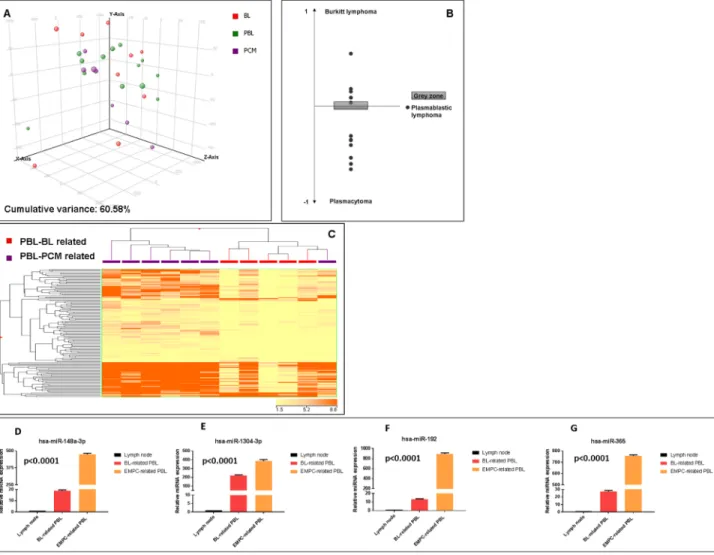
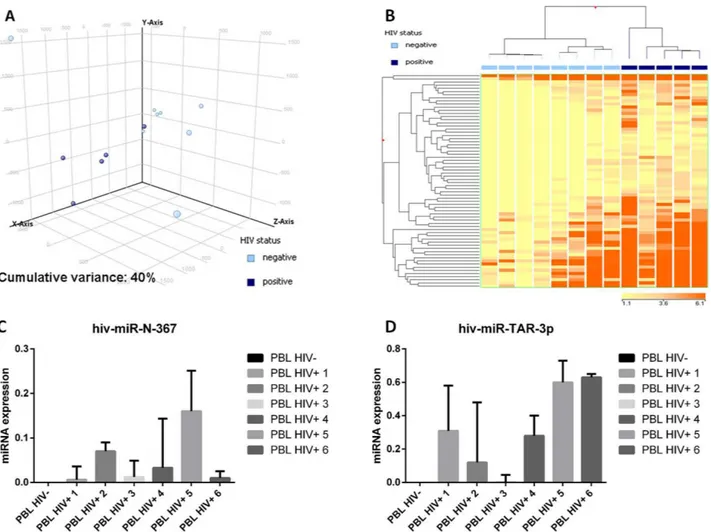
First, we sought to investigate the relation of PBL with BL and EMPC as far as miRNA expression was concerned. When an unsupervised approach was used, namely PCA, PBL appeared relatively heterogeneous and was not clearly distinct from BL and EMPC, indicating some degree of similarity with both of them. To better determine the possible relation with these two tumors, we developed a miRNA expression-based cell type classifier to establish whether single PBL cases could be related to either one (or none) of the two (BL or EMPC). We found that 7 out of 13 cases were significantly closer to EMPC, 5 out of 13 to BL, and 1 was not clearly classified (Figure 2A-B, Table 4). By a supervised analysis, we identified 136 cellular miRNA differentially expressed in the two new subgroups (Figure 2C; Table 5a and 5b): 123 were up-regulated in “EMPC-related” PBLs, while 13 were up-regulated in “BL-related” ones. Among others, the expression level of mir-192-5p, mir-1304-3p, hsa-mir-148a-3p, hsa-miR-365-3p was studied by RT-qPCR as technical validation. We observed that these miRNA were up-regulated in the cases belonging to the EMPC-related cluster and down-regulated in the BL-related samples, confirming NGS results (Figure 2D). Interestingly, the two groups of PBLs tended to differ also for some clinical features. The patients BL-related were younger (mean age: 50.2 years), with a slight male predominance (M:F= 3:2), an extra-oral localization and a blastic appearance; the majority of them (4 out 5) were HIV-negative. The patients
EMPC-related were older (mean age: 56.85 years), mainly male (M:F= 6:1), with an oral localization (4 out 7) and a more pronounced plasmacytic differentiation; the majority of them (4 out 7) were HIV-positive. Of note, 5/5 BL-related cases presented with MYC rearrangements at FISH, while only 2/7 EMPC presented with such feature (fisher exact test, p=0.03).
When we applied the cell classifier based on the expression of mir-192-5p, mir-1304-3p, hsa-mir-148a-3p, hsa-miR-365-3p to an independent set of 10 cases, we found that 3/9 cases were classified as EMPC-related and 6/9 as BL-related, one case not being evaluable for technical reasons (qPCR failure) (Supplementary Figure 1). Noteworthy, training and test set were comparable concerning HIV infection (6/13 vs 2/10, Fisher exact test, p=0.09)
Plasmablastic lymphomas and plasmacytomas have different miRNA profiles
In order to unveil specific differences between the PBL and EMPC, we compared the two diseases in term of miRNA expression. When unsupervised approach was adopted, both principal component analysis (PCA) and hierarchical clustering (HC) failed to clearly separate the two entities (data not shown). Then, by supervised analysis, we identified 48 differentially expressed miRNA, including 38 EBV-encoded and 10 cellular miRNA which could clearly differentiate the two groups when PCA and HC methods were applied (Figure 3A-3B, Supplementary Table 2). Of note, a linear discriminant analysis indicated
Figure 1: RT-qPCR and immunohistochemistry reveal a non-canonical latency type and an abortive lytic cycle of EBV in neoplastic cells. LMP-2A A., E., BZLF-1/ZEBRA B., F., BMRF-1/Ea-D C., G., BHRF-1/Ea-R D., H., expression by RT-qPCR (across the 13 PBL cases) and immunohistochemistry (in one exemplificative PBL case; original magnification, 40x). In qPCR graphs, y-axis represents gene expression values (2 Delta Ct formula).
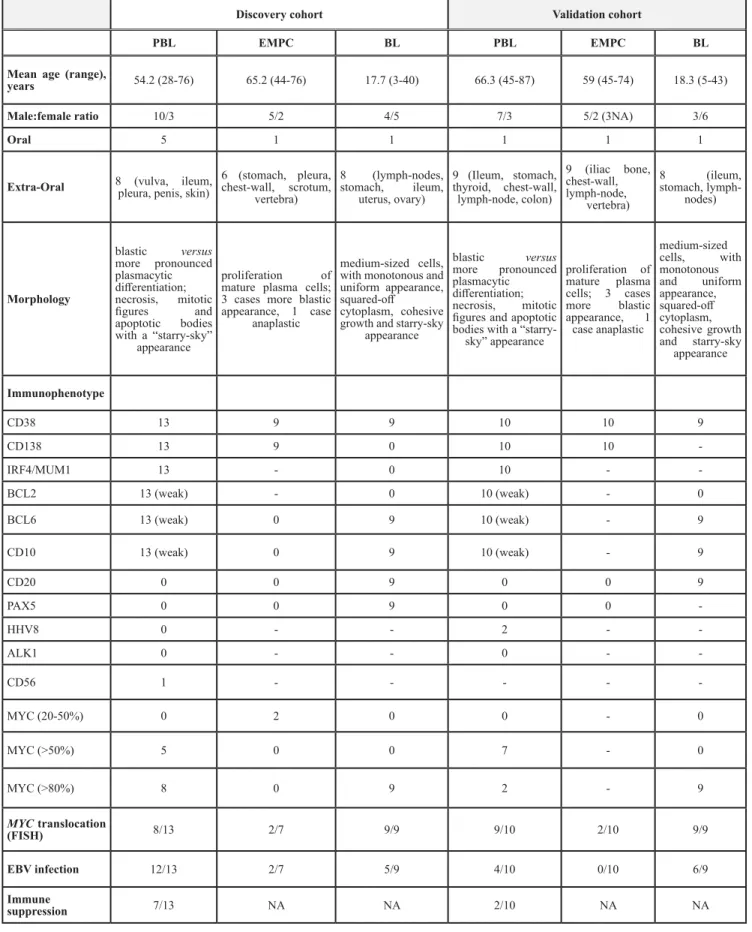
Table 1: Clinical, histologic, immunophenotypic and FISH features of discovery cohort patients
Discovery cohort Validation cohort
PBL EMPC BL PBL EMPC BL
Mean age (range),
years 54.2 (28-76) 65.2 (44-76) 17.7 (3-40) 66.3 (45-87) 59 (45-74) 18.3 (5-43)
Male:female ratio 10/3 5/2 4/5 7/3 5/2 (3NA) 3/6
Oral 5 1 1 1 1 1
Extra-Oral 8 (vulva, ileum, pleura, penis, skin) 6 (stomach, pleura, chest-wall, scrotum, vertebra) 8 (lymph-nodes, stomach, ileum, uterus, ovary) 9 (Ileum, stomach, thyroid, chest-wall, lymph-node, colon) 9 (iliac bone, chest-wall, lymph-node, vertebra) 8 (ileum, stomach, lymph-nodes) Morphology blastic versus more pronounced plasmacytic differentiation; necrosis, mitotic figures and apoptotic bodies with a “starry-sky” appearance proliferation of mature plasma cells; 3 cases more blastic appearance, 1 case
anaplastic
medium-sized cells, with monotonous and uniform appearance, squared-off cytoplasm, cohesive growth and starry-sky
appearance blastic versus more pronounced plasmacytic differentiation; necrosis, mitotic figures and apoptotic bodies with a
“starry-sky” appearance proliferation of mature plasma cells; 3 cases more blastic appearance, 1 case anaplastic medium-sized cells, with monotonous and uniform appearance, squared-off cytoplasm, cohesive growth and starry-sky appearance Immunophenotype CD38 13 9 9 10 10 9 CD138 13 9 0 10 10 -IRF4/MUM1 13 - 0 10 - -BCL2 13 (weak) - 0 10 (weak) - 0 BCL6 13 (weak) 0 9 10 (weak) - 9 CD10 13 (weak) 0 9 10 (weak) - 9 CD20 0 0 9 0 0 9 PAX5 0 0 9 0 0 -HHV8 0 - - 2 - -ALK1 0 - - 0 - -CD56 1 - - - - -MYC (20-50%) 0 2 0 0 - 0 MYC (>50%) 5 0 0 7 - 0 MYC (>80%) 8 0 9 2 - 9 MYC translocation (FISH) 8/13 2/7 9/9 9/10 2/10 9/9 EBV infection 12/13 2/7 5/9 4/10 0/10 6/9 Immune suppression 7/13 NA NA 2/10 NA NA
PBL: plasmablastic lymphoma; EMPC: extramedullary plasmacitoma; BL: Burkitt lymphoma; IHC: immunohistochemistry; pos.: positivity; neg.: negativity; NA.: not available.
that as few as four miRNA (665, 3613-5p, miR-1304-3p and miR-3609) could correctly discriminate the samples. Accordingly, based on the expression of such 4 miRNA, we generated a cell classifier and applied it to our series, being able to correctly classify all cases (overall accuracy 100%; Table 6; Figure 3C). The expression of these four miRNA was also validated by RT-qPCR in the same panel of cases, confirming NGS results (Supplementary Figure 2). Furthermore, for the potential diagnostic implication, we studied their expression by qPCR in an independent validation cohort, consisting of 20 cases (10 PBL and 10 EMPC). When the cell classifier was applied, 9/10 EMPC and 10/10 PBL were correctly
identified (95% overall accuracy; Supplementary Figure 2; Table 7). All the three anaplastic EMPC included in the analysis were correctly classified.
Plasmablastic lymphomas and Burkitt lymphomas have different miRNA profiles
We then compared PBL to BL. By PCA the two diseases appeared relatively similar, without clear distinction (Figure 4A). By supervised analysis, we could identify a series of 42 differentially expressed miRNA (23 cellular and 19 EBV miRNA) (Figure 4B, Supplementary
Figure 2: Plasmablastic lymphomas include two molecular subgroups related to either EMPC or BL. Principal component analysis of plasmablastic lymphoma (PBL), extramedullary plasmacytoma (EMPC) and Burkitt lymphoma (BL) cases indicated a basic relation between the three entities at miRNA level A.. A cell type classifier based on a support vector machine algorithm was generated to discriminate BL and EMPC based on the expression of differentially expressed miRNA. When the algorithm was applied to PBL, they were classified as either BL or EMPC indicating their heterogeneity reflecting the similarity to either one of the other two tumor types (BL and EMPC) B.. Grey zone represent value below significance (0.05). Supervised analysis (t-test) comparing BL-related versus EMPC-related PBLs identified a series of differentially expressed genes C.. In the matrix, the dendrogram was generated using a hierarchical clustering algorithm based on the average-linkage method. In the matrix, each column represents a sample and each row represents a gene. The colour scale bar shows the relative gene expression changes normalized by the standard deviation (0 is the mean expression level of a given gene). Differential expression of hsa-miR-192-5p, hsa-miR-1304-3p, hsa-miR-148a-3p and hsa-miR-365-3p in BL-related versus EMPC-related PBLs group D.-G. Values are expressed as mean ± standard deviation (ST). Statistical significance was determined with Student’s unpaired
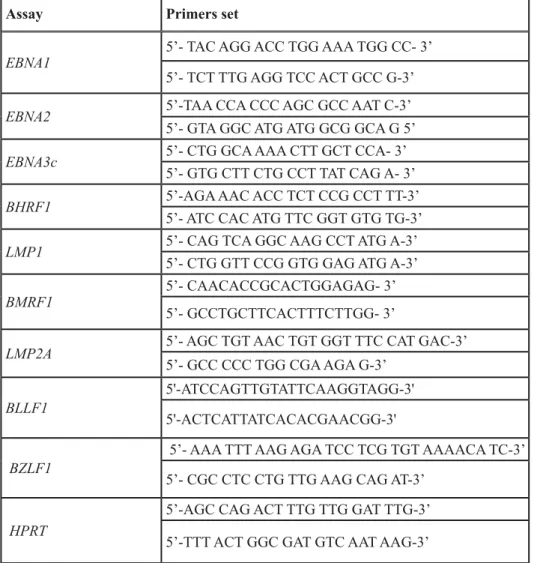
Table 2: Primers’ sets used for qPCR analysis of EBV-encoded genes
Assay Primers set
EBNA1 5’- TAC AGG ACC TGG AAA TGG CC- 3’
5’- TCT TTG AGG TCC ACT GCC G-3’
EBNA2 5’-TAA CCA CCC AGC GCC AAT C-3’
5’- GTA GGC ATG ATG GCG GCA G 5’
EBNA3c 5’- CTG GCA AAA CTT GCT CCA- 3’
5’- GTG CTT CTG CCT TAT CAG A- 3’
BHRF1 5’-AGA AAC ACC TCT CCG CCT TT-3’
5’- ATC CAC ATG TTC GGT GTG TG-3’
LMP1 5’- CAG TCA GGC AAG CCT ATG A-3’
5’- CTG GTT CCG GTG GAG ATG A-3’
BMRF1 5’- CAACACCGCACTGGAGAG- 3’
5’- GCCTGCTTCACTTTCTTGG- 3’
LMP2A 5’- AGC TGT AAC TGT GGT TTC CAT GAC-3’
5’- GCC CCC TGG CGA AGA G-3’
BLLF1 5'-ATCCAGTTGTATTCAAGGTAGG-3'
5'-ACTCATTATCACACGAACGG-3'
BZLF1 5’- AAA TTT AAG AGA TCC TCG TGT AAAACA TC-3’
5’- CGC CTC CTG TTG AAG CAG AT-3’
HPRT
5’-AGC CAG ACT TTG TTG GAT TTG-3’ 5’-TTT ACT GGC GAT GTC AAT AAG-3’
Table 3: qPCR and immunohistochemical latency results on validation cohort
RT-qPCR IHC/ISH
Positive cases (n.) Negative cases (n.) Positive cases (n.) Negative cases (n.)
EBNA-1 4 6 n.p. n.p. EBNA-2/3 0 10 n.p. n.p. LMP-1 0 10 0 10 LMP-2 4 6 3 7 EBER - - 4 6 ZEBRA 3 7 4 6 EaR 4 6 3 7 EaD 4 6 3 7 gp350 0 10 0 10
Table 3). As technical validation, some of them (hsa-miR-148-5p, hsa-miR-1273f, hsa-miR-4488, hsa-miR-494-3p; miR-BART10-3p, miR-BART18-3p and EBV-miR-BART19-5p) were also evaluated by qPCR, that again confirmed NGS data (Figure 4C). With the exception of miR-148a-5p, all cellular miRNA were up-regulated in PBL cases in respect to BL samples; a higher expression of all viral miRNA was detected in BL in comparison to PBL group.
These findings were also confirmed in our validation cohort (Supplementary Figure 3).
Plasmablastic lymphomas differ in the miRNA profile based on HIV infection
Since the association with HIV might affect PBL miRNA profiling, we directly compared HIV-positive
versus HIV-negative cases. Unsupervised evaluation
by PCA was already able to distinguish the two groups (Figure 5A). Further, the supervised analysis identified as many as 68 differentially expressed miRNA all of which were of cellular origin and were up-regulated in the HIV-positive group (Supplementary Table 4). By contrast, no EBV-encoded miRNA was differentially expressed. Based on the expression of such 68 miRNA, the cases were clearly distinct at HC (Figure 5B). None of the so far known HIV encoded miRNA emerged as significantly discriminating the two groups at NGS analysis. Therefore, in order to exclude possible underestimation of HIV-encoded miRNA contribution, we used a more sensitive qPCR approach to investigate this issue further. Although at low level, we found that both the tested HIV-encoded miRNA (HIV-miR-N-367 and HIV-miR-TAR-3p) were expressed in HIV cases but not in the negative ones (Figure 5C-5D).
Figure 3: Plasmablastic lymphoma and extramedullary plasmacytoma are distinct based on the miRNA profile.
Principal component analysis of plasmablastic lymphoma (PBL) and extramedullary plasmacytoma (EMPC) cases A.. Supervised analysis (T-test) comparing PBL and EMPC cases identified a series of differentially expressed genes B.. In the matrix B, the dendrogram was generated using a hierarchical clustering algorithm based on the average-linkage method. In the matrix, each column represents a sample and each row represents a gene. The colour scale bar shows the relative gene expression changes normalized by the standard deviation (0 is the mean expression level of a given gene). A cell type classifier based on a support vector machine algorithm was generated to discriminate PBL and EMPC based on the expression of differentially expressed miRNA C.. Grey zone represent value below significance (0.05). Differential expression of hsa-miR-665, hsa-miR-3613-5p, hsa-miR-1304-3p and hsa-miR-3609 in PBL versus EMPC group D.. Values are expressed as mean ± standard deviation (ST). Statistical significance was determined with Student’s unpaired t-test (p < 0.005).
Table 4: Correlation between PBL and BL or EMPC
Identifier Cell type Predicted Confidence Measure
H122 (raw) PBL BL 0.09583959 V109 (raw) PBL BL 0.10874487 s838 (raw) PBL BL 0.1592613 s613 (raw) PBL BL 0.20450206 s806 (raw) PBL BL 0.23559976 s1805 (raw) PBL EMPC 0.27476195 H276 (raw) PBL EMPC 0.45076987 s1529 (raw) PBL EMPC 0.4700034 s13725 (raw) PBL EMPC 0.47044697 s11224 (raw) PBL EMPC 0.5045746 s189 (raw) PBL BL 0.59934336 H333 (raw) PBL EMPC 0.6791907 V376 (raw) PBL EMPC 0.95444125
Figure 4: Plasmablastic lymphoma and Burkitt lymphoma are distinct based on the miRNA profile. Principal component analysis of plasmablastic lymphoma (PBL) and Burkitt lymphoma (BL) cases A.. Supervised analysis (t-test) comparing PBL and BL cases identified a series of differentially expressed genes B.. In the matrix B, the dendrogram was generated using a hierarchical clustering algorithm based on the average-linkage method. In the matrix, each column represents a sample and each row represents a gene. The colour scale bar shows the relative gene expression changes normalized by the standard deviation (0 is the mean expression level of a given gene). Cellular miRNA (hsa-miR-1273f, hsa-miR-148a-5p, hsa-miR-4488, hsa-miR-494-3p) and viral miRNA (miR-Bart10-3p, EBV-miR-18-3p, EBV-miR-19-5p) expression in PBL versus BL cohort groups C.. Values are expressed as mean ± standard deviation (ST). Statistical significance was determined with Student’s unpaired t-test (p < 0.005).
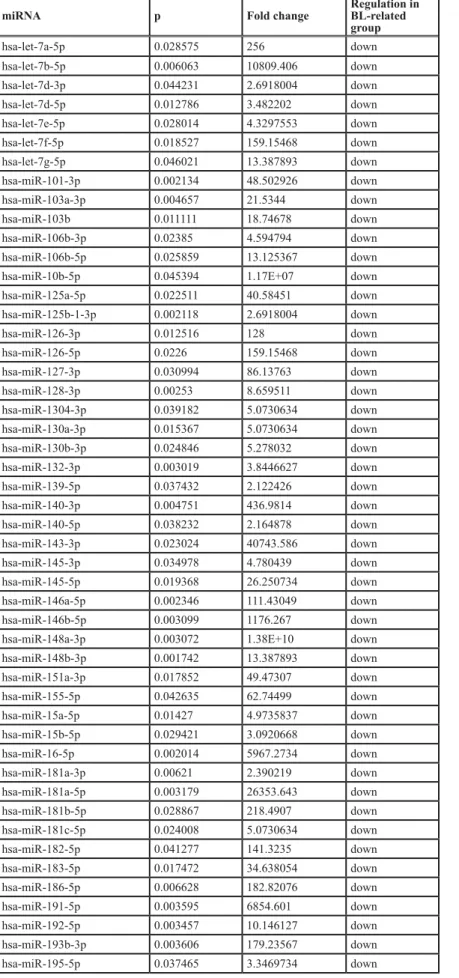
Table 5A: miRNA differentially expressed in the two PBL groups (BL-related versus EMPC-related) miRNA p Fold change Regulation in BL-related
group hsa-let-7a-5p 0.028575 256 down hsa-let-7b-5p 0.006063 10809.406 down hsa-let-7d-3p 0.044231 2.6918004 down hsa-let-7d-5p 0.012786 3.482202 down hsa-let-7e-5p 0.028014 4.3297553 down hsa-let-7f-5p 0.018527 159.15468 down hsa-let-7g-5p 0.046021 13.387893 down hsa-miR-101-3p 0.002134 48.502926 down hsa-miR-103a-3p 0.004657 21.5344 down hsa-miR-103b 0.011111 18.74678 down hsa-miR-106b-3p 0.02385 4.594794 down hsa-miR-106b-5p 0.025859 13.125367 down
hsa-miR-10b-5p 0.045394 1.17E+07 down
hsa-miR-125a-5p 0.022511 40.58451 down hsa-miR-125b-1-3p 0.002118 2.6918004 down hsa-miR-126-3p 0.012516 128 down hsa-miR-126-5p 0.0226 159.15468 down hsa-miR-127-3p 0.030994 86.13763 down hsa-miR-128-3p 0.00253 8.659511 down hsa-miR-1304-3p 0.039182 5.0730634 down hsa-miR-130a-3p 0.015367 5.0730634 down hsa-miR-130b-3p 0.024846 5.278032 down hsa-miR-132-3p 0.003019 3.8446627 down hsa-miR-139-5p 0.037432 2.122426 down hsa-miR-140-3p 0.004751 436.9814 down hsa-miR-140-5p 0.038232 2.164878 down hsa-miR-143-3p 0.023024 40743.586 down hsa-miR-145-3p 0.034978 4.780439 down hsa-miR-145-5p 0.019368 26.250734 down hsa-miR-146a-5p 0.002346 111.43049 down hsa-miR-146b-5p 0.003099 1176.267 down
hsa-miR-148a-3p 0.003072 1.38E+10 down
hsa-miR-148b-3p 0.001742 13.387893 down hsa-miR-151a-3p 0.017852 49.47307 down hsa-miR-155-5p 0.042635 62.74499 down hsa-miR-15a-5p 0.01427 4.9735837 down hsa-miR-15b-5p 0.029421 3.0920668 down hsa-miR-16-5p 0.002014 5967.2734 down hsa-miR-181a-3p 0.00621 2.390219 down hsa-miR-181a-5p 0.003179 26353.643 down hsa-miR-181b-5p 0.028867 218.4907 down hsa-miR-181c-5p 0.024008 5.0730634 down hsa-miR-182-5p 0.041277 141.3235 down hsa-miR-183-5p 0.017472 34.638054 down hsa-miR-186-5p 0.006628 182.82076 down hsa-miR-191-5p 0.003595 6854.601 down hsa-miR-192-5p 0.003457 10.146127 down hsa-miR-193b-3p 0.003606 179.23567 down hsa-miR-195-5p 0.037465 3.3469734 down
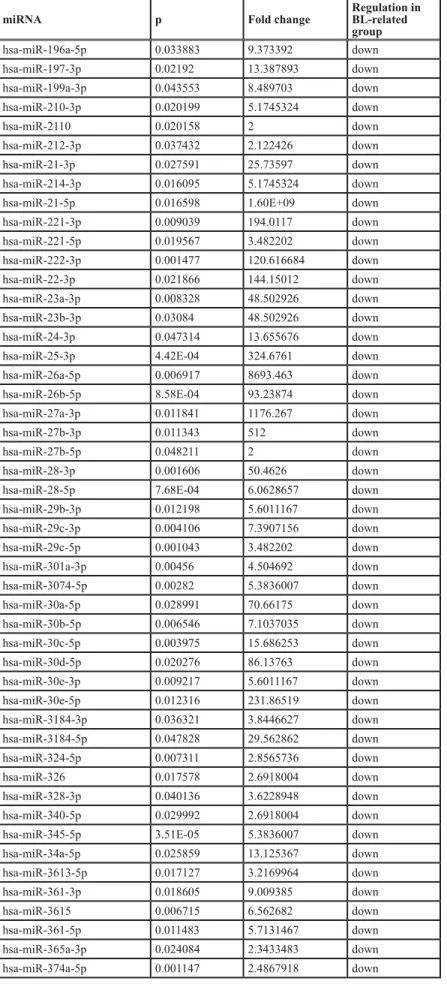
miRNA p Fold change Regulation in BL-related group hsa-miR-196a-5p 0.033883 9.373392 down hsa-miR-197-3p 0.02192 13.387893 down hsa-miR-199a-3p 0.043553 8.489703 down hsa-miR-210-3p 0.020199 5.1745324 down hsa-miR-2110 0.020158 2 down hsa-miR-212-3p 0.037432 2.122426 down hsa-miR-21-3p 0.027591 25.73597 down hsa-miR-214-3p 0.016095 5.1745324 down
hsa-miR-21-5p 0.016598 1.60E+09 down
hsa-miR-221-3p 0.009039 194.0117 down hsa-miR-221-5p 0.019567 3.482202 down hsa-miR-222-3p 0.001477 120.616684 down hsa-miR-22-3p 0.021866 144.15012 down hsa-miR-23a-3p 0.008328 48.502926 down hsa-miR-23b-3p 0.03084 48.502926 down hsa-miR-24-3p 0.047314 13.655676 down
hsa-miR-25-3p 4.42E-04 324.6761 down
hsa-miR-26a-5p 0.006917 8693.463 down
hsa-miR-26b-5p 8.58E-04 93.23874 down
hsa-miR-27a-3p 0.011841 1176.267 down
hsa-miR-27b-3p 0.011343 512 down
hsa-miR-27b-5p 0.048211 2 down
hsa-miR-28-3p 0.001606 50.4626 down
hsa-miR-28-5p 7.68E-04 6.0628657 down
hsa-miR-29b-3p 0.012198 5.6011167 down hsa-miR-29c-3p 0.004106 7.3907156 down hsa-miR-29c-5p 0.001043 3.482202 down hsa-miR-301a-3p 0.00456 4.504692 down hsa-miR-3074-5p 0.00282 5.3836007 down hsa-miR-30a-5p 0.028991 70.66175 down hsa-miR-30b-5p 0.006546 7.1037035 down hsa-miR-30c-5p 0.003975 15.686253 down hsa-miR-30d-5p 0.020276 86.13763 down hsa-miR-30e-3p 0.009217 5.6011167 down hsa-miR-30e-5p 0.012316 231.86519 down hsa-miR-3184-3p 0.036321 3.8446627 down hsa-miR-3184-5p 0.047828 29.562862 down hsa-miR-324-5p 0.007311 2.8565736 down hsa-miR-326 0.017578 2.6918004 down hsa-miR-328-3p 0.040136 3.6228948 down hsa-miR-340-5p 0.029992 2.6918004 down
hsa-miR-345-5p 3.51E-05 5.3836007 down
hsa-miR-34a-5p 0.025859 13.125367 down hsa-miR-3613-5p 0.017127 3.2169964 down hsa-miR-361-3p 0.018605 9.009385 down hsa-miR-3615 0.006715 6.562682 down hsa-miR-361-5p 0.011483 5.7131467 down hsa-miR-365a-3p 0.024084 2.3433483 down hsa-miR-374a-5p 0.001147 2.4867918 down
Key cellular signaling pathways and metabolic activities may be affected by deregulated cellular and viral miRNA
To explore the potential involvement of the detected miRNA in PBL pathogenesis, we searched for genes targeted by the miRNA discriminating the molecular subtypes of PBL that were previously confirmed as direct targets biochemically. Among others, we found genes encoding for tumor suppressors (PTEN, PBX2) and lipid metabolism controller (PPARGC1A, PLIN2/adipophilin) whose expression levels were found to be regulated by BART-19-5p, and FOXK2, a gene involved in the control
of viral and cellular promoter elements, regulated by hsa-miR148a-5p, has-miR-3609, has-miR-365.
The expression level of the encoded proteins was then checked by immunohistochemistry in 13 PBL cases. BL-related cases presented with significantly higher degree of expression of PTEN, PBX2, PPARGC1A, PLIN2/adipophilin and FOXK2 (Figure 6A-6E and) (p<0.05).
We also investigated the potential pathobiological relevance of these genes by gene set enrichment analysis (GSEA). We found several gene sets significantly enriched; among others those associated to Kruppel-like factor 1 (KLF1), enhancer of zeste 2 polycomb repressive complex 2 subunit (EZH2) and MYC appeared
hsa-miR-374b-5p 7.10E-04 3.1539128 down
hsa-miR-378a-3p 0.010879 59.125725 down hsa-miR-378d 0.007875 3.1539128 down hsa-miR-381-3p 0.015433 2.122426 down hsa-miR-423-3p 0.01819 64 down hsa-miR-425-5p 0.025742 10.146127 down hsa-miR-4448 0.043389 18.01877 down hsa-miR-454-3p 0.008394 5.0730634 down hsa-miR-4633-5p 0.030738 49.47307 down hsa-miR-497-5p 0.008057 4.244852 down hsa-miR-500a-3p 0.01973 3.0920668 down hsa-miR-502-3p 0.015503 3.031433 down hsa-miR-574-3p 0.018238 3.9215622 down hsa-miR-615-3p 0.032965 3.1539128 down hsa-miR-625-3p 0.016429 7.390717 down hsa-miR-629-5p 0.012786 3.482202 down hsa-miR-652-3p 0.037863 7.843124 down hsa-miR-654-3p 0.042732 2.3433483 down hsa-miR-660-5p 0.023198 2.5365317 down hsa-miR-664a-3p 0.007032 2.4867918 down hsa-miR-6737-5p 0.028424 2.0400033 down hsa-miR-92b-3p 0.004056 1747.9257 down hsa-miR-93-5p 0.014503 56.829643 down hsa-miR-96-5p 0.027386 3.482202 down hsa-miR-98-5p 0.037122 3.4139185 down hsa-miR-3178 0.025964 66.58581 up hsa-miR-3648 0.010903 4.080006 up hsa-miR-4492 0.037656 91768.664 up hsa-miR-4497 0.029851 3859.7363 up hsa-miR-4508 0.039168 1108.4174 up hsa-miR-5787 0.01597 22492.303 up hsa-miR-6087 0.032981 14.207409 up hsa-miR-6126 0.001043 12.125731 up hsa-miR-663b 0.019219 5.6011167 up hsa-miR-6739-5p 1.33E-04 3.482202 up hsa-miR-6743-5p 0.029317 4.594794 up hsa-miR-7704 0.026789 62990.94 up hsa-miR-8072 0.034227 2.0808065 up
of particular interest due to the high scores and consistent recurrence (Supplementary Table 5).
Novel miRNA discovery
We analyzed 13 PBL miRNA-seq libraries to identify candidate novel miRNA species that were deregulated in this tumor type. After sequence filtering, we enumerated 133 candidate novel miRNA, not identified in miRBase v21 (Supplementary Table 6). Differential expression analysis was carried out between PBL versus EMPC and PBL versus BL. We found 27 miRNA differentially expressed between PBL and BL, and 7 between PBL and EMPC (Supplementary Tables 7-8). Further, 17 miRNA discriminated the HIV positive cases from the HIV negative ones (Supplementary Table 9). Conversely, none of the putative novel miRNA were differentially expressed in PBLs according to their relation with EMPC or BL. Of note, one of these novel putative
miRNA mapped on the HIV genome. However, these preliminary observations need appropriate validation.
DISCUSSION
The pathogenesis of PBL has not been clearly defined but most likely it involves deregulation of terminal B-cell differentiation and apoptosis, via the effect of MYC gene rearrangements and possibly EBV infection [3]. To better understand the viral program expressed in PBLs, we performed a complete assessment of EBV-encoded genes and proteins, demonstrating a non-canonical latency-associated program with the expression of latency II characterizing viral proteins along with sporadic lytic cycle reactivation. Nonetheless, the absence of BLLF1/ gp350 expression in all the cases indicated an abortive lytic cycle in neoplastic cells. These results are consistent with previous findings, suggesting that EBV lytic reactivation may have pathogenic relevance in the context of both
Figure 5: Plasmablastic lymphomas differ in their miRNA profile according to the presence of HIV. Principal component analysis of HIV-positive and HIV-negative plasmablastic lymphomas (PBLs) indicated a rough distinction of the two groups based on miRNA expression A.. Supervised analysis (T-test) comparing HIV-positive versus HIV-negative PBLs identified a series of differentially expressed genes B.. In the matrix, the dendrogram was generated using a hierarchical clustering algorithm based on the average-linkage method. In the matrix, each column represents a sample and each row represents a gene. The colour scale bar shows the relative gene expression changes normalized by the standard deviation (0 is the mean expression level of a given gene). 5C. HIV-miR-367 expression in HIV positive and HIV negative PBL cases C.. HIV-miR-TAR-3p expression in HIV positive and HIV negative PBL cases D..
active and depressed immune response [6]. Intriguingly, we have recently demonstrated a non-canonical latency program with activation of the lytic cycle also in endemic BL cases, highlighting another overlap between PBL and BL [7].
The limited knowledge on PBL biology likely contributes to suboptimal management and poor prognosis of the patients. Therefore, in the present study we attempted to shed new light on the molecular bases of PBL. We studied for the first time the miRNA expression
profile of PBL and compared it with those of BL and EMPC, chosen as the closest neoplastic counterparts considering morphological, immunophenotypic, genetic and epidemiological factors.
For the first time we observed that PBL include at least two molecular subgroups that presented with clinico-pathological peculiar features, including MYC rearrangements and HIV-association that appeared as main drivers of this sub-classification. On the other hand, this might be also due to a dissimilar histogenesis, genetic Table 6: Molecular diagnosis of PBL versus EMPC: diagnostic accuracy of the 4-miRNA based classifier in the discovery set Conventional histopathology PBL EMPC miRNA profiling PBL 13 0 EMPC 0 7 Value 95% CI Accuracy SP 100% 100-100 ST 100% 100-100 PPV 100% 100-100 NPV 100% 100-100 LR+ 10 1.56 to 64.20 LR- NC NC Overall accuracy 100% (20/20) Pre-test probability 50% 28-72
Table 7: Molecular diagnosis of PBL versus EMPC: diagnostic accuracy of the 4-miRNA based classifier in the validation set Conventional histopathology PBL EMPC miRNA profiling PBL 10 1 EMPC 0 9 Value 95% CI Accuracy SP 90% 71-100 ST 100% 100-100 PPV 91% 74-100 NPV 100% 100-100 LR+ 10 1.56 to 64.20 LR- NC NC Overall accuracy 95% (19/20) Pre-test probability 50% 28-72
background and/or microenvironmental influences [5, 7, 8]. Interestingly, we found that the two PBL subgroups differed for the expression of proteins, the regulation of which might be sustained by the differentially expressed miRNA. These proteins turned out to be involved in relevant cellular processes including cell cycle and proliferation, signal transduction, apoptosis, viral replication, cell metabolism, epigenetic regulation of transcription (via EZH2) and differentiation. Of note, our findings unveiled another overlap between PBL and BL
related to the metabolic reprogramming of the neoplastic cells [9]. In fact, both PBL and BL showed an activation of the lipid metabolism characterized by the expression of adipophilin, likely related to MYC activity as previously reported in the B-cell setting [10, 11].
Furthermore, we identified specific differences between PBL and both BL and EMPC as far as miRNA expression was concerned. Of note, based on the expression of as few as 4 miRNA, we could efficiently perform a molecular differential diagnosis between
Figure 6: PTEN, PBX2, PPARGC1A, PLIN2/adipophilin, and FOXK2 protein expression in the two sub-groups of PBL. PTEN, PBX2, PPARGC1A, PLIN2/adipophilin and FOXK2 showed lower level of expression in all the PBL cases that clustered closer to the EMPC cases than to the BL cases; one representative case for each sub-group is depicted. A.-E., O.M.: 40x. PBL: plasmablastic lymphoma; EMPC: extramedullary plasmacytoma; BL: Burkitt lymphoma.
PBL and EMPC, even when anaplastic/plasmablastic EMPC were included. The latter, at present constitute real diagnostic challenges even for most experienced hematopathologists. Here, we demonstrated the efficiency of the molecular diagnostic tool in two independent cohorts of unselected cases, fulfilling the STARD criteria for molecular diagnostic. Phase 4 diagnostic accuracy studies are now warranted to prospectively evaluate the clinical utility of the test.
Finally, we observed that PBL molecular features are at least in part dependent on HIV status. Different mechanisms might be in place how HIV might contribute to PBL pathogenesis: duration and the degree of immunodeficiency, loss of immune control of oncogenic herpesviruses as EBV, chronic B-cell proliferation/ exhaustion due to chronic antigenic stimulation, and/ or factors unrelated to immune dysfunction, including a theoretically possible direct oncogenic effect. Actually, the involvement of HIV infection in PBL pathogenesis may explain the high frequency of this virus in PBL patients. In our analysis, HIV-positive and HIV-negative PBL cases differed in terms of cellular miRNA. This might be due in part to HIV itself by its own miRNA. However, only when qPCR was performed we could detect very low amounts of HIV-encoded miRNA in PBL cases. This likely reflected the inferior sensitivity of RNAseq analysis, especially when filters improving specificity and robustness are applied to RNAseq analysis. Indeed, the detection of viral miRNA is more likely consistent with the hypothesis that they were encoded in scattered T-cells, macrophages or dendritic cells rather than in the neoplastic clone. Nevertheless, their potential pathogenetic role in PBL cannot be excluded as miRNA are easily transferred through the tissues in the tumor microenvironment. Moreover, we identified by NGS a putative novel miRNA mapping on the HIV genome and highly expressed by PBL cells, the significance of which definitely need further analysis.
The major limitation of the study is probably the relatively low number of PBL cases analyzed (N=23). Nonetheless, it should be noted that all results have been validated in a cohort of cases independent from the discovery one, this making quite solid our assumptions [12].
In conclusion, the present study offers novel insights on PBL biology and pathogenesis that might be useful for the future management of this orphan disease in terms of classification, diagnosis and treatment. Particularly, an improved understanding of the complex interplay between genetic lesion and viral effects, as well as the multiple mechanisms regulating EBV reactivation might lead to the development of more specific therapies including miRNA-targeted therapies, MYC signaling pathways inhibitors, and combination of EBV lytic phase induction and anti-EBV drugs [13].
MATERIALS AND METHODS
Cases selection, immunohistochemistry, fluorescent in situ hybridization (FISH) and EBER-in-situ hybridization
For this study 23 PBL, 17 EMPC and 18 BL cases (9 endemic, 9 sporadic), collected at the Departments of Pathology of Aga Khan University Hospital, Nairobi (Kenya), Aga Khan Hospital, Kisumu (Kenya), Terni Hospital (Italy), and Siena University Hospital (Italy), were studied. Thirteen PBL, 7 EMPC and 9 BL (5 endemic) cases were used as discovery cohort for NGS-based miRNA profiling and EBV-latency assessment; 10 PBL, 10 EMPC and 10 BL cases were used as independent validation set of NGS analyses and were studied by qPCR and immunohistochemistry. The cases were reviewed by expert hemato-pathologists and diagnoses were confirmed by morphology on histological slides stained with haematoxylin and eosin (H&E) and Giemsa, and by immunophenotyping, according to the WHO [1, 14]. The following clinical data were collected: age, sex, disease location at presentation and an associated context of immunodeficiency.
Immunohistochemical studies were performed on representative paraffin sections from each case as previously reported [7, 15]. A large panel of antibodies (CD20, PAX-5, CD38, CD138, CD79a, CD10, BCL6, BCL2, MUM1, CD56, Igk, Igl) was applied to assess plasma cell differentiation. MYC protein expression and the proliferative index (by Ki-67) was evaluated. To rule out a diagnosis of ALK-positive large B-cell lymphoma or diffuse large B-cell lymphoma arising in multicentric Castlemann disease, immunohistochemical evaluation of ALK protein and HHV-8 was checked as well.
We studied the latency type of EBV by assessing the expression of some latent (1, EBNA-2, EBNA-3, LMP-1, LMP-2A) and lytic proteins (EA-D, EA-R, BZLF1/ZEBRA, BLLF1/gp350) by immunohistochemistry. In situ hybridization for the non-coding EBERs was carried out in each sample as previously described [7]. A control slide, prepared from a paraffin-embedded tissue block containing metastatic nasopharyngeal carcinoma in a lymph node, accompanied each hybridization run.
In addition, the expression level of the proteins (adipophilin, PPARGC1A, FOXK2, PBX2, and PTEN) encoded by the genes found to be potentially targeted by the cellular and viral miRNA deregulated in the studied tumors was checked in the different primary tumors to highlight their positive or negative regulation by miRNA [16]. Differences in protein expression between cases were analyzed using the Chi-square test with p<0.05 being
statistical significant.
For all the stains, negative controls were obtained for each case by replacing the specific antibody with non-immune serum immunoglobulins at the same concentration as the primary antibody. Sections of reactive lymphoid tissue and of lymph node with infectious mononucleosis were used as positive control for plasma cell differentiation and EBV latency type and lytic phase.
FISH analysis for MYC rearrangements was performed using both dual-fusion probes and split-signal probes for IGH and IGL loci as well as an LSI IGH/
MYC CEP 8 Tri-color dual-fusion probe (Vysis, Abbott
Molecular IL, USA) [15].
All the clinical, morphological, immunophenotypical and cytogenetic features of the discovery cohort patients are summarized in Table 1.
MicroRNA profiling
Total RNA was extracted from formalyn-fixed paraffed-embedded (FFPE) sections of primary tumors and reactive lymph nodes using the FFPE miRNA Easy kit (Qiagen, CA), according to the manufacturer’s instructions. Small RNA libraries were prepared from 1 µg of an high-quality RNA (RNA Integrity Number≥8) with the TruSeq Small RNA kit (Illumina). 1x36 sequencing was performed on the Illumina MiSeq platform. 36-bp length raw sequences were demultiplexed using the Illumina pipeline CASAVA v1.8. A quality check of the run experiment was performed by FastQC (http://www. bioinformatics.babraham.ac.uk/projects/fastqc). Low quality reads and adpater sequences were trimmed off using Trimmomatic [17]. The high quality reads, with a length of 17–36-bp were clipped and subsequently aligned to the latest mirBase release (v 21 July 2014) [18] by Novoalign (http://www.novocraft.com) MiRNA expression profiles were built by calculating the sum of read counts for each miRNA, according to the alignment criteria. Variance-stabilizing transformed count data were used to build an Euclidean distance matrix, followed by hierarchical clustering analysis to study the intra-samples correlations. miRNA differential expression analysis was performed using Bioconductor’s package DESeq [19]. The obtained read counts for each identified miRNA were first normalized by scaling for library size factors in order to deal with variation among samples. The differential expression values were estimated using a negative binomial distribution model and local regression to estimate the relationship between the dispersion and the mean of each miRNA. Raw values were considered as statistically significant for p <0.05. Following alignment and normalization, the data were analyzed using GeneSpring GX12 as previously described [20-25], by applying Pearson correlation (for unsupervised clustering) and two-tails Student t-test with p-value <0.05 and fold change >2 (for supervised clustering). The experimentally
validated targets for the viral and cellular miRNA were searched in public databases. For the viral miRNA, we used VIRmiRNA (http://crdd.osdd.net/servers/virmirna/) [26]; for the cellular miRNA, miRWalk 2 (http://zmf.umm. uni-heidelberg.de/apps/zmf/mirwalk2/) [27, 28]. Only proved direct interaction were then considered. Pathway analysis was performed by Gene Set Enrichment Analysis (GSEA) [29].
Reverse transcription-quantitative PCR (RT-qPCR)
The expression of EBV-encoded genes (EBNA-1,
EBNA-2, LMP-1, LMP-2, EBNA-3, BZLF-1 BMRF-1/ Ea-D, BHRF-1/Ea-R, BLLF1/gp350) characterizing
the different latency programs, has been investigated by RT-qPCR using the QuantiTect SYBR Green PCR Kit (Qiagen, CA). The stably expressed housekeeping gene hypoxanthine-guanine phosphoribosyltransferase (HPRT) was used as an endogenous control and reference gene for relative quantification of each target gene. The relative expression is expressed as 2ΔCt, where ΔCt is defined as the
difference in mean cycle thresholds of the gene of interest and HPRT.
The expression level of differentially expressed human (hsa-miR1304-3p, 3p, hsa-miR148a-5p, hsa-miR192-5p) and viral miRNA (EBV-miR-BART-10-5p, EBV-miR-BART-18-5p, EBV-miR-BART-19-3p), selected based on the score in differential analysis and the known biological relevance, was evaluated by using Taqman probes specific for each miRNA and for RNU6B (the endogenous control) (Apllied Viosystems, Applera, Italy). The relative expression of cellular miRNA was calculated using the 2-∆∆ctformula; for viral miRNA the
following formula was adopted: 2-∆ct [30]. Primers used for
qPCR analyses are detailed in Table 2.
Diagnostic accuracy evaluation
A diagnostic accuracy analysis was designed to test the ability of a newly developed molecular classifier (in particular of the 4-miRNAs based classifier) to discriminate PBL and EPCM. Calculations of sensitivity, specificity, positive predictive value, negative predictive value, positive and negative likelihood ratio, and odd ratio were made by CATmaker software (Centre for Evidence Based Medicine, Oxford University, http://www.cebm. net). The study was conducted according to the STARD guidelines for biomarker testing (Supplementary Table 1). Author contribution
The authors contributed in the following way: MRA, PPP and LL wrote the paper; PSV, SS, GLB, AG,
SA provided materials; LM, MP, SG, MN carried out the experiments; MRA, LM, SL, PPP and LL discussed and interpreted the results. PPP and LL conceived the study. All the authors read and approved the final manuscript.
ACKNOWLEDGMENT
The Authors would like to thank Professor Giulia De Falco (Queen Mary University of London, UK), Professor Pankaj Trivedi (University “la Sapienza”, Rome, Italy) and Professor Davide Gibellini (University of Verona, Italy) for providing their expertise in fruitful discussion.
CONFLICTS OF INTEREST
The authors declare no competing interests.
FUNDING
This work was supported BolognAIL, AIRC IG 2013 N.14355/Prof. Piccaluga, RFO (Prof. Piccaluga), and FIRB Futura 2011 RBFR12D1CB (Prof. Piccaluga).
REFERENCES
1. Stein H, Harris NL, Campo E. (2008). Plasmablastic lymphoma. In: Swerdlow S, Campo E, Harris NL, Jaffe ES, Pileri SA, Stein H, Thiele J, Vardiman J, eds. WHO Classification of Tumors of the Hematopoietic and Lymphoid Tissue. (Lyon.: IARC. ), pp. 262-4.
2. Taddesse-Heath L, Meloni-Ehrig A, Scheerle J, Kelly JC, Jaffe ES. Plasmablastic lymphoma with MYC translocation: evidence for a common pathway in the generation of plasmablastic features. Modern Pathology. 2010; 23: 991. 3. Castillo JJ, Bibas M, Miranda RN. The biology and
treatment of plasmablastic lymphoma. Blood. 2015; 125: 2323-30.
4. Vockerodt M, Yap LF, Shannon‐Lowe C, Curley H, Wei W, Vrzalikova K, Murray PG. The Epstein–Barr virus and the pathogenesis of lymphoma. The Journal of pathology. 2015; 235: 312-22.
5. Laurent C, Fabiani B, Do C, Tchernonog E, Cartron G, Gravelle P, Amara N, Malot S, Palisoc M, Copie-Bergman C. Immune-checkpoint expression in Epstein-Barr virus positive and negative plasmablastic lymphoma: a clinical and pathological study in 82 patients. Haematologica. 2016; 101:976-84.
6. Ma SD, Hegde S, Young KH, Sullivan R, Rajesh D, Zhou Y, Jankowska-Gan E, Burlingham WJ, Sun X, Gulley ML. A new model of Epstein-Barr virus infection reveals an important role for early lytic viral protein expression in the development of lymphomas. Journal of virology. 2011; 85: 165-77.
7. Abate F, Ambrosio MR, Mundo L, Laginestra MA, Fuligni
F, Rossi M, Zairis S, Gazaneo S, De Falco G, Lazzi S, Bellan C, Rocca BJ, Amato T, et al. Distinct Viral and Mutational Spectrum of Endemic Burkitt Lymphoma. PLoS Pathog. 2015; 11: e1005158.
8. Montes-Moreno S, Martinez-Magunacelaya N, Zecchini-Barrese T, de Villambrosía SG, Linares E, Ranchal T, Rodriguez-Pinilla M, Batlle A, Revert-Arce JB, Almaraz C. Plasmablastic lymphoma phenotype is determined by genetic alterations in MYC and PRDM1. Modern Pathology. 2017; 30: 85-94.
9. Ambrosio MR, Piccaluga PP, Ponzoni M, Rocca BJ, Malagnino V, Onorati M, De Falco G, Calbi V, Ogwang M, Naresh KN. The alteration of lipid metabolism in Burkitt lymphoma identifies a novel marker: adipophilin. PloS one. 2012; 7: e44315.
10. Schuhmacher M, Kohlhuber F, Hölzel M, Kaiser C, Burtscher H, Jarsch M, Bornkamm GW, Laux G, Polack A, Weidle UH. The transcriptional program of a human B cell line in response to Myc. Nucleic acids research. 2001; 29: 397-406.
11. Eberlin LS, Gabay M, Fan AC, Gouw AM, Tibshirani RJ, Felsher DW, Zare RN. Alteration of the lipid profile in lymphomas induced by MYC overexpression. Proceedings of the National Academy of Sciences. 2014; 111: 10450-5. 12. Altman N, Krzywinski M. Points of significance: P values and the search for significance. Nature Methods. 2017; 14: 3-4.
13. Daskalogianni C, Pyndiah S, Apcher S, Mazars A, Manoury B, Ammari N, Nylander K, Voisset C, Blondel M, Fåhraeus R. Epstein–Barr virus‐encoded EBNA1 and ZEBRA: targets for therapeutic strategies against EBV‐carrying cancers. The Journal of pathology. 2015; 235: 334-41. 14. Leoncini L, Raphaël M, Stein H, Harris NL, Jaffe ES, Kluin
PM. Burkitt lymphoma. In: Swerdlow S, Campo E, Harris NL, Jaffe ES, Pileri SA, Stein H, Thiele J, Vardiman J, eds. WHO Classification of Tumors of the Hematopoietic and Lymphoid Tissue. (Lyon.: IARC. ). 2008; pp. 262-4. 15. De Falco G, Ambrosio MR, Fuligni F, Onnis A, Bellan
C, Rocca BJ, Navari M, Etebari M, Mundo L, Gazaneo S, Facchetti F, Pileri SA, Leoncini L, et al. Burkitt lymphoma beyond MYC translocation: N-MYC and DNA methyltransferases dysregulation. BMC Cancer. 2015; 15: 668.
16. Ambrosio MR, Navari M, Di Lisio L, Leon EA, Onnis A, Gazaneo S, Mundo L, Ulivieri C, Gomez G, Lazzi S. The Epstein Barr-encoded BART-6-3p microRNA affects regulation of cell growth and immuno response in Burkitt lymphoma. Infectious agents and cancer. 2014; 9: 12. 17. Bolger AM, Lohse M, Usadel B. Trimmomatic: a flexible
trimmer for Illumina sequence data. Bioinformatics. 2014; 30: 2114-20.
18. Kozomara A, Griffiths-Jones S. miRBase: annotating high confidence microRNAs using deep sequencing data. Nucleic Acids Res. 2014; 42: D68-73.
19. Anders S, Huber W. Differential expression analysis for sequence count data. Genome Biol. 2010; 11: R106. 20. Navari M, Fuligni F, Laginestra MA, Etebari M, Ambrosio
MR, Sapienza MR, Rossi M, De Falco G, Gibellini D, Tripodo C, Pileri SA, Leoncini L, Piccaluga PP. Molecular signature of Epstein Barr virus-positive Burkitt lymphoma and post-transplant lymphoproliferative disorder suggest different roles for Epstein Barr virus. Front Microbiol. 2014; 5: 728.
21. Laginestra MA, Piccaluga PP, Fuligni F, Rossi M, Agostinelli C, Righi S, Sapienza MR, Motta G, Gazzola A, Mannu C, Sabattini E, Bacci F, Tabanelli V, et al. Pathogenetic and diagnostic significance of microRNA deregulation in peripheral T-cell lymphoma not otherwise specified. Blood Cancer J. 2014; 4: 259.
22. Navari M, Etebari M, De Falco G, Ambrosio MR, Gibellini D, Leoncini L, Piccaluga PP. The presence of Epstein-Barr virus significantly impacts the transcriptional profile in immunodeficiency-associated Burkitt lymphoma. Front Microbiol. 2015; 6: 556.
23. Hartigan JA. Clustering Algorithms. John Wiley & Sons, Inc, New York. 1975: 351 pp.
24. Eisen MB, Spellman PT, Brown PO, Botstein D. Cluster analysis and display of genome-wide expression patterns. Proc Natl Acad Sci U S A. 1998; 95: 14863-8.
25. Piccaluga PP, Navari M, De Falco G, Ambrosio MR, Lazzi S, Fuligni F, Bellan C, Rossi M, Sapienza MR, Laginestra MA. Virus-encoded microRNA contributes to the molecular profile of EBV-positive Burkitt lymphomas. 2016; 7: 224-40. http://doi.org/10.18632/oncotarget.4399.
26. Qureshi A, Thakur N, Monga I, Thakur A, Kumar M. VIRmiRNA: a comprehensive resource for experimentally validated viral miRNAs and their targets. Database (Oxford). 2014; 2014.
27. Dweep H, Gretz N, Sticht C. miRWalk database for miRNA-target interactions. Methods Mol Biol. 2014; 1182: 289-305.
28. Dweep H, Sticht C, Pandey P, Gretz N. miRWalk--database: prediction of possible miRNA binding sites by “walking” the genes of three genomes. J Biomed Inform. 2011; 44: 839-47.
29. Subramanian A, Tamayo P, Mootha VK, Mukherjee S, Ebert BL, Gillette MA, Paulovich A, Pomeroy SL, Golub TR, Lander ES, Mesirov JP. Gene set enrichment analysis: a knowledge-based approach for interpreting genome-wide expression profiles. Proc Natl Acad Sci U S A. 2005; 102: 15545-50.
30. Zhang G, Zong J, Lin S, Verhoeven RJ, Tong S, Chen Y, Ji M, Cheng W, Tsao SW, Lung M. Circulating Epstein– Barr virus microRNAs miR‐BART7 and miR‐BART13 as biomarkers for nasopharyngeal carcinoma diagnosis and treatment. Int J Cancer. 2015;136:E301-12.