Research Article
Fibre Tip Sensor with Embedded FBG-LPG for
Temperature and Refractive Index Determination by means of
the Simple Measurement of the FBG Characteristics
C. Berrettoni,
1,2C. Trono,
1V. Vignoli,
2and F. Baldini
11IFAC-CNR, “Nello Carrara” Institute of Applied Physics, Via Madonna del Piano 10, 50019 Sesto Fiorentino, Italy
2Information Engineering and Mathematics Department, Siena University, Via Roma 56, 53100 Siena, Italy
Correspondence should be addressed to C. Trono; [email protected] Received 15 December 2014; Accepted 10 March 2015
Academic Editor: Tao Zhu
Copyright © 2015 C. Berrettoni et al. This is an open access article distributed under the Creative Commons Attribution License, which permits unrestricted use, distribution, and reproduction in any medium, provided the original work is properly cited. A novel optical fibre sensing system based on a hybrid long period grating (LPG) and Bragg grating (FBG) configuration is proposed and demonstrated experimentally. The hybrid configuration, which uses the difference in temperature and refractive index (RI) different response of a Bragg grating and a long period grating, makes it possible to discriminate simultaneously the temperature and the refractive index of different aqueous solutions. RI (1.33 RIU–1.40 RIU) and temperature (21∘C–28∘C) working ranges have been experimentally determined. Experimental results show that the maximum accuracy in the refractive index measurement (0.004 RIU) with temperature compensation has been achieved within the working ranges.
1. Introduction
Owing to their many advantages, such as compactness, electromagnetic interference immunity, high sensitivity, and multiplexing capabilities, optical fibre sensors (OFSs) based on gratings have attracted considerable interest in the context of chemical and biochemical sensing [1].
According to the grating period, fibre gratings can be classified into short period gratings (or fibre Bragg gratings, FBGs, period in a range of hundreds of nanometres) and long period gratings (LPGs, period in a range of hundreds of micrometres).
FBGs induce the coupling of the fundamental core prop-agating mode to its respective counter propprop-agating mode, while LPGs are characterized by mode coupling between the propagating core mode and copropagating cladding modes which gives rise to a series of attenuation bands in the transmission spectrum centred at discrete wavelengths that verify the matching condition of each coupled cladding mode [2,3]. In the last case, the resonance wavelengths of the LPG coupled cladding modes depend on the external refractive index [4] and any modulation of the core and cladding
guiding properties will modify the spectral response of the LPG.
Grating based sensors have been proposed for a wide range of applications including measurements of strain, temperature, pressure, and refractive index (RI) and many examples are reported in literature. However, in the context of sensing, one of the most significant limitations is the sensitivity of both grating structures to different parameters: for FBGs strain and temperature and for LPGs strain, tem-perature, and external refractive index.
In order to overcome the strain-temperature cross sensitivity effect and to make possible multiparameter measurements, several techniques and configurations were thoroughly investigated and proposed in literature. These solutions include configurations based on dual-wavelength superimposed gratings [5,6], tilted FBG [7], FBGs written in fibres with different diameters [8], and hybrid LPG/FBG [9]. To determine separately the temperature and the refrac-tive index of different aqueous solutions, many configurations have been proposed, including Mach-Zehnder interferom-eter realized on tapered optical fibre [10], hybrid cascaded LPG/FBG configuration integrated with a thermostabilized
Volume 2015, Article ID 491391, 8 pages http://dx.doi.org/10.1155/2015/491391
taneously discriminate between temperature and refractive index of different aqueous solutions by means of a LPG and a FBG written in the same optical fibre section, by simply mea-suring both the wavelength shift and the amplitude modula-tion of the peak corresponding only to the FBG resonance. This approach has been already proposed [13], but only a theoretical simulation is reported and at our knowledge it is the first time that this method has been experimentally verified.
The design and the characterization of the hybrid optical sensor are described and the results show the possibility to obtain an accurate value of the refractive index of different aqueous solutions making a temperature correction by mon-itoring only the Bragg reflected spectrum in terms of reflected power changes and resonance wavelength shifts.
In particular, while the Bragg resonance wavelength shifts are just related to temperature variations, both temperature and external refractive index changes have effect on the Bragg reflected spectrum.
The experiments demonstrate that good accuracy, simple structure, and easy operation for correcting temperature effect are the advantages of the proposed device.
2. Materials and Methods
2.1. Principle of Operation. Since the LPG is inherently
sensitive to both RI and temperature, one of the most impor-tant issues of the LPG based sensor is the discrimination of those two parameters. A hybrid structure of LPG and FBG is a straightforward solution to facilitate simultaneous measurement of such parameters, since the FBG’s response is not affected by changes in the surrounding RI.
A schematic diagram of the proposed structure is shown inFigure 1(a). The sensor probe consists of a LPG followed by a FBG, both permanently inscribed on the same optical fibre. In particular, the FBG must be designed to be spectrally located on the edge of the LPG’s response and the final trans-mission spectrum must have the shape shown inFigure 1(b). The fact that both gratings resonance peaks occupy the same bandwidth is the key point of the proposed configuration. Moreover, the spectral position and the spectral distance between LPG and FBG influence the RI and𝑇 working range of the sensor.
The hybrid LPG-FBG structure is sensitive to any changes in the temperature and the refractive index of the surround-ing medium that leads to a shift of both gratsurround-ing resonance wavelengths and thus to a modification of the transmission spectrum reported inFigure 1(b).
These changes induced by temperature and external refractive index perturbations on both grating resonance wavelengths could be expressed by the following equations:
Δ𝜆FBG= 𝑔 (Δ𝑇) = 𝑠𝑇Δ𝑇,
Δ𝜆LPG= 𝑔(Δ𝑇, Δ𝑛) = 𝑠𝑇Δ𝑇 + 𝑓 (Δ𝑛) ,
(1)
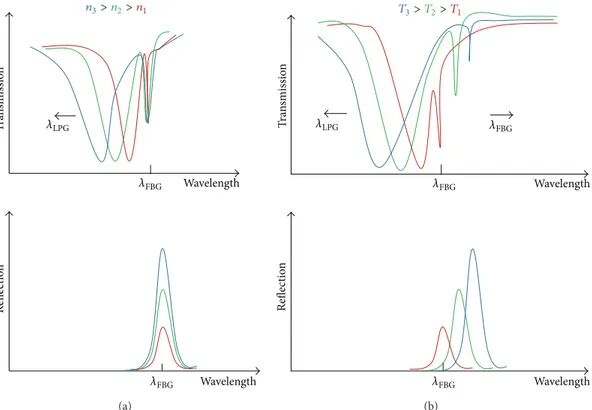
the refractive index and the temperature of the solution increase, the LPG’s resonance peak will move toward shorter wavelengths (blue shift). On the contrary, the FBG’s peak will move toward longer wavelengths (red shift) as temperature increases and will be unchanged for external refractive index changes.
To clarify the working principle of the sensor, we can considerFigure 2, where separate qualitative analysis of the effects due to temperature as well as refractive index on the transmission and reflected spectrum is reported. Any changes in the surrounding refractive index (Figure 2(a)) determine only the shift of the LPG resonance wavelength which leads to a simple amplitude modulation of the Bragg reflected spectrum. On the contrary, when temperature changes occur, the resonance wavelength of both gratings is shifted (Figure
2(b)) and this leads not only to an amplitude modulation of the Bragg reflected power, but also to a Bragg resonance wavelength shift. Therefore, the𝑇 and RI information can be deduced by monitoring only the Bragg reflected spectrum in terms of Bragg wavelength shift and reflected power changes. As will be described and experimentally demonstrated in the next section, the behaviour of the sensor could be described by the following equations:
Δ𝜆FBG(Δ𝑇) = 𝑠𝑇Δ𝑇, (2)
Δ𝑃FBG(Δ𝑇, Δ𝑛) = 𝛼𝑇Δ𝑇 + 𝑓 (𝑛) . (3)
As shown in(2), the FBG’s wavelength is exclusively influ-enced by temperature changes and this relationship can be used to separate the𝑇 and the RI effects. Substituting(2)in
(3), it is possible to figure the relationship between Bragg’s reflected power, the wavelength shift, and the RI changes. One has
Δ𝑃FBG= 𝛾Δ𝜆FBG+ 𝑓 (𝑛) , (4)
where𝛾 = 𝑠𝑇/𝛼𝑇is the sensor thermal sensitivity.
Both relationships described by(2)and(4)are, respec-tively, linear within a temperature and a wavelength range. The width of these intervals is related to the mutual position of the gratings on the transmission spectrum.
As a matter of fact, the choice of the temperature as well as wavelength working ranges of the sensor depends on the proper choice of the gratings location on the transmission spectrum: the more grating’s peaks are distant on the trans-mission spectrum, the smaller is the range of the linearity response.
Through(4), the function𝑓(𝑛) related to the surrounding RI can be obtained as follows:
𝑓 (𝑛) = Δ𝑃FBG− 𝛾Δ𝜆FBG. (5)
As shown by(5), the wavelength shift induced by temperature is used for the temperature compensation.
Finally, by inverting the function𝑓(𝑛) obtained from(5), the temperature compensated RI value is obtained.
Fibre coating FBG LPG (a) Wavelength T ra n smissio n 𝜆LPG𝜆FBG (b)
Figure 1: (a) Schematic of the LPG/FBG hybrid sensor; (b) transmission spectrum of the proposed sensor.
Wavelength Wavelength Refle ct io n T ra n smissio n 𝜆LPG 𝜆FBG 𝜆FBG n3>n2>n1 (a) Wavelength T ra n smissio n Refle ct io n 𝜆LPG 𝜆FBG 𝜆FBG Wavelength 𝜆FBG T3>T2>T1 (b)
Figure 2: Schematic of the transmission and reflected spectrum of the hybrid sensor with refractive index (a) and temperature (b) changes.
3. Experimental Setup
3.1. Fabrication of the Gratings. The FBG is inscribed within
photosensitive boron-germanium codoped optical fibre (Fibercore PS1250/1500) by irradiating it through a rectangu-lar phase mask (1059.9 nm phase mask period) with an Exci-mer KrF Laser (LAMBDA PHYSIC COMPex 110). The cha-racteristics of the fabricated FBG are as follows:∼1534 nm resonance wavelength and 1 cm length.
The LPG is written by a point-to-point technique within the same optical fibre, using the same laser. In this case the fibre is mounted on a motorized translation stage and is irradiated by the laser spot which is properly focused by means of a cylindrical lens and shaped through a micrometric
slit [8]. Both the translation stage and the laser action are controlled and synchronized by a PC, which makes it possible to choose both the grating period and the number of shots for each step. The grating period, the resonance wavelength, and the length of the fabricated LPG are 360𝜇m, 1530.4 nm, and 1.8 cm, respectively.
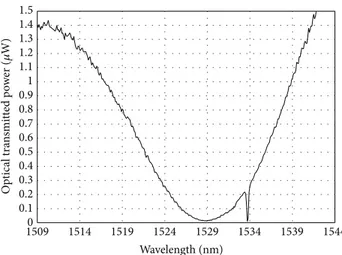
Figure 3 shows the transmission spectrum of the fibre obtained at the end of the writing process of the two gratings. As it can be seen, the attenuation bands of both gratings occupy the same bandwidth, which is the key point of the pro-posed working principle as shown inFigure 1(b). Moreover, the position of the Bragg resonance very close to the LPG resonance peak ensures the widest possible𝑇 and RI operat-ing ranges. The achievement of the FBG and LPG resonance
0 0.1 0.2 0.3 0.4 0.5 0.6 0.7 0.8 0.9 1 1509 1514 1519 1524 1529 1534 1539 1544 Wavelength (nm) Op tical tra n smi tt ed p o w
Figure 3: Transmission spectrum of the hybrid sensor at the end of the writing process.
Thermocouple Optical power meter Optical fibre coupler FBG interrogation analyzer Thermostatic bath Solutions
Figure 4: Experimental setup.
wavelengths centred at 1533.7 nm and 1530.4 nm, respectively, assures that this point is satisfied.
3.2. Interrogation System. In order to characterize the sensing
performance of the cascaded LPG and FBG configuration, the surrounding refractive index (SRI) and thermal (𝑇) sensitivities have been measured separately by analysing only the Bragg reflected spectrum.Figure 4shows the experimen-tal setup for this preliminary characterization. The sensing probe containing the gratings is placed into a thermostatic bath, whose temperature can be controlled by means of a thermocouple with a resolution of 0.1∘C.
A Wave Capture FBG Interrogator System (with a wave-length range of 1510 nm–1590 nm and a resolution of 1 pm) is used for the detection of the Bragg reflected power and Bragg’s resonance wavelength shift. Finally, an Optical Power Meter (ANDO AQ-2105 Optical Power Meter) is used in order to control and compensate any power fluctuations.
For the thermal characterization, the hybrid sensor is placed in a vial filled with pure water (refractive index 1.33) and placed into the thermostatic bath. The temperature of the thermal bath was heated from 14∘C up to 63∘C.
The response of the sensor in terms of resonance wave-length shift and Bragg reflected power was collected with the Bayspec-FBG Interrogator.
For the refractive index characterization, aqueous glycer-ine solutions at different concentrations with refractive index ranging from 1.33 to 1.47 with a step of10−2were used. The sensor was washed with distilled water after dipping in every aqueous glycerine solution. During the measurements the temperature was monitored and kept constant at 21∘C.
4. Results and Discussion
As mentioned in the previousSection 2.1, the sensor response to temperature and refractive index changes can be obtained by monitoring only the Bragg reflection spectrum. When temperature increases, both the LPG and FBG resonance wavelengths shift to shorter and longer wavelengths, retively, leading to a modification of the Bragg reflected spec-trum in terms of reflected power modulation and resonance wavelength shift. In contrast, when surrounding refractive index changes, only the LPG resonance wavelength shifts, leading to an amplitude modulation of the Bragg reflected spectrum. Therefore, since the Bragg wavelength shift is induced only by temperature changes, it is possible to discriminate simultaneously the effects of temperature and refractive index.
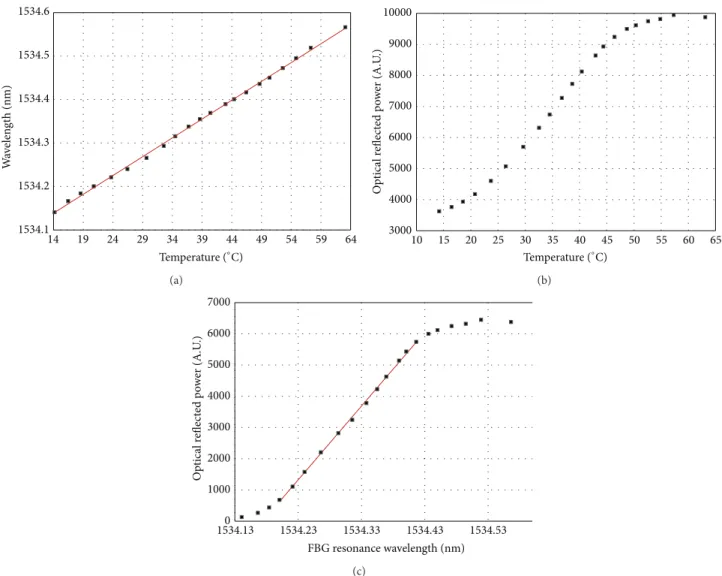
The analysis of the thermal and RI response of the optical sensor was carried out with the experimental setup described in Section 3.2. Figure 5(a) shows the measured FBG wavelength shift as function of the temperature, when the water in the thermal bath was heated from 14∘C to 63∘C. As expected, the Bragg wavelength shift has a good linear behaviour with temperature variation, demonstrating a thermal sensitivity of (8.65 ± 0.07) pm C−1. Thus, based on the experimental results,(2)can be expressed as follows:
Δ𝜆FBG(𝑇) = 𝑠𝑇Δ𝑇 = (8.65 ± 0.07) pm C−1Δ𝑇. (6)
Furthermore, the dependence of the FBG reflected power on temperature in water (1.33 RIU), reported inFigure 5(b), is linear in a range of temperature between 21∘C and 46∘C. Since the dependence of FBG’s resonance wavelength and Bragg reflected power with temperature are both linear, it is possible to express directly the Bragg reflected power in terms
1534.1 1534.2 1534.3 1534.4 1534.5 1534.6 14 19 24 29 34 39 44 49 54 59 64 W av elen gt h (nm) Temperature (∘C) (a) 3000 4000 5000 6000 7000 8000 9000 10000 10 15 20 25 30 35 40 45 50 55 60 65 Op tical r eflec ted p o w er (A.U .) Temperature (∘C) (b) 0 1000 2000 3000 4000 5000 6000 7000 1534.13 1534.23 1534.33 1534.43 1534.53 Op tical r eflec ted p o w er (A.U .) FBG resonance wavelength (nm) (c)
Figure 5: Thermal response of the hybrid sensor: (a) dependence of the FBG’s wavelength shift on temperature; (b) relationship between Bragg reflected power and temperature; (c) relationship between Bragg reflected power and Bragg’s resonance, temperature-induced, wavelength shift.
of Bragg’s resonance, temperature-induced, wavelength shift, as previously described inSection 2.1. As it can be observed (Figure 5(c)), this relationship is linear in a wavelength range from 1534.2 nm to 1534.4 nm. Hence, within this temperature and wavelength ranges (21∘C < 𝑇 < 46∘C and 1534.2 nm < RI < 1534.4 nm), the FBG’s reflected power has a linear relationship with wavelength changes and can be expressed by the following equation:
Δ𝑃FBG(𝑇) = 𝛾Δ𝜆FBG = (23640 ± 240) A.U ⋅ nm−1, (7)
where𝛾 is the temperature sensitivity of the sensor provided by the slope of the fitting curve (red line) reported in
Figure 5(c).
After the temperature characterisation, the sensor was characterised in terms of refractive index changes. The sensor was immersed in solutions with different RI prepared by mixing glycerol with deionized water in different ratios from 0% to 100%. The RI changes from 1.33 of pure water up to 1.47 of the last solution and the experiment was carried out
at a constant temperature (21∘C) with the setup described in
Section 3.2.
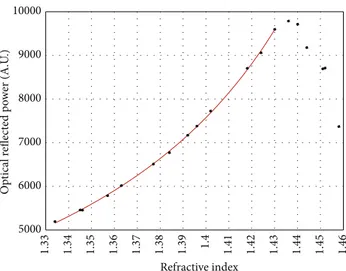
Figure 6 shows the measured Bragg reflected power changes due to solution’s RI ranging from 1.33 to 1.47 at a temperature of 21∘C.
As it can be observed, the Bragg reflected power has a nonlinear behaviour with an increase up to 1.43 and a steeper decrease for RI values greater than 1.43. In the range from 1.33 to 1.43, a good fitting of the experimental data is obtained by means of a rational curve expressed by the following equation:
𝑃FBG(𝑛) =
𝑏 + 𝑐𝑛
𝑎 + 𝑛 (8)
with the coefficients𝑎, 𝑏, and 𝑐 providing the fitting parame-ters of the rational curve (𝑎 = −1.55, 𝑏 = −875, and 𝑐 = 161). The sensor maximum RI sensitivity is reached when the RI of the aqueous solution is very close to the cladding one.
In order to evaluate the working range of the hybrid sensor, a temperature characterization of the sensor for
5000 6000 7000 8000 1.33 1.34 1.35 1.36 1.37 1.38 1.39 1.4 1.41 1.42 1.43 1.44 1.45 1.46 Refractive index Op tical r efle ct ed p o w er (A.U
Figure 6: The relationship between Bragg reflected power and external refractive index at 21∘C.
0 1000 2000 3000 4000 5000 6000 7000 1534.13 1534.18 1534.23 1534.28 1534.33 1534.38 1534.43 1534.48 1534.53 1534.58 Op tical r eflec ted p o w er (A.U .) FBG resonance wavelength (nm) 46∘C 21∘C (a) 8250 8500 8750 9000 9250 9500 9750 1534.18 1534.23 1534.28 1534.33 1534.38 1534.43 1534.48 Op tical r eflec ted p o w er (A.U .) FBG resonance wavelength (nm) 24∘C 19∘C (b)
Figure 7: Temperature response at refractive index values 1.33 (pure water) and 1.43.
different values of refractive index in the range between 1.33 and 1.43 was carried out.
The measurement of the thermal response in pure water (𝑛 = 1.33) reveals a linear behaviour of the Bragg reflected power with respect to the resonance wavelength (Figure 7(a)) in a temperature range between 21∘C and 46∘C. Instead, when considering the solution with𝑛 = 1.43, the temperature range of linear response is smaller: from 19∘C to 24∘C (Figure 7(b)). This effect can be explained by observing both the qualita-tive description inFigure 2and the transmission spectrum reported in Figure 3: as the RI of the solution increases, the LPG’s resonance wavelength has a blue shift leading to an increase of the grating’s resonance wavelength spectral distance. Thus, considering RI changes from 1.33 up to 1.43 the temperature range in which the relationship between the reflected power and the Bragg resonance wavelength is linear is very small: from 21∘C up to 24∘C. The reduction of the
thermal linear range is due to the LPG’s resonance wavelength shift towards shorter wavelengths when the RI is increased.
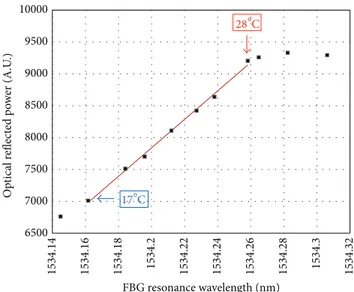
In order to extend the temperature range of linearity, the analysis was performed considering solutions with refractive index ranging from 1.33 to 1.40. Thus, considering this RI range, the temperature interval of linear response is larger: from 21∘C up to 28∘C, as shown inFigure 8.
With reference to the solution with𝑛 = 1.40 the thermal sensitivity has the following expression:
𝛾 = (23330 ± 570) A.U ⋅ nm−1. (9)
From(5), the thermal compensated RI information can be achieved. The thermal coefficient𝛾 is directly measured from the thermal response of the Bragg reflected power with respect to FBG’s wavelength. Therefore, the RI response of the sensor is obtained by measuring the variation of the reflected
6500 7000 7500 8000 8500 9000 9500 10000 1534.14 1534.16 1534.18 1534.2 1534.22 1534.24 1534.26 1534.28 1534.3 1534.32 Op tical r eflec ted p o w er (A.U .) FBG resonance wavelength (nm) 28∘C 17∘C
Figure 8: The temperature response at refractive index 1.40.
4500 5500 6500 7500 8500 9500 1.33 1.34 1.35 1.36 1.37 1.38 1.39 1.4 1.41 1.42 1.43 Op tical r eflec ted p o w er (A.U .) Refractive index 27∘C 19∘C
Figure 9: Temperature correction effect: Bragg reflected power before (red circles) and after (black square) the thermal compensation. The fitting curve describes the RI response of the sensor at 21∘C (the same ofFigure 6).
power and subtracting the contribution of the wavelength shift due to the temperature variation. Finally, by inverting the rational function expressed by(8), which describes the SRI response, the refractive index of the surrounding solution can be calculated.
In order to further demonstrate the correct operating principle of the proposed sensor for refractive index mea-surements with temperature compensation, a final test has been carried out. The sensor was immersed in solutions with different refractive index and in nonisothermal conditions, and both the Bragg resonance wavelength shift and the Bragg reflected power were measured with the Bayspec interrogator. InFigure 9the Bragg reflected power before (red circles) and after (black square) the thermal compensation, are reported. Using the compensation equation(4), the corrected points are distributed around the same fitting curve described previously (Figure 6), which describes the RI response of the sensor at 21∘C. Hence the thermal effects are compen-sated. Considering all measurement error sources, the optical reflected power obtained from (4)is affected by a relative
error of about 2.5%. Moreover, since the sensitivity of the sensor is not constant in the 1.33–1.40 range, the maximum accuracy is achieved for high RI values.
The proposed solution allows measuring the RI of dif-ferent solution by compensating the thermal effect in a temperature range from 21∘C to 28∘C and for RI ranging from 1.33 to 1.40 with an accuracy of about4 ⋅ 10−3.
If it is needed to change these intervals, as mentioned in
Section 2, the design parameters of both gratings have to be redefined, in order to change their mutual position on the transmission spectrum.
5. Conclusions
In conclusion, a hybrid grating based sensor for simultaneous measurement of temperature and refractive index solutions is proposed and experimentally demonstrated. The 𝑇 and the RI information can be deduced by monitoring only the Bragg reflected spectrum in terms of Bragg’s wavelength shift and reflected power changes, and this provides a noticeable
a temperature compensation between 21C and 28C. The maximum accuracy of the sensor is approximately 4 ⋅ 10−3RIU in the range 1.37 RIU–1.40 RIU. In terms of
sensitivity and accuracy, the achieved sensor response is comparable with commercially available refractometers.
Thanks to the high chemical inertness of silica optical fibres, the proposed hybrid sensor can be safely applied in a wide variety of environments without risk of contamination of the surrounding medium and degradation of the sensor and, for these reasons, it is also suitable for very long term measurements (months or years).
Even if the dynamics in terms of temperature is not too much broad, the present sensor can be very useful for those applications where the temperature changes are limited to changes of the order of few degrees, as it occurs in laboratory measurements or is some industrial applications where the temperature is only roughly stabilised.
Conflict of Interests
The authors declare that there is no conflict of interests regarding the publication of this paper.
References
[1] F. Baldini, M. Brenci, F. Chiavaioli, A. Giannetti, and C. Trono, “Optical fibre gratings as tools for chemical and biochemical sensing,” Analytical and Bioanalytical Chemistry, vol. 402, no. 1, pp. 109–116, 2012.
[2] K. O. Hill and G. Meltz, “Fiber Bragg grating technology funda-mentals and overview,” Journal of Lightwave Technology, vol. 15, no. 8, pp. 1263–1276, 1997.
[3] T. Erdogan, “Cladding-mode resonances in short- and long-period fiber grating filters,” Journal of the Optical Society of
America A: Optics and Image Science, and Vision, vol. 14, no. 8,
pp. 1760–1773, 1997.
[4] V. Bhatia, “Applications of long-period gratings to single and multi-parameter sensing,” Optics Express, vol. 4, no. 11, pp. 457– 466, 1999.
[5] M. G. Xu, J.-L. Archambault, L. Reekie, and J. P. Dakin, “Simul-taneous measurement of strain and temperature using fibre grating sensors,” in Tenth International Conference on Optical
Fibre Sensors, vol. 2360 of Proceedings of SPIE, pp. 191–194,
Glasgow, UK, October 1994.
[6] M. G. Xu, J.-L. Archambault, L. Reekie, and J. P. Dakin, “Dis-crimination between strain and temperature effects using dual-wavelength fibre grating sensors,” Electronics Letters, vol. 30, no. 13, pp. 1085–1087, 1994.
[7] E. Chehura, S. W. James, and R. P. Tatam, “Temperature and strain discrimination using a single tilted fibre Bragg grating,”
Optics Communications, vol. 275, no. 2, pp. 344–347, 2007.
[8] S. W. James, M. L. Dockney, and R. P. Tatam, “Simultaneous independent temperature and strain measurement using in fibre Bragg grating sensor,” Electronics Letters, vol. 32, no. 12, pp. 1133–1134, 1996.
[10] P. Lu, L. Men, K. Sooley, and Q. Chen, “Tapered fiber Mach-Zehnder interferometer for simultaneous measurement of refractive index and temperature,” Applied Physics Letters, vol. 94, no. 13, Article ID 131110, 2009.
[11] C. Trono, F. Baldini, M. Brenci, F. Chiavaioli, and M. Mugnaini, “Flow cell for strain- and temperature-compensated refractive index measurements by means of cascaded optical fibre long period and Bragg gratings,” Measurement Science and
Technol-ogy, vol. 22, no. 7, Article ID 075204, 2011.
[12] X. Chen, K. Zhou, L. Zhang, and I. Bennion, “Simultaneous measurement of temperature and external refractive index by use of a hybrid grating in D fiber with enhanced sensitivity by HF etching,” Applied Optics, vol. 44, no. 2, pp. 178–182, 2005. [13] D. A. Chamorro Enr´ıquez, A. R. da Cruz, and M. T. M. Rocco
Giraldi, “Hybrid FBG-LPG sensor for surrounding refractive index and temperature simultaneous discrimination,” Optics
Submit your manuscripts at
http://www.hindawi.com
VLSI Design
Hindawi Publishing Corporation
http://www.hindawi.com Volume 2014 Machinery
Hindawi Publishing Corporation
http://www.hindawi.com Volume 2014 Hindawi Publishing Corporation http://www.hindawi.com
Journal of
Engineering
Volume 2014
Hindawi Publishing Corporation
http://www.hindawi.com Volume 2014
Shock and Vibration
Hindawi Publishing Corporation
http://www.hindawi.com Volume 2014
Mechanical Engineering
Advances in
Hindawi Publishing Corporation
http://www.hindawi.com Volume 2014
Civil Engineering
Advances inAcoustics and VibrationAdvances in Hindawi Publishing Corporation
http://www.hindawi.com Volume 2014
Hindawi Publishing Corporation
http://www.hindawi.com Volume 2014
Electrical and Computer Engineering
Journal of Hindawi Publishing Corporation
http://www.hindawi.com Volume 2014 Distributed Sensor Networks International Journal of
The Scientific
World Journal
Hindawi Publishing Corporationhttp://www.hindawi.com Volume 2014
Sensors
Journal ofHindawi Publishing Corporation
http://www.hindawi.com Volume 2014
Modelling & Simulation in Engineering
Hindawi Publishing Corporation
http://www.hindawi.com Volume 2014
Hindawi Publishing Corporation
http://www.hindawi.com Volume 2014
Active and Passive Electronic Components Hindawi Publishing Corporation
http://www.hindawi.com Volume 2014 Chemical Engineering International Journal of Control Science and Engineering Journal of
Hindawi Publishing Corporation
http://www.hindawi.com Volume 2014
Antennas and Propagation
International Journal of
Hindawi Publishing Corporation
http://www.hindawi.com Volume 2014
Hindawi Publishing Corporation
http://www.hindawi.com Volume 2014 Navigation and Observation International Journal of Advances in OptoElectronics
Hindawi Publishing Corporation
http://www.hindawi.com Volume 2014
Robotics
Journal ofHindawi Publishing Corporation