BAP1 regulates IP3R3-mediated Ca
2+flux to mitochondria
suppressing cell transformation
Angela Bononi1, Carlotta Giorgi2, Simone Patergnani2, David Larson1, Kaitlyn
Verbruggen1, Mika Tanji1, Laura Pellegrini1, Valentina Signorato1,2, Federica Olivetto1,2,
Sandra Pastorino1, Masaki Nasu1, Andrea Napolitano1, Giovanni Gaudino1, Paul Morris1,
Greg Sakamoto1, Laura K. Ferris3, Alberto Danese2, Andrea Raimondi4, Carlo Tacchetti4,5,
Shafi Kuchay6, Harvey I. Pass6, El Bachir Affar7, Haining Yang1,*, Paolo Pinton2,*, and
Michele Carbone1,*
1University of Hawaii Cancer Center, University of Hawaii, Honolulu, Hawaii, USA
2Department of Morphology, Surgery and Experimental Medicine, University of Ferrara, Ferrara, Italy
3Department of Dermatology, University of Pittsburgh Medical Center, Pittsburgh, Pennsylvania, USA
4Experimental Imaging Center, San Raffaele Scientific Institute Milano, Italy 5Department of Experimental Medicine, University of Genova, Genova, Italy 6Cancer Center, New York University, New York, New York 10065, USA
7Maisonneuve-Rosemont Hospital Research Center, Department of Medicine, University of Montréal, Montréal, Quebec, Canada
Abstract
BRCA1-associated protein 1 (BAP1) is a potent tumor suppressor gene that modulates environmental carcinogenesis1-3. All carriers of inherited heterozygous germline BAP1
Users may view, print, copy, and download text and data-mine the content in such documents, for the purposes of academic research, subject always to the full Conditions of use: www.nature.com/authors/editorial_policies/license.html#terms
Correspondence and requests for material should be addressed to M. C. ([email protected]), Paolo Pinton ([email protected]) or Haining Yang ([email protected]).
*Co-corresponding authors
Supplementary Information is available in the online version of the paper.
Author contributions. M.C. conceived the study. A.B. led the experiments and prepared the figures. M.C., S.Pas and H.Y. built
pedigrees. M.N. and M.T genotyped patients and controls. P.M., G.S., L.K.F. performed skin biopsies. A.B., C.G, K.V established fibroblasts cell cultures. A.B., C.G., S.P., V.S. independently conducted and reproduced cell death assays. D.L. performed flow cytometry experiments. A.R. and C.T. performed EM studies. A.B. and C.G. performed subcellular fractionation studies. A.B. performed WB, CoIP, aequorin-based Ca2+ measurements and in vitro cell transformation assays. C.G. and S.P. performed single cells Ca2+ measurements. C.G., S.P., F.O., performed IF studies. A.D. performed PLA studies. A.B. with the help of S.K. performed ubiquitylation assays. L.P. performed qRT-PCR studies. A.B., C.G. and S.P., with the help of E.B.A. performed IR and UV radiation studies. A.N., S.Pas., G.G., and H.I.P. critically discussed the results. M.C., H.Y. and P.P. coordinated the study and oversaw the results. A.B. and M.C., wrote the manuscript with help from co-authors.
Authors information. M.C. has a pending patent applications on BAP1. M.C. provides consultation for mesothelioma diagnosis. The
authors have no other potential competing financial interests.
HHS Public Access
Author manuscript
Nature
. Author manuscript; available in PMC 2017 December 14. Published in final edited form as:Nature. 2017 June 22; 546(7659): 549–553. doi:10.1038/nature22798.
A
uthor Man
uscr
ipt
A
uthor Man
uscr
ipt
A
uthor Man
uscr
ipt
A
uthor Man
uscr
ipt
inactivating mutations (BAP1+/-) developed one and often several BAP1-/- malignancies in their lifetime4, mostly malignant mesothelioma (MM), uveal melanoma (UVM)2,5, etc6-10. Moreover, BAP1 acquired biallelic mutations are frequent in human cancers8,11-14. BAP1 tumor suppressor activity has been attributed to its nuclear localization where BAP1 helps maintaining genome integrity15-17. The possible activity of BAP1 in the cytoplasm was unknown. Cells with reduced levels of BAP1 exhibit chromosomal abnormalities and decreased DNA repair by homologous recombination18, indicating that BAP1 dosage is critical. Cells with extensive DNA damage should die and not grow into malignancies. We discovered that BAP1 localizes at the endoplasmic reticulum (ER). Here BAP1 binds, deubiquitylates and stabilizes type-3
inositol-1,4,5-trisphosphate-receptor (IP3R3), modulating calcium (Ca2+) release from the ER into the cytosol and mitochondria, promoting apoptosis. Reduced levels of BAP1 in BAP1+/- carriers caused reduction of both IP3R3 levels and Ca2+ flux, preventing BAP1+/- cells that had accumulated DNA damage from executing apoptosis. A higher fraction of cells exposed to either ionizing or
ultraviolet radiation, or to asbestos, survived genotoxic stress resulting in a higher rate of cellular transformation. We propose that the high incidence of cancers in BAP1+/- carriers results from the combined reduced nuclear and cytoplasmic BAP1 activities. Our data provide a mechanistic rationale for the powerful ability of BAP1 to regulate gene-environment interaction.
BAP1 is a member of the ubiquitin C-terminal hydrolase (UCH) subfamily of
deubiquitylating enzymes2. The ubiquitin-conjugating enzyme UBE2O induces BAP1 sequestration in the cytoplasm by multi-monoubiquitylation of its nuclear localization signal (NLS). BAP1 counteracts this mechanism and regulates its own nuclear translocation by intra-molecular auto-deubiquitylation of the same sites19. Since there is a well-established mechanism to keep BAP1 in the cytoplasm, BAP1 may exert also some cytoplasmic activity. We tested this hypothesis in primary fibroblasts we derived from skin punch biopsies from members of the W and L families, in which we originally discovered that BAP1 mutations caused a novel cancer syndrome, the “BAP1 cancer syndrome”2,5.
About 50% of the W and L family members inherited BAP1 mutations2,5. We established fibroblast cell cultures from 7 BAP1+/- carriers and from 7 age and gender-matched wild-type BAP1 (BAP1WT) control family members (Supplementary Fig. 1a, b). Therefore, one of the main strengths of our data is that they are specific to the human condition and cannot be influenced by factors other than the reduced levels of BAP1 such as, for example, the many genetic mutations that are found in all tumor derived cell lines. Cells from BAP1+/- carriers contained ∼50% of BAP1 protein compared to controls (Extended Data Fig. 1a-d) and did not show any differences in growth or cell cycle progression (Extended Data Fig. 1e, f).
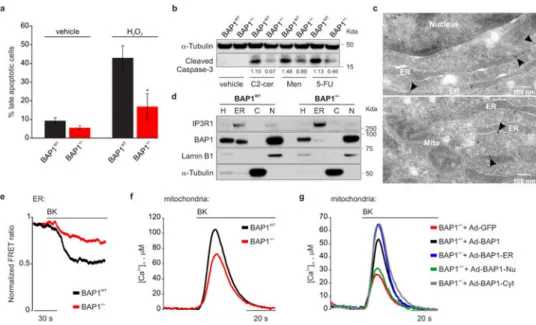
Annexin V and propidium iodide (PI) staining, and Western blot (WB) measuring cleaved caspase-3 levels, revealed that 7/7 BAP1+/- fibroblast cell cultures were more resistant to various apoptotic drugs compared to 7 matched BAP1WT fibroblast cell cultures (Fig. 1a, b and Extended Data Fig. 1g-l). We obtained similar results by down-regulating BAP1, in BAP1WT primary human mesothelial cells (HM) (Extended Data Fig. 1m).
Although all known activities of BAP1 have been ascribed to its nuclear localization2, apoptosis is a process largely regulated in the cytoplasm. Subcellular fractionation of
A
uthor Man
uscr
ipt
A
uthor Man
uscr
ipt
A
uthor Man
uscr
ipt
A
uthor Man
uscr
ipt
primary BAP1WT fibroblasts, HM, cells of the MM cell lines PPM-Mill, and HEK-293 (Extended Data Fig. 2a), revealed that extra-nuclear BAP1 was specifically present in the ER fraction, findings confirmed by electron microscopy (EM, Fig. 1c) and immunofluorescence (IF) (Extended Data Fig. 2b-e). BAP1 ER levels were reduced more than nuclear levels in BAP1+/- fibroblasts (Fig. 1d, and Extended Data Fig. 2f-h).
The ER is the major store of intracellular Ca2+ 20,21. IP3Rs are ER channels that control Ca2+ release from the ER to the cytoplasm and the mitochondria22,23. Transient Ca2+ release promotes mitochondrial ATP production; excessive or prolonged Ca2+ release triggers apoptosis via mitochondrial Ca2+ overload and opening of the mitochondrial permeability transition pore24. The drugs shown in Fig. 1a, b and Extended Data Fig. 1g-m induce apoptosis via ER-Ca2+ release25. We hypothesized that BAP1 was involved in the regulation of intracellular Ca2+ homeostasis. We transfected BAP1+/- and BAP1WT fibroblasts with ER targeted cameleon (D1ER), a fluorescent probe to measure Ca2+ concentrations23. Cells were stimulated with bradykinin (BK), an agonist that causes ER Ca2+ release through the IP3Rs, or with H2O2. Compared to WT, BAP1+/- fibroblasts released lower amounts of Ca2+ from the ER (Fig. 1e, Extended Data Fig. 3a-c and Supplementary Table 1), findings suggestive of reduced flow of Ca2+ through the IP3Rs. Accordingly, we detected lower Ca2+ concentrations in the cytosol and the mitochondrial matrix of BAP1+/- compared to BAP1WT fibroblasts stimulated with BK (Fig. 1f, Extended Data Fig. 3d-g, and Supplementary Table 1, 2) or H2O2 (Extended Data Fig. 3h-m, and Supplementary Table 1, 2), independently of extracellular Ca2+ influx from the plasma membrane (Extended Data Fig. 3n and
Supplementary Table 1). The results were reproducible in all 7 BAP1+/- and 7 matching BAP1WT fibroblasts studied, as well as in 3 cell cultures of primary HM cells in which BAP1 was silenced (Extended Data Fig. 3o, p and Supplementary Table 2). We obtained similar results in mice adult fibroblasts (MAF) we derived from Bap1+/- mice3 compared to Bap1WT mice (Extended Data Fig. 3q, r and Supplementary Table 2).
To test if cytoplasmic BAP1 modulates Ca2+ fluxes independently from nuclear BAP1, we built 3 adenoviral chimeras that specifically localize BAP1 to the nucleus (BAP1-Nu), the cytoplasm (BAP1-Cyt), and the outer surface of the ER (BAP1-ER), (Extended Data Fig. 4a): only the cytoplasmic and ER chimeras regulated Ca2+ changes (Fig. 1g, Extended Data Fig. 4b and Supplementary Table 1, 2).
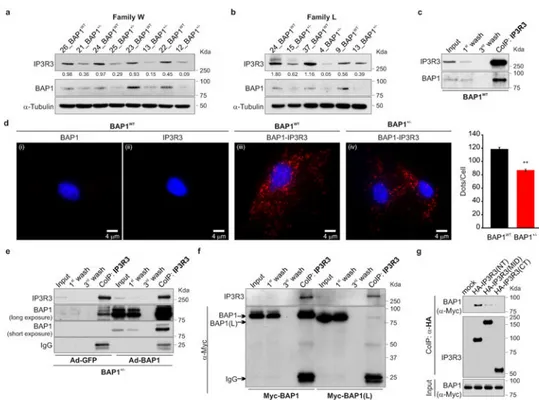
IP3Rs can be rapidly ubiquitylated and degraded by the proteasome26. Fibroblasts from BAP1+/- donors contained reduced IP3R3 protein levels (the isoform that controls apoptosis27) compared to BAP1WT (Fig. 2a, b and Extended Data Fig. 5a-c). Similarly, human MM cells with mutated BAP1 (>60% of sporadic MM carry somatic BAP1 mutations11,14) contained reduced levels of IP3R3 (Extended Data Fig. 5d). IP3R3 mRNA (ITPR3) levels measured by qRT-PCR were similar in BAP1WT and BAP1+/- fibroblasts (Extended Data Fig. 5e), suggesting that the differences observed were not transcriptionally regulated. We hypothesized that BAP1 might deubiquitylate and stabilize IP3R3. We found that IP3R3 co-immunoprecipitates (CoIP) BAP1 (Fig. 2c), findings supported by proximity ligation assay (PLA) (Fig. 2d) and IF (Extended Data Fig. 6a). BAP1-IP3R3 CoIP was barely detectable in BAP1+/- fibroblasts; BAP1 rescue significantly increased the amount of BAP1 that CoIP with IP3R3 (Fig. 2e). We confirmed the specificity of the BAP1 interaction
A
uthor Man
uscr
ipt
A
uthor Man
uscr
ipt
A
uthor Man
uscr
ipt
A
uthor Man
uscr
ipt
with IP3R3 in HEK-293 cells expressing FLAG-BAP1 (Extended Data Fig. 6b). Instead, overexpression of the Myc-tagged truncated BAP1 L-mutant [Myc-BAP1(L)] (the L-family mutant BAP1 which lacks the N-terminus domain5) showed an almost complete loss of interaction with IP3R3 compared to Myc-tagged WT BAP1 (Myc-BAP1) (Fig. 2f), while catalytic inactive BAP1(C91S)2,19 did bind IP3R3 (Extended Data Fig. 6c). We found that BAP1 binds the N-terminus domain of IP3R3 [IP3R3(NT)] (Fig. 2g). Deletion fragments of BAP1 revealed that its catalytic domain (UCH) does not bind IP3R3(NT), while its middle portion (NORS) and, to a minor extent, the C-terminal portion (CTD, NLS) do (Extended Data Figure 6e, f). Overexpression of the N-terminus of the IP3R3 binds and sequesters BAP1 leading to decreased IP3R3 levels, an effect counter-balanced by BAP1 co-overexpression (Extended Data Fig. 6d).
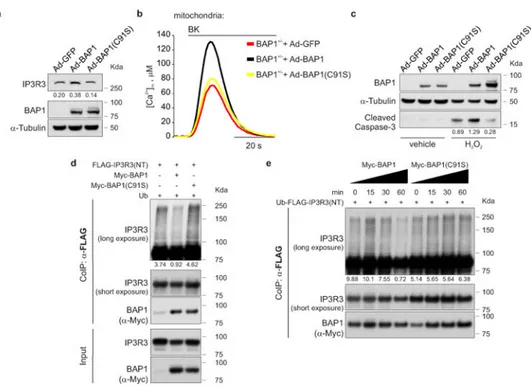
Silencing of BAP1 in BAP1WT fibroblasts consistently caused a reduction of IP3R3 protein levels (Extended Data Fig. 7a), with concomitant reduction of mitochondrial Ca2+ responses (Extended Data Fig. 7b, c, and Supplementary Table 1, 2), and protection from apoptosis (Extended Data Fig. 7d). Likewise, silencing of IP3R3 (Extended Data Fig. 7e) in BAP1WT fibroblasts reduced mitochondrial Ca2+ concentration (Extended Data Fig. 7f, g and Supplementary Table 1, 2) and apoptosis (Extended Data Fig. 7h). Similar results were obtained in HM (Extended Data Fig. 7i, j and Supplementary Table 2). Transduction of BAP1+/- fibroblasts with adenoviruses encoding BAP1, but not the catalytic inactive mutant BAP1(C91S)2,19, rescued IP3R3 protein levels (Fig. 3a), mitochondrial Ca2+ uptake (Fig. 3b, Extended Data Fig. 8j, Supplementary Table 1, 2) and resulted in enhanced apoptosis (Fig. 3c). Similar results were obtained in Phi and HMESO cells, BAP1-/- MM cell lines in which we reintroduced BAP1 or BAP1(C91S), and in HM in which we silenced BAP1 and then re-introduced BAP1 or BAP1(C91S). BAP1 stabilized IP3R3 and increased
mitochondrial Ca2+ concentrations and apoptosis; BAP1(C91S) did not (Extended Data Fig. 8a-h and Supplementary Table 2). Moreover, in contrast to BAP1, mutated BAP1(W) and BAP1(L), did not influence [Ca2+]m following 1 μM BK stimulation (Extended Data Fig. 8i, and Supplementary Table 2).
In vitro ubiquitylation assays using purified recombinant proteins revealed that BAP1 counteracts the ubiquitylation of IP3R3(NT) (Fig. 3d). The in vitro deubiquitylating activity of BAP1 on IP3R3(NT) became detectable 30 minutes after adding BAP1 to the reaction, and was stronger at 60 minutes (Fig. 3e). BAP1(C91S), despite being able to bind IP3R3 (Extended Data Fig. 6c), failed to deubiquitylate IP3R3(NT) (Fig. 3d, e and Extended Data Fig. 8k, l), underscoring the requirement of BAP1 catalytic activity.
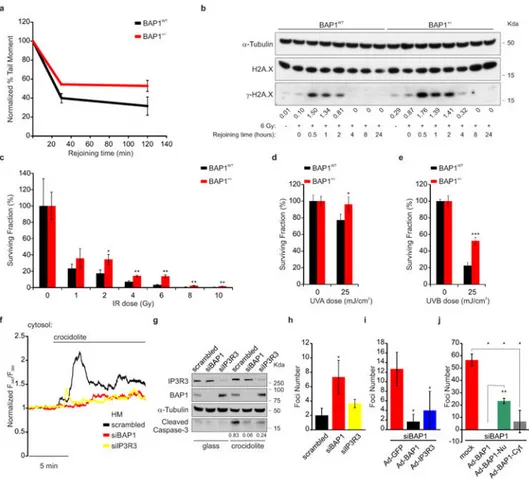
Comet assays showed that BAP1+/- fibroblasts had a reduced ability to repair DNA damage following exposure to ionizing radiation (IR) (Fig. 4a and Extended Data Fig. 9a), findings supported by kinetics analyses showing a prolonged phosphorylation of γ-H2A.X indicating that DNA repair was delayed (Fig. 4b). In spite of the reduced ability of BAP1+/- cells to repair IR-induced DNA damage, clonogenic assays revealed increased survival of BAP1+/- cells compared to BAP1WT following IR (Fig. 4c and Extended Data Fig. 9b). Moreover, ultraviolet radiation, UVA and UVB (UVB is a more potent carcinogen than UVA) induced ER Ca2+ release, was significantly impaired in BAP1+/- fibroblasts (Extended Data Fig. 9c-e), and UVB induced prolonged phosphorylation of γ-H2A.X (Extended Data Fig. 9f).
A
uthor Man
uscr
ipt
A
uthor Man
uscr
ipt
A
uthor Man
uscr
ipt
A
uthor Man
uscr
ipt
Clonogenic assays in fibroblasts from BAP1+/- individuals and matched controls, exposed to UVA or UVB, revealed a reproducible significant increase of colony formation in BAP1+/- fibroblasts (24% increase UVA, and 132% UVB) (Fig. 4d, e, and Extended Data Fig. 9g).
Moreover, we discovered that crocidolite asbestos increases intracellular Ca2+
concentrations (Fig. 4f, Extended Data Fig. 10a and Supplementary Table 1) and apoptosis (Fig. 4g and Extended Data Fig. 10b). HM silenced for either BAP1 or IP3R3 and exposed to crocidolite, displayed reduced intracellular Ca2+ concentrations (Fig. 4f, Extended Data Fig. 10a and Supplementary Table 1) and were resistant to apoptosis (Fig. 4g, Extended Data Fig. 10b). Similar results were obtained in THP-1, a human monocytic cell line in which we down-regulated BAP1 with siRNAs, underscoring the general relevance of this mechanism (Extended Data Fig. 10c-e, and Supplementary Table 2). We used an established protocol in which primary HM exposed to crocidolite in the presence of TNF-α undergo in vitro transformation, which is measured as formation of tridimensional foci28. HM treated with siBAP1 and exposed to crocidolite showed a significant increase in foci formation (Fig. 4h). Silencing of IP3R3 was less effective in increasing foci formation compared to BAP1 silencing, indicating that both nuclear and cytoplasmic BAP1 act in concert to prevent malignant transformation (Fig. 4h). Moreover, transduction of either BAP1 or IP3R3 in HM silenced for BAP1 significantly reduced foci formation (Fig. 4i). To test the independent contribution of cytoplasmic and nuclear BAP1 to cellular transformation, we silenced BAP1 and then infected HM with the BAP1 chimeras (Extended Data Fig. 4a). Transduction with BAP1-Cyt that specifically localizes to the cytoplasm where it modulates intracellular Ca2+ fluxes (Fig. 1g), significantly reduced foci formation to levels similar to those obtained using BAP1 (Fig. 4j). Cells infected with BAP1-Nu which localizes only to the nucleus, showed reduced foci formation although the reduction was significantly less than cells infected with BAP1 (Fig. 4j).
It is unlikely that mutated cytoplasmic BAP1 contributed to some of the biological effects observed. With one single exception in one case of UVM, all BAP1 mutations described impair the ability of BAP1 to translocate into the nucleus, either because the NLS is deleted, as in the L and W BAP1+/- fibroblasts studied here, or because the catalytic domain is inactive8,11-14, 19. Mutated cytoplasmic BAP1 forms amyloid-like aggregates and is
biologically inactive29, although it may be detectable by immunostaining2,5,11. In the W and L cells, truncation removes a critical domain for the interaction with IP3R3 (Fig. 2f). Accordingly, mutated W and L BAP1 did not influence Ca2+ signaling (Extended Data Fig. 8i, and Supplementary Table 2).
In summary, we discovered that in the cytoplasm BAP1 localizes at the ER, where it binds, deubiquitylates and stabilizes IP3R3, thus regulating ER Ca2+ release and promoting apoptosis. Decreased levels of BAP1 lead to enhanced DNA damage (due to decreased nuclear BAP1 activity), reduced apoptosis (due to decreased cytoplasmic BAP1 activity) and increased cellular transformation (due to both, decreased nuclear and cytoplasmic activities). The separate activities of BAP1 in the nucleus and cytoplasm provide a mechanistic
rationale for the strong tumor suppressor activity of this deubiquitylase. Our data suggest that the reduced levels of BAP1 result in a tumor phenotype prevalently under genotoxic/ stress conditions (gene-environment interaction). Accordingly, 70% of BAP1+/-
A
uthor Man
uscr
ipt
A
uthor Man
uscr
ipt
A
uthor Man
uscr
ipt
A
uthor Man
uscr
ipt
heterozygous mice developed MM within a year when exposed to asbestos, and none of the non-exposed BAP1+/- mice developed MM during the same period of time3. Although almost any tumor type has been reported in carriers of germline BAP1 mutations1,2,4-10, there is a prevalence of MM, often caused by asbestos, and of melanomas and skin cancers, often caused by UV radiation4. These two environmental carcinogens induce DNA damage and cell death. The balance between DNA damage and cell death determines the outcome: the more DNA-damaged cells survive exposure, the higher the risk that one of them may grow into a malignancy. It is possible that the malignancies more frequently associated with the BAP1 cancer syndrome arise from tissues in which Ca2+-induced apoptosis plays a critical role in cellular transformation.
Our findings 1) reveal the relevance of post translational modifications in modulating gene-environment interactions in human carcinogenesis, 2) are relevant to understanding the high incidence of environmentally related cancers in carriers of germline BAP1 mutations, and 3) provide novel targets for the numerous human malignancies that carry acquired and
inherited BAP1 mutations2,5-13,30.
Methods
Subjects
BAP1+/- mutant carriers and unaffected controls were recruited from the L and W families; they donated the skin biopsies from which we derived the fibroblast cell cultures studied here. In previous studies we demonstrated that ∼50% of L and W family members inherited heterozygous BAP1 mutations5. Except for being adult members of these 2 families, no other predefined inclusion/exclusion criteria were applied. Written informed consent was received from all participants (BAP1+/- mutant carriers, and gender and age matched unaffected family members). Collection and use of patient information and samples were approved by the Institutional Review Board (IRB) of the University of Hawaii (IRB no. 14406). Germline BAP1 sequencing was conducted on genomic DNA extracted from peripheral blood using standard methods and analyzed using bidirectional sequencing of the BAP1 gene in the Hawaii Cancer Consortium Queen Medical Center CLIA/CAP certified laboratory, as described5. Fourteen family members (7 BAP1WT and 7 BAP1+/-) volunteered their skin biopsies for these studies and they were matched by gender and age. Assuming a two-tailed Type I error rate (alpha) equal to 0.05 and seven observations per group (14 total), we had 80 % power to detect a standardized difference equal to 1.8. Since we found a statistical difference, we had sufficient power to detect a pre-specified effect size.
Primary cultures of human dermal fibroblasts were established in tissue culture from biopsies of sun-protected forearm skin from donors of different gender and age. Biopsies were taken using a 5 mm punch (Schuco) on skin site previously disinfected and
anesthetized31.
Cell cultures
We derived human dermal skin fibroblasts from explants of skin biopsies from four BAP1WT and four BAP1+/- Wisconsin (W) family members, and three BAP1WT and three BAP1+/-
A
uthor Man
uscr
ipt
A
uthor Man
uscr
ipt
A
uthor Man
uscr
ipt
A
uthor Man
uscr
ipt
Louisiana (L) family members. Fibroblasts were grown from these skin explants and cultured in Dulbecco modified Eagle's medium (DMEM) with glucose (4.5 g/l), 2 mM L-glutamine, without sodium pyruvate (Corning Cellgro), supplemented with 10% (v/v) fetal bovine serum (FBS) (Gibco) and 1% Penicillin-Streptomycin (PS)31. All the experiments were performed on fibroblasts between tissue culture passages 7 and 15. Primary human mesothelial cells (HM): we routinely establish HM in tissue culture from pleural fluids that accumulate in individuals with congestive heart failure or other non-malignant conditions, who provided written informed consent. HM are characterized by immunohistochemistry and cultured in DMEM with 20% FBS, as previously described32. Independent HM cultures from three different donors between tissue culture passages 4-5 were used in the
experiments described here; each experiment for each of these HM cell cultures was conducted in triplicate. MM cell lines: PPM-Mill, Phi, HMESO, Rob33 (established and provided by Dr. Harvey I. Pass), and human embryonic kidney cells (HEK-293, provided by Dr. Paolo Pinton) were grown in DMEM supplemented with 10% FBS and 1% PS. HMESO stable clones were generated as described below (see “Gene silencing with siRNA,
adenovirus-mediated gene transfer and transfection”), and grown in DMEM with glucose (4.5 g/l), 2 mM L-glutamine, without sodium pyruvate (Corning Cellgro), supplemented with 10% (v/v) FBS (Gibco), 1% PS and 0.5 mg/ml G418 (Geneticin). THP-1 cells (human monocytic cell line from acute monocytic leukemia,) were obtained from ATCC and cultured in RPMI-1640 Medium (Corning Cellgro) supplemented with 10% (v/v) FBS (Gibco) and 1% PS; treatment with 20 μM 12-O-Tetradecanoylphorbol 13-acetate (TPA) for 24 hours was performed to induce monocytes differentiation into macrophages34. Mouse adult fibroblasts (MAF) cell cultures were derived from 3-month-old Bap1WT and Bap1+/- mice35 genotyped as described35; MAFs were grown in DMEM supplemented with 10% FBS and 1% PS. Cells were cultured in a humidified atmosphere of 5% (v/v) carbon dioxide in air at 37 °C. All cells used in the experiments reported here were routinely tested for mycoplasma contamination (about once a month) using LookOut Mycoplasma PCR Detection Kit (Sigma-Aldrich, cat no. MP0035) and were confirmed to be mycoplasma-free.
All main experiments were conducted in primary cells from human volunteers (fibroblasts and HM). Therefore, the results are related to the reduced levels of BAP1 present in cells derived from carriers of heterozygous germline BAP1 mutations and to the reduced levels of BAP1 we induced in primary HM by siRNA. In other words, the results presented could not be influenced by the numerous genetic alterations that are found in tumor derived cell lines. Some confirmatory experiments were conducted in cell lines. None of the cell lines used in this paper were found in the ICLAC or NCBI Biosample databases of misidentified cell lines. Short-tandem repeat analyses were performed upon arrival of these cell lines in our laboratory for authentication. Re-authentication of the cell lines confirming their identity was performed by “Genetica DNA Laboratories, LabCorp” in July 2015.
Growth curves
Fibroblasts cell cultures proliferation was measured using the AlamarBlue® assay (AbD Serotec, cat. no. BUF012B). Following incubation of the cells in 96-well plates, 10% v/v AlamarBlue was added and fluorescence was measured (excitation 560 nm, emission 590 nm) at the indicated time points.
A
uthor Man
uscr
ipt
A
uthor Man
uscr
ipt
A
uthor Man
uscr
ipt
A
uthor Man
uscr
ipt
Gene silencing with siRNA, adenovirus-mediated gene transfer and transfection
siRNA oligonucleotides were obtained from Qiagen. GeneSoluton siRNAs targeting four different BAP1 mRNAs: Hs_BAP1_1, cat.no: SI00066696; Hs_BAP1_2, cat.no:
SI00066703; Hs_BAP1_3, cat.no: SI00066710; Hs_BAP1_5, cat.no: SI03036390.
GeneSoluton siRNAs targeting four different IP3R3 mRNAs (ITPR3): Hs_ITPR3_1, cat.no: SI00034580; Hs_ ITPR3_2, cat.no: SI00034587; Hs_ ITPR3_3, cat.no: SI00034594; Hs_ ITPR3_4, cat.no: SI00034601. Negative control siRNA, cat.no: 1027280. Transfection was performed with HiPerfect (Qiagen), using siRNAs at 10 nM final concentrations in 0.1% FBS medium for 24 hours. Unless otherwise specified in the Figures, a pool of the 4 different siRNAs, listed above, was used to silence BAP1 or IP3R3.
Adenoviruses expressing BAP1 and GFP were purchased from SignaGen Laboratories (Ad-BAP1, cat. no. SL175127; Ad-GFP, cat. no. SL100708). Customized adenoviruses
expressing BAP1, BAP1(C91S), BAP1(W) and Ad-Myc-BAP1(L), were produced by SignaGen Laboratories using their Ad.MAX™ System. Expression plasmids for Flag-HA-BAP1, Myc-BAP1, Myc-BAP1(W), Myc-BAP1(L) and Myc-BAP1(C91S) were produced by Blue Heron Biotech. For BAP1(W), BAP1(L) and BAP1(C91S) the following nucleotide sequences were used:
BAP1(W)— ATGAATAAGGGCTGGCTGGAGCTGGAGAGCGACCCAGGCCTCTTCACCCTGCTCG TGGAAGATTTCGGTGTCAAGGGGGTGCAAGTGGAGGAGATCTACGACCTTCAGA GCAAATGTCAGGGCCCTGTATATGGATTTATCTTCCTGTTCAAATGGATCGAAGAG CGCCGGTCCCGGCGAAAGGTCTCTACCTTGGTGGATGATACGTCCGTGATTGATG ATGATATTGTGAATAACATGTTCTTTGCCCACCAGCTGATACCCAACTCTTGTGCA ACTCATGCCTTGCTGAGCGTGCTCCTGAACTGCAGCAGCGTGGACCTGGGACCCA CCCTGAGTCGCATGAAGGACTTCACCAAGGGTTTCAGCCCTGAGAGCAAAGGATA TGCGATTGGCAATGCCCCGGAGTTGGCCAAGGCCCATAATAGCCATGCCAGGGCC CTGGGGGGAGGACGAGGAGTGGACAGACAAGGCCCGGCGGGTCATCATGGAGC GTATCGGCCTCGCCACTGCAGGGGAGCCCTACCACGACATCCGCTTCAACCTGAT GGCAGTGGTGCCCGACCGCAGGATCAAGTATGA BAP1(L)— ATGAATAAGGGCTGGCTGGAGCTGGAGAGCGACCCAGGCCTCTTCACCCTGCTCG TGGAAGATTTCGGTGTCAAGGGGGTGCAAGTGGAGGAGATCTACGACCTTCAGA GCAAATGTCAGGGCCCTGTATATGGATTTATCTTCCTGTTCAAATGGATCGAAGAG CGCCGGTCCCGGCGAAAGGTCTCTACCTTGGTGGATGATACGTCCGTGATTGATG ATGATATTGTGAATAACATGTTCTTTGCCCACCAGCTGATACCCAACTCTTGTGCA ACTCATGCCTTGCTGAGCGTGCTCCTGAACTGCAGCAGCGTGGACCTGGGACCCA CCCTGAGTCGCATGAAGGACTTCACCAAGGGTTTCAGCCCTGAGAGCAAAGGATA TGCGATTGGCAATGCCCCGGAGTTGGCCAAGGCCCATAATAGCCATGCCAGGCCC GAGCCACGCCACCTCCCTGAGAAGCAGAATGGCCTTAGTGCAGTGCGGACCATG GAGGCGTTCCACTTTGTCAGCTATGTGCCTATCACAGGCCGGCTCTTTGAGCTGGA TGGGCTGAAGGTCTACCCCATTGACCATGGGCCCTGGGGGGAGGACGAGGAGTG GACAGACAAGGCCCGGCGGGTCATCATGGAGCGTATCGGCCTCGCCACTGCAGG
A
uthor Man
uscr
ipt
A
uthor Man
uscr
ipt
A
uthor Man
uscr
ipt
A
uthor Man
uscr
ipt
GGAGCCCTACCACGACATCCGCTTCAACCTGATGGCAGTGGTGCCCGACCGCAGG ATCAAGTATGAGGCCAGGCTGCATGTGCTGAAGGTGAACCGTCAGACAGTACTAG AGGCTCTGCAGCAGCTGATAAGAGTAACACAGCCAGAGCTGATTCAGACCCACAA GTCTCAAGAGTCACAGCTGCCTGAGGAGTCCAAGTCAGCCAGCAACAAGTCCCC GCTGGTGCTGGAAGCAAACAGGGCCCCTGCAGCCTCTGAGGGCAACCACACAGA TGGTGCAGAGGAGGCGGCTGGTTCATGCGCACAAGCCCCATCCCACAGCCCTCCC AACAAACCCAAGCTAGTGGTGAAGCCTCCAGGCAGCAGCCTCAATGGGGTTCAC CCCAACCCCACTCCCATTGTCCAGCGGCTGCCGGCCTTTCTAGACAATCACAATTA TGCCAAGTCCCCCATGCAGGAGGAAGAAGACCTGGCGGCAGGTGTGGGCCGCAG CCGAGTTCCAGTCCGCCCACCCCAGCAGTACTCAGATGATGAGGATGACTATGAG GATGACGAGGAGGATGACGTGCAGAACACCAACTCTGCCCTTAGGTATAAGGGGA AGGGAACAGGGAAGCCAGGGGCATTGAGCGGTTCTGCTGATGGGCAACTGTCAG TGCTGCAGCCCAACACCATCAACGTCTTGGCTGAGAAGCTCAAAGAGTCCCAGA AGGACCTCTCAATTCCTCTGTCCATCAAGACTAGCAGCGGGGCTGGGAGTCCGGC TGTGGCAGTGCCCACACACTCGCAGCCCTCACCCACCCCCAGCAATGAGAGTACA GACACGGCCTCTGAGATCGGCAGTGCTTTCAACTCGCCACTGCGCTCGCCTATCC GCTCAGCCAACCCGACGCGGCCCTCCAGCCCTGTCACCTCCCACATCTCCAAGGT GCTTTTTGGAGAGGATGACAGCCTGCTGCGTGTTGACTGCATACGCTACAACCGT GCTGTCCGTGATCTGGGTCCTGTCATCAGCACAGGCCTGCTGCACCTGGCTGAGG ATGGGGTGCTGAGTCCCCTGGCGCTGACAGAGGGTGGGAAGGGTTCCTCGCCCT CCATCAGACCAATCCAAGGCAGCCAGGGGTCCAGCAGCCCAGTGGAGAAGGAGG TCGTGGAAGCCACGGACAGCAGAGAGAAGACGGGGATGGTGAGGCCTGGCGAG CCCTTGAGTGGGGAGAAATACTCACCCAAGGAGCTGCTGGCACTGCTGAAGTGT GTGGAGGCTGAGATTGCAAACTATGAGGCGTGCCTCAAGGAGGAGGTAGAGAAG AGGAAGAAGTTCAAGATTGATGACCAGAGAAGGACCCACAACTACGATGAGTTC ATCTGCACCTTTATCTCCATGCTGGCTTAG BAP1(C91S)— ATGAATAAGGGCTGGCTGGAGCTGGAGAGCGACCCAGGCCTCTTCACCCTGCTCG TGGAAGATTTCGGTGTCAAGGGGGTGCAAGTGGAGGAGATCTACGACCTTCAGA GCAAATGTCAGGGCCCTGTATATGGATTTATCTTCCTGTTCAAATGGATCGAAGAG CGCCGGTCCCGGCGAAAGGTCTCTACCTTGGTGGATGATACGTCCGTGATTGATG ATGATATTGTGAATAACATGTTCTTTGCCCACCAGCTGATACCCAACTCTAGTGCA ACTCATGCCTTGCTGAGCGTGCTCCTGAACTGCAGCAGCGTGGACCTGGGACCCA CCCTGAGTCGCATGAAGGACTTCACCAAGGGTTTCAGCCCTGAGAGCAAAGGATA TGCGATTGGCAATGCCCCGGAGTTGGCCAAGGCCCATAATAGCCATGCCAGGCCC GAGCCACGCCACCTCCCTGAGAAGCAGAATGGCCTTAGTGCAGTGCGGACCATG GAGGCGTTCCACTTTGTCAGCTATGTGCCTATCACAGGCCGGCTCTTTGAGCTGGA TGGGCTGAAGGTCTACCCCATTGACCATGGGCCCTGGGGGGAGGACGAGGAGTG GACAGACAAGGCCCGGCGGGTCATCATGGAGCGTATCGGCCTCGCCACTGCAGG GGAGCCCTACCACGACATCCGCTTCAACCTGATGGCAGTGGTGCCCGACCGCAGG ATCAAGTATGAGGCCAGGCTGCATGTGCTGAAGGTGAACCGTCAGACAGTACTAG AGGCTCTGCAGCAGCTGATAAGAGTAACACAGCCAGAGCTGATTCAGACCCACAA GTCTCAAGAGTCACAGCTGCCTGAGGAGTCCAAGTCAGCCAGCAACAAGTCCCC GCTGGTGCTGGAAGCAAACAGGGCCCCTGCAGCCTCTGAGGGCAACCACACAGA
A
uthor Man
uscr
ipt
A
uthor Man
uscr
ipt
A
uthor Man
uscr
ipt
A
uthor Man
uscr
ipt
TGGTGCAGAGGAGGCGGCTGGTTCATGCGCACAAGCCCCATCCCACAGCCCTCCC AACAAACCCAAGCTAGTGGTGAAGCCTCCAGGCAGCAGCCTCAATGGGGTTCAC CCCAACCCCACTCCCATTGTCCAGCGGCTGCCGGCCTTTCTAGACAATCACAATTA TGCCAAGTCCCCCATGCAGGAGGAAGAAGACCTGGCGGCAGGTGTGGGCCGCAG CCGAGTTCCAGTCCGCCCACCCCAGCAGTACTCAGATGATGAGGATGACTATGAG GATGACGAGGAGGATGACGTGCAGAACACCAACTCTGCCCTTAGGTATAAGGGGA AGGGAACAGGGAAGCCAGGGGCATTGAGCGGTTCTGCTGATGGGCAACTGTCAG TGCTGCAGCCCAACACCATCAACGTCTTGGCTGAGAAGCTCAAAGAGTCCCAGA AGGACCTCTCAATTCCTCTGTCCATCAAGACTAGCAGCGGGGCTGGGAGTCCGGC TGTGGCAGTGCCCACACACTCGCAGCCCTCACCCACCCCCAGCAATGAGAGTACA GACACGGCCTCTGAGATCGGCAGTGCTTTCAACTCGCCACTGCGCTCGCCTATCC GCTCAGCCAACCCGACGCGGCCCTCCAGCCCTGTCACCTCCCACATCTCCAAGGT GCTTTTTGGAGAGGATGACAGCCTGCTGCGTGTTGACTGCATACGCTACAACCGT GCTGTCCGTGATCTGGGTCCTGTCATCAGCACAGGCCTGCTGCACCTGGCTGAGG ATGGGGTGCTGAGTCCCCTGGCGCTGACAGAGGGTGGGAAGGGTTCCTCGCCCT CCATCAGACCAATCCAAGGCAGCCAGGGGTCCAGCAGCCCAGTGGAGAAGGAGG TCGTGGAAGCCACGGACAGCAGAGAGAAGACGGGGATGGTGAGGCCTGGCGAG CCCTTGAGTGGGGAGAAATACTCACCCAAGGAGCTGCTGGCACTGCTGAAGTGT GTGGAGGCTGAGATTGCAAACTATGAGGCGTGCCTCAAGGAGGAGGTAGAGAAG AGGAAGAAGTTCAAGATTGATGACCAGAGAAGGACCCACAACTACGATGAGTTC ATCTGCACCTTTATCTCCATGCTGGCTCAGGAAGGCATGCTGGCCAACCTAGTGGA GCAGAACATCTCCGTGCGGCGGCGCCAAGGGGTCAGCATCGGCCGGCTCCACAA GCAGCGGAAGCCTGACCGGCGGAAACGCTCTCGCCCCTACAAGGCCAAGCGCCA GTGA
Customized adenoviruses expressing Myc-BAP1-ER, and Myc-BAP1-Nu and Ad-Myc-BAP1-Cyt were produced by SignaGen Laboratories. The respective expression plasmids were produced by Blue Heron Biotech; the following nucleotide sequences were used and cloned into the expression vector pCMV6-AN-My (cat. no. PS100012):
BAP1-ER— ATGAATAAGGGCTGGCTGGAGCTGGAGAGCGACCCAGGCCTCTTCACCCTGCTCG TGGAAGATTTCGGTGTCAAGGGGGTGCAAGTGGAGGAGATCTACGACCTTCAGA GCAAATGTCAGGGCCCTGTATATGGATTTATCTTCCTGTTCAAATGGATCGAAGAG CGCCGGTCCCGGCGAAAGGTCTCTACCTTGGTGGATGATACGTCCGTGATTGATG ATGATATTGTGAATAACATGTTCTTTGCCCACCAGCTGATACCCAACTCTTGTGCA ACTCATGCCTTGCTGAGCGTGCTCCTGAACTGCAGCAGCGTGGACCTGGGACCCA CCCTGAGTCGCATGAAGGACTTCACCAAGGGTTTCAGCCCTGAGAGCAAAGGATA TGCGATTGGCAATGCCCCGGAGTTGGCCAAGGCCCATAATAGCCATGCCAGGCCC GAGCCACGCCACCTCCCTGAGAAGCAGAATGGCCTTAGTGCAGTGCGGACCATG GAGGCGTTCCACTTTGTCAGCTATGTGCCTATCACAGGCCGGCTCTTTGAGCTGGA TGGGCTGAAGGTCTACCCCATTGACCATGGGCCCTGGGGGGAGGACGAGGAGTG GACAGACAAGGCCCGGCGGGTCATCATGGAGCGTATCGGCCTCGCCACTGCAGG GGAGCCCTACCACGACATCCGCTTCAACCTGATGGCAGTGGTGCCCGACCGCAGG ATCAAGTATGAGGCCAGGCTGCATGTGCTGAAGGTGAACCGTCAGACAGTACTAG
A
uthor Man
uscr
ipt
A
uthor Man
uscr
ipt
A
uthor Man
uscr
ipt
A
uthor Man
uscr
ipt
AGGCTCTGCAGCAGCTGATAAGAGTAACACAGCCAGAGCTGATTCAGACCCACAA GTCTCAAGAGTCACAGCTGCCTGAGGAGTCCAAGTCAGCCAGCAACAAGTCCCC GCTGGTGCTGGAAGCAAACAGGGCCCCTGCAGCCTCTGAGGGCAACCACACAGA TGGTGCAGAGGAGGCGGCTGGTTCATGCGCACAAGCCCCATCCCACAGCCCTCCC AACAAACCCAAGCTAGTGGTGAAGCCTCCAGGCAGCAGCCTCAATGGGGTTCAC CCCAACCCCACTCCCATTGTCCAGCGGCTGCCGGCCTTTCTAGACAATCACAATTA TGCCAAGTCCCCCATGCAGGAGGAAGAAGACCTGGCGGCAGGTGTGGGCCGCAG CCGAGTTCCAGTCCGCCCACCCCAGCAGTACTCAGATGATGAGGATGACTATGAG GATGACGAGGAGGATGACGTGCAGAACACCAACTCTGCCCTTAGGTATAAGGGGA AGGGAACAGGGAAGCCAGGGGCATTGAGCGGTTCTGCTGATGGGCAACTGTCAG TGCTGCAGCCCAACACCATCAACGTCTTGGCTGAGAAGCTCAAAGAGTCCCAGA AGGACCTCTCAATTCCTCTGTCCATCAAGACTAGCAGCGGGGCTGGGAGTCCGGC TGTGGCAGTGCCCACACACTCGCAGCCCTCACCCACCCCCAGCAATGAGAGTACA GACACGGCCTCTGAGATCGGCAGTGCTTTCAACTCGCCACTGCGCTCGCCTATCC GCTCAGCCAACCCGACGCGGCCCTCCAGCCCTGTCACCTCCCACATCTCCAAGGT GCTTTTTGGAGAGGATGACAGCCTGCTGCGTGTTGACTGCATACGCTACAACCGT GCTGTCCGTGATCTGGGTCCTGTCATCAGCACAGGCCTGCTGCACCTGGCTGAGG ATGGGGTGCTGAGTCCCCTGGCGCTGACAGAGGGTGGGAAGGGTTCCTCGCCCT CCATCAGACCAATCCAAGGCAGCCAGGGGTCCAGCAGCCCAGTGGAGAAGGAGG TCGTGGAAGCCACGGACAGCAGAGAGAAGACGGGGATGGTGAGGCCTGGCGAG CCCTTGAGTGGGGAGAAATACTCACCCAAGGAGCTGCTGGCACTGCTGAAGTGT GTGGAGGCTGAGATTGCAAACTATGAGGCGTGCCTCAAGGAGGAGGTAGAGAAG AGGAAGAAGTTCAAGATTGATGACCAGAGAAGGACCCACAACTACGATGAGTTC ATCTGCACCTTTATCTCCATGCTGGCTCAGGAAGGCATGCTGGCCAACCTAGTGGA GCAGAACATCTCCGTGCGGCGGCGCCAAGGGGTCAGCATCGGCCGGCTCCACAA GCAGCGGAAGCCTGACCGGCGGAAACGCTCTCGCCCCTACAAGGCCAAGCGCCA GATGGTTTATATTGGTATCGCTATTTTTTTGTTTTTGGTTGGCCTTTTTATGAAATGA ER targeting sequence: ATGGTTTATATTGGTATCGCTATTTTTTTGTTTTTGGTTGGCCTTTTTATGAAA BAP1-Nu— ATGAATAAGGGCTGGCTGGAGCTGGAGAGCGACCCAGGCCTCTTCACCCTGCTCG TGGAAGATTTCGGTGTCAAGGGGGTGCAAGTGGAGGAGATCTACGACCTTCAGA GCAAATGTCAGGGCCCTGTATATGGATTTATCTTCCTGTTCAAATGGATCGAAGAG CGCCGGTCCCGGCGAAAGGTCTCTACCTTGGTGGATGATACGTCCGTGATTGATG ATGATATTGTGAATAACATGTTCTTTGCCCACCAGCTGATACCCAACTCTTGTGCA ACTCATGCCTTGCTGAGCGTGCTCCTGAACTGCAGCAGCGTGGACCTGGGACCCA CCCTGAGTCGCATGAAGGACTTCACCAAGGGTTTCAGCCCTGAGAGCAAAGGATA TGCGATTGGCAATGCCCCGGAGTTGGCCAAGGCCCATAATAGCCATGCCAGGCCC GAGCCACGCCACCTCCCTGAGAAGCAGAATGGCCTTAGTGCAGTGCGGACCATG GAGGCGTTCCACTTTGTCAGCTATGTGCCTATCACAGGCCGGCTCTTTGAGCTGGA TGGGCTGAAGGTCTACCCCATTGACCATGGGCCCTGGGGGGAGGACGAGGAGTG GACAGACAAGGCCCGGCGGGTCATCATGGAGCGTATCGGCCTCGCCACTGCAGG GGAGCCCTACCACGACATCCGCTTCAACCTGATGGCAGTGGTGCCCGACCGCAGG
A
uthor Man
uscr
ipt
A
uthor Man
uscr
ipt
A
uthor Man
uscr
ipt
A
uthor Man
uscr
ipt
ATCAAGTATGAGGCCAGGCTGCATGTGCTGAAGGTGAACCGTCAGACAGTACTAG AGGCTCTGCAGCAGCTGATAAGAGTAACACAGCCAGAGCTGATTCAGACCCACAA GTCTCAAGAGTCACAGCTGCCTGAGGAGTCCAAGTCAGCCAGCAACAAGTCCCC GCTGGTGCTGGAAGCAAACAGGGCCCCTGCAGCCTCTGAGGGCAACCACACAGA TGGTGCAGAGGAGGCGGCTGGTTCATGCGCACAAGCCCCATCCCACAGCCCTCCC AACAAACCCAAGCTAGTGGTGAAGCCTCCAGGCAGCAGCCTCAATGGGGTTCAC CCCAACCCCACTCCCATTGTCCAGCGGCTGCCGGCCTTTCTAGACAATCACAATTA TGCCAAGTCCCCCATGCAGGAGGAAGAAGACCTGGCGGCAGGTGTGGGCCGCAG CCGAGTTCCAGTCCGCCCACCCCAGCAGTACTCAGATGATGAGGATGACTATGAG GATGACGAGGAGGATGACGTGCAGAACACCAACTCTGCCCTTAGGTATAAGGGGA AGGGAACAGGGAAGCCAGGGGCATTGAGCGGTTCTGCTGATGGGCAACTGTCAG TGCTGCAGCCCAACACCATCAACGTCTTGGCTGAGAAGCTCAAAGAGTCCCAGA AGGACCTCTCAATTCCTCTGTCCATCAAGACTAGCAGCGGGGCTGGGAGTCCGGC TGTGGCAGTGCCCACACACTCGCAGCCCTCACCCACCCCCAGCAATGAGAGTACA GACACGGCCTCTGAGATCGGCAGTGCTTTCAACTCGCCACTGCGCTCGCCTATCC GCTCAGCCAACCCGACGCGGCCCTCCAGCCCTGTCACCTCCCACATCTCCAAGGT GCTTTTTGGAGAGGATGACAGCCTGCTGCGTGTTGACTGCATACGCTACAACCGT GCTGTCCGTGATCTGGGTCCTGTCATCAGCACAGGCCTGCTGCACCTGGCTGAGG ATGGGGTGCTGAGTCCCCTGGCGCTGACAGAGGGTGGGAAGGGTTCCTCGCCCT CCATCAGACCAATCCAAGGCAGCCAGGGGTCCAGCAGCCCAGTGGAGAAGGAGG TCGTGGAAGCCACGGACAGCAGAGAGAAGACGGGGATGGTGAGGCCTGGCGAG CCCTTGAGTGGGGAGAAATACTCACCCAAGGAGCTGCTGGCACTGCTGAAGTGT GTGGAGGCTGAGATTGCAAACTATGAGGCGTGCCTCAAGGAGGAGGTAGAGAAG AGGAAGAAGTTCAAGATTGATGACCAGAGAAGGACCCACAACTACGATGAGTTC ATCTGCACCTTTATCTCCATGCTGGCTCAGGAAGGCATGCTGGCCAACCTAGTGGA GCAGAACATCTCCGTGCGGCGGCGCCAAGGGGTCAGCATCGGCCGGCTCCACAA GCAGCGGAAGCCTGACCGGCGGAAACGCTCTCGCCCCTACAAGGCCAAGCGCCA GACAGTTTTTTCTAATGGCTATTCAAGCCCCAGCATGAGACCAGATGTAAGCTCTC CTCCATCCAGCTCCTCAACAGCAACAACAGGACCACCTCCCAAACTCTGCCTGGT GTGCTCTGATGAAGCTTCAGGATGTCATTATGGAGTCTTAACTTGTGGAAGCTGTA AAGTTTTCTTCAAAAGAGCAGTGGAAGGACAGCACAATTACCTATGTGCTGGAAG GAATGATTGCATCATCGATAAAATTCGAAGAAAAAACTGCCCAGCATGCCGCTATC GAAAATGTCTTCAGGCTGGAATGAACCTGGAAGCTCGAAAAACAAAGAAAAAA ATAAAAGGAATTCAGCAGGCCACTTGA
Nuclear targeting sequence—
ACAGTTTTTTCTAATGGCTATTCAAGCCCCAGCATGAGACCAGATGTAAGCTCTCC TCCATCCAGCTCCTCAACAGCAACAACAGGACCACCTCCCAAACTCTGCCTGGTG TGCTCTGATGAAGCTTCAGGATGTCATTATGGAGTCTTAACTTGTGGAAGCTGTAA AGTTTTCTTCAAAAGAGCAGTGGAAGGACAGCACAATTACCTATGTGCTGGAAGG AATGATTGCATCATCGATAAAATTCGAAGAAAAAACTGCCCAGCATGCCGCTATCG AAAATGTCTTCAGGCTGGAATGAACCTGGAAGCTCGAAAAACAAAGAAAAAAAT AAAAGGAATTCAGCAGGCCACT
A
uthor Man
uscr
ipt
A
uthor Man
uscr
ipt
A
uthor Man
uscr
ipt
A
uthor Man
uscr
ipt
BAP1-Cyt— ATGAATAAGGGCTGGCTGGAGCTGGAGAGCGACCCAGGCCTCTTCACCCTGCTCG TGGAAGATTTCGGTGTCAAGGGGGTGCAAGTGGAGGAGATCTACGACCTTCAGA GCAAATGTCAGGGCCCTGTATATGGATTTATCTTCCTGTTCAAATGGATCGAAGAG CGCCGGTCCCGGCGAAAGGTCTCTACCTTGGTGGATGATACGTCCGTGATTGATG ATGATATTGTGAATAACATGTTCTTTGCCCACCAGCTGATACCCAACTCTTGTGCA ACTCATGCCTTGCTGAGCGTGCTCCTGAACTGCAGCAGCGTGGACCTGGGACCCA CCCTGAGTCGCATGAAGGACTTCACCAAGGGTTTCAGCCCTGAGAGCAAAGGATA TGCGATTGGCAATGCCCCGGAGTTGGCCAAGGCCCATAATAGCCATGCCAGGCCC GAGCCACGCCACCTCCCTGAGAAGCAGAATGGCCTTAGTGCAGTGCGGACCATG GAGGCGTTCCACTTTGTCAGCTATGTGCCTATCACAGGCCGGCTCTTTGAGCTGGA TGGGCTGAAGGTCTACCCCATTGACCATGGGCCCTGGGGGGAGGACGAGGAGTG GACAGACAAGGCCCGGCGGGTCATCATGGAGCGTATCGGCCTCGCCACTGCAGG GGAGCCCTACCACGACATCCGCTTCAACCTGATGGCAGTGGTGCCCGACCGCAGG ATCAAGTATGAGGCCAGGCTGCATGTGCTGAAGGTGAACCGTCAGACAGTACTAG AGGCTCTGCAGCAGCTGATAAGAGTAACACAGCCAGAGCTGATTCAGACCCACAA GTCTCAAGAGTCACAGCTGCCTGAGGAGTCCAAGTCAGCCAGCAACAAGTCCCC GCTGGTGCTGGAAGCAAACAGGGCCCCTGCAGCCTCTGAGGGCAACCACACAGA TGGTGCAGAGGAGGCGGCTGGTTCATGCGCACAAGCCCCATCCCACAGCCCTCCC AACAAACCCAAGCTAGTGGTGAAGCCTCCAGGCAGCAGCCTCAATGGGGTTCAC CCCAACCCCACTCCCATTGTCCAGCGGCTGCCGGCCTTTCTAGACAATCACAATTA TGCCAAGTCCCCCATGCAGGAGGAAGAAGACCTGGCGGCAGGTGTGGGCCGCAG CCGAGTTCCAGTCCGCCCACCCCAGCAGTACTCAGATGATGAGGATGACTATGAG GATGACGAGGAGGATGACGTGCAGAACACCAACTCTGCCCTTAGGTATAAGGGGA AGGGAACAGGGAAGCCAGGGGCATTGAGCGGTTCTGCTGATGGGCAACTGTCAG TGCTGCAGCCCAACACCATCAACGTCTTGGCTGAGAAGCTCAAAGAGTCCCAGA AGGACCTCTCAATTCCTCTGTCCATCAAGACTAGCAGCGGGGCTGGGAGTCCGGC TGTGGCAGTGCCCACACACTCGCAGCCCTCACCCACCCCCAGCAATGAGAGTACA GACACGGCCTCTGAGATCGGCAGTGCTTTCAACTCGCCACTGCGCTCGCCTATCC GCTCAGCCAACCCGACGCGGCCCTCCAGCCCTGTCACCTCCCACATCTCCAAGGT GCTTTTTGGAGAGGATGACAGCCTGCTGCGTGTTGACTGCATACGCTACAACCGT GCTGTCCGTGATCTGGGTCCTGTCATCAGCACAGGCCTGCTGCACCTGGCTGAGG ATGGGGTGCTGAGTCCCCTGGCGCTGACAGAGGGTGGGAAGGGTTCCTCGCCCT CCATCAGACCAATCCAAGGCAGCCAGGGGTCCAGCAGCCCAGTGGAGAAGGAGG TCGTGGAAGCCACGGACAGCAGAGAGAAGACGGGGATGGTGAGGCCTGGCGAG CCCTTGAGTGGGGAGAAATACTCACCCAAGGAGCTGCTGGCACTGCTGAAGTGT GTGGAGGCTGAGATTGCAAACTATGAGGCGTGCCTCAAGGAGGAGGTAGAGAAG AGGAAGAAGTTCAAGATTGATGACCAGAGAAGGACCCACAACTACGATGAGTTC ATCTGCACCTTTATCTCCATGCTGGCTCAGGAAGGCATGCTGGCCAACCTAGTGGA GCAGAACATCTCCGTGGCGGCGGCGCAAGGGGTCAGCATCGGCGCGCTCCACAA GCAGCGGAAGCCTGACGCGGCGGCGGCGGCGGCGCCCTACAAGGCCAAGCGCC AGTGA
A
uthor Man
uscr
ipt
A
uthor Man
uscr
ipt
A
uthor Man
uscr
ipt
A
uthor Man
uscr
ipt
Point Mutations (in Bold) Introduced in Bap1 NLS Region (accordingly to19)—
GCGGCGGCGCAAGGGGTCAGCATCGGCGCGCTCCACAAGCAGCGGAAGCCTGA
CGCGGCGGCGGCGGCGGCGCCCTAC
The customized adenovirus expressing Ad-IP3R3 was produced by Vector BioLabs, from the expression plasmid: ITPR3 (Myc-DDK-tagged)-Human inositol 1,4,5-trisphosphate receptor, type 3, obtained from Blue Heron Biotech (cat. no. RC222737).
The adenoviruses expressing Ad-cytAEQ, Ad-mtAEQ and Ad-mtAEQmut were obtained from our co-Author, P. Pinton's Lab36.
Plasmid expressing FLAG-IP3R3(NT), IP3R3(NT), IP3R3(MID) and HA-IP3R3(CT) were generated by Shafi Kuchay.
Blue Heron Biotech produced the plasmid DNA vectors expressing the 6 Myc-tagged BAP1 fragments: BAP1(UCH), aa: 1-240; Myc BAP1(NORS), aa: 240-598,
BAP1(CTD-NLS), aa: 598-729; BAP1(UCH-NORS-CTD), aa: 1-699; Myc-BAP1(UCH-NORS), aa: 1-598; Myc-BAP1(NORS-CTD-NLS), aa: 240-729.
Cells (fibroblasts cell cultures, HM, MAF, Phi, HMESO, macrophages, as indicated in the Figures) were seeded and allowed to grow to 50% confluence for 24 hours before
transduction or transfection. Infection with the indicated adenoviruses was performed at a multiplicity of infection of 100 PFU/cell, in 10% FBS. For aequorin measurements, the cells were seeded onto 13 mm glass coverslips. Experiments were performed 36 hours post-transduction. When silencing and transduction occurred together in the same experiment, cells were first transduced for 12 hours and then transfected with Hiperfect for the remaining 24 hours. THP-1 cells were treated with 20 μM TPA for 24 hours to induce monocytes differentiation into macrophages; subsequently cells were transduced with WT
mitochondrial targeted aequorin (Ad-mtAEQ) for 24 hours in presence of TPA, and then transfected with control scrambled siRNA or siRNAs-BAP1 (siBAP1#1 and siBAP1#5), in 1% FBS media, for additional 24 hours prior to Ca2+ measurements. For cell imaging experiments, cells were seeded onto 24 mm glass coverslips and allowed to grow to 50% confluence before transduction or transfection.
Transfection with the ER-targeted, D1ER, and the mitochondrial-targeted, 4mtD3cpv, Ca2+biosensors23,37 was performed using Lipofectamine LTX&PLUS (Life Technologies, 15338-100). HEK-293 cells were cultured for 24 hours, transiently transfected using polyethylenimine (PEI) and used in the experiments 24 hours post-transfection.
HMESO cells stably expressing empty vector, BAP1 or BAP1(C91S), were generated through transient transfection of the respective plasmid DNA vectors using PEI. Cells were selected using 1.5 mg/ml G418 to obtain monoclonal populations. Colonies were then grown in 0.5 mg/ml G418 and tested for BAP1 overexpression via WB.
Western blot (WB)
Total cell (fibroblasts cell cultures, HM, HEK-293, PPM-Mill, Phi, HMESO, Rob, macrophages, as indicated in the Figures) lysates were prepared in M-PER (Thermo
A
uthor Man
uscr
ipt
A
uthor Man
uscr
ipt
A
uthor Man
uscr
ipt
A
uthor Man
uscr
ipt
Scientific, cat. no. 78501) reagent supplemented with proteases and phosphatases inhibitors [2 mM Na3VO4, 2 mM NaF, 50 nM Okadaic Acid (OA), 1 mM PMSF and protease inhibitor cocktail], and 1 mM DTT.
Cleaved caspase-3 levels were analyzed in fibroblasts treated with either vehicle or 100 μM H2O2, 10 μM C2-ceramide (C2-Cer), 10 μM menadione (Men), 10 μM 5-fluorouracile (5-FU), for 6 hours in DMEM supplemented with 0.1% FBS. When indicated, fibroblasts were silenced for 24 hours or transduced with adenoviruses for 36 hours as described above. HM cells were seeded in DMEM supplemented with 20% FBS, followed by transfection with Hiperfect for 24 hours, and then treated with 200 μM H2O2 for 6 hours, or 5 μg/cm2
crocidolite for 24 hours in 0.1% FBS medium. THP-1 cells were treated with 20 μM TPA for 48 hours to induce monocytes differentiation into macrophages; subsequently cells were transfected, in 1% FBS media, with control scrambled siRNA, siBAP1#1 and siBAP1#5 for 24 hours, and then treated with 5 μg/cm2 crocidolite asbestos for additional 24 hours.
Protein extracts were quantified using the Bradford assay (Bio-Rad Laboratories); 7 μg of proteins were loaded and separated on NuPAGE® Novex 4-12% Bis-Tris Gel (Life Technologies), and electron-transferred to PVDF or nitrocellulose membrane according to standard procedures.
Antibodies
Primary antibodies used were: α-Tubulin (4G1) (Santa Cruz Biotechnology, cat. no. sc-58666), BAP1 (C-4) (Santa Cruz Biotechnology, cat. no. sc-28383), BAP1 (D7W7O) (Cell Signaling, cat. no. 13271), BAP1 (H-300) (Santa Cruz Biotechnology, cat. no.
sc-28236), anti-human CD90 (BD Biosciences, cat. no. 561558), Caspase-3 (Cell Signaling, cat. no. 9662), FLAG (Sigma-Aldrich, cat. no. F7425), Histone H2A.X (D17A3) (Cell Signaling, cat. no. 7631), Anti-phospho-Histone H2A.X (Ser139) (EMD Millipore, cat. no. 05-636), H3 (Cell Signaling, cat. no. 4499), IP3R1 (Novus Biologicals, cat. no.
NB120-5908), IP3R3 (BD Biosciences, cat. no. 610312), Anti-Lamin B1 (abcam, cat. no. ab16048), c-myc (Bethyl Laboratories, cat. no A190-105A), Myc-Tag (9B11) (Cell Signaling, cat. no. 2276), PDI (abcam, cat. no. ab31811) Anti-VDAC1 (abcam, cat. no. ab15895). Secondary antibodies used were: Goat anti-Mouse IgG (H+L) Secondary Antibody, HRP (Thermo Scientific, cat. no. 32430); Goat anti-Rabbit IgG (H+L) Secondary Antibody, HRP (Thermo Scientific, cat. no. 32460); Mouse TrueBlot® ULTRA: Anti-Mouse Ig HRP (Rockland, cat. no. 18-8817-31).
Quantitative Real-Time PCR
Total RNA was extracted with TRIzol reagent (Invitrogen, cat no. 15596-018), followed by phenol/chloroform extractions and ethanol precipitations. The RNA was treated with DNase (Promega) and its integrity and concentration was assessed using the Agilent 2100
BioAnalyzer. cDNA was synthesized using the High-Capacity cDNA Reverse Transcription Kit (Invitrogen, cat no. 4368814) following the manufacturer's instructions. Quantitative real-time PCR was performed in triplicate using TaqMan® Universal Master Mix II (Invitrogen, cat no. 4440040) and commercially available TaqMan Probes (Invitrogen) on a
A
uthor Man
uscr
ipt
A
uthor Man
uscr
ipt
A
uthor Man
uscr
ipt
A
uthor Man
uscr
ipt
StepOnePlus system (Applied Biosystem). The mRNA levels were normalized using the geometric mean of three reference genes (B2M, 18S and β-actin).
Flow cytometry
For cell cycle analyses, fibroblasts cell cultures were incubated with 10 μM
bromodeoxyuridine (BrdU) for 3.5 hours at 37 °C. Cells were collected by trypsinization, fixed, and permeabilized. Cell cycle positions were determined after staining BrdU with FITC-labeled anti-BrdU antibody and DNA with 7-ADD using the FITC BrdU Flow Kit (BD Biosciences, cat. no. 559619) according to the manufacturer's instructions. Cells not treated with BrdU, but incubated with FITC anti-BrdU antibody, were used to assess nonspecific binding of the anti-BrdU antibody and to set the S-phase gate appropriately.
Cell death was measured in fibroblasts cell cultures treated with vehicle or 100 μM H2O2 for 6 hours, in DMEM supplemented with 0.1% FBS media. Cells were collected and stained with FITC-labeled anti-Annexin V and Propidium Iodide (PI) using the FITC Annexin V Apoptosis Detection Kit I (BD Biosciences, cat. no. 556547) according to the manufacturer's instructions. The percentage of late apoptotic cells was determined based on the percentage of cells that were double positive for both Annexin V and PI (Annexin V+/PI+).
Primary HM treated with glass or crocidolite asbestos were collected and incubated (blocked) for 20 minutes with 1% BSA/PBS at 4°C. Cells were stained with anti-human CD90 PE-Cy7 (BD Biosciences, cat. no. 561558) for 30 minutes at 4 °C. Cells were washed once with Binding Buffer and then stained with FITC Annexin V and PI using the FITC Annexin V Apoptosis Detection Kit I (BD Biosciences, cat. no. 556547). After gating on CD90+ cells, the percentage of live cells (Annexin V-/PI-), percentage of early apoptotic cells (Annexin V+/PI-), and the percentage of late apoptotic cells (Annexin V+/PI+) were determined.
For Annexin V/PI experiments, compensation was performed using unstained and single-stained cells and positivity gates were established using the fluorescence minus one (FMO) technique.
For all flow cytometry experiments, fluorescence was detected using a BD LSRFortessa flow cytometer (BD Biosciences) and data were analyzed using FACSDiva software version 6.2 (BD Biosciences). The investigator was blinded to the genotype and experimental conditions of the samples while conducting the experiments and assessing the outcome.
Immunofluorescence
Cells (fibroblasts cell cultures or HM, as indicated in the Figures) grown on 24-mm glass coverslips were fixed in 4% paraformaldehyde in PBS for 10 min and washed three times with PBS. Then, cells were permeabilized for 10 min with 0.1% Triton X-100 in PBS and blocked in PBS containing 2% BSA and 0.05% Triton X-100 for 1 h. Cells were incubated overnight at 4 °C with the indicated antibodies: BAP1 (C-4) (1:50), BAP1 (D7W7O) (1:50), BAP1 (H-300) (1:50), PDI (1:50), IP3R3 (1:50), Myc-Tag (1:75) or H3 (1:75). The
appropriate isotype-matched, AlexaFluor-conjugated secondary antibodies [Life
Technologies, A11008 (633 goat anti-rabbit, 1:1000) A-11010 (546 goat anti-rabbit, 1:1000)
A
uthor Man
uscr
ipt
A
uthor Man
uscr
ipt
A
uthor Man
uscr
ipt
A
uthor Man
uscr
ipt
and A11001 (488 goat anti-mouse, 1:1000)] were used. Where indicated, cells were also loaded with 300 μM DAPI (Life Technologies) for 10 min. The coverslips were mounted with ProLong Gold Antifade reagent (Life Technologies), and the analysis of
immunofluorescence was performed with a confocal laser scanner microscopy Zeiss LSM 510 (Carl Zeiss, Gottingen, Germany) equipped with a 60x oil objective (n.a.1.42) and a Zen lite 2.0 software, or with a Nikon SweptField confocal equipped with a CFI Plan Apo VC60XH objective (n.a. 1.4) (Nikon Instruments, Melville NY) and an Andor DU885 EM-CCD camera (Andor Technology LTD, Nelfast, Norther Ireland), or with an Olympus Xcellence multiple wavelength high-resolution fluorescence microscopy system equipped with a 60X UPLSAPO objective, numerical aperture 1.35 (Olympus).
Subcellular fractionation
Cell fractionation was performed as previously described38. Briefly, 109 cells (fibroblasts cell cultures, HM, PPM-Mill, HEK-293, as indicated in the Figure panels) were harvested in PBS and washed by centrifugation at 500 × g for 5 min with PBS. The cell pellet was suspended in homogenization buffer (225 mM mannitol, 75 mM sucrose, 30 mM Tris-HCl pH 7.4, 0.1 mM EGTA and PMSF) and gently disrupted by Dounce homogenization. The homogenate was centrifuged twice at 600 × g for 5 min to remove nuclei and unbroken cells, and the resultant supernatant was centrifuged at 10,300 × g for 10 min to pellet crude mitochondria. The supernatant was again centrifuged at 20,000 × g for 30 min. Further centrifugation of the supernatant at 100,000 × g for 90 min (70-Ti rotor; Beckman) results in the isolation of ER (pellet) and cytosolic fraction (supernatant).
To purify mitochondria, the crude mitochondrial fraction was suspended in isolation buffer (250 mM mannitol, 5 mM HEPES pH 7.4 and 0.5 mM EGTA) and subjected to Percoll gradient centrifugation (Percoll medium: 225 mM mannitol, 25 mM HEPES pH 7.4, 1 mM EGTA and 30% vol/vol Percoll) in a 10 ml polycarbonate ultracentrifuge tube, at 95,000 × g for 30 min (SW40 rotor; Beckman). Purified mitochondria were then washed by
centrifugation at 6,300 × g for 10 min to remove the Percoll and finally suspended in isolation medium. All centrifugation steps were performed at 4 °C.
To isolate nuclei, cells were collected by centrifugation at 200 × g for 5 min, washed once with ice-cold PBS, suspended in hypotonic buffer (10 mM HEPES pH 7.4, 10 mM KCl, 0.1 mM EDTA, 0.1 mM EGTA, 1 mM DTT, 0.5 mM PMSF), and incubated 15 min on ice. NP40 (Fluka) was added to a final concentration of 0.5% and the mixture was homogenized with a pestle grinder using 30 strokes. The efficiency of shearing the cytoplasm from the nuclei was monitored under a light microscopy by staining with Trypan blue. Homogenates were centrifuged at 14,000 × g for 30 sec to sediment the nuclei. Nuclei were washed once in PBS and further centrifuged at 14,000 × g for 1 min. Nuclei were finally suspended in hypotonic buffer (20 mM HEPES pH 7.4, 400 mM NaCl, 1 mM EDTA, 1 mM EGTA, 1 mM DTT, 1 mM PMSF), incubated on ice for 30 min, vortexed every 5 min, and centrifuged at 16,000 × g for 10 min; the supernatant was collected as nuclear homogenate.
A
uthor Man
uscr
ipt
A
uthor Man
uscr
ipt
A
uthor Man
uscr
ipt
A
uthor Man
uscr
ipt
Immunoelectron microscopy
Fibroblasts cell cultures were fixed with 2% paraformaldehyde 0.2% glutaraldehyde in 0.1M Phosphate buffer pH 7.4 for 1 hour at room temperature. Samples were washed in PBS, embedded in 12% gelatin, infiltrated in 2.3 M sucrose and frozen in liquid nitrogen. Ultrathin cryo-sections were obtained using a Leica EM FC7 cryo-ultramicrotome and collected on copper-formvar-carbon-coated grids. BAP1 localization was revealed using BAP1 (D7W7O) rabbit monoclonal anti-BAP1 antibody (Cell Signaling, cat. no. 13271) and conjugated 10nm protein A-gold according to published protocols39. Sections were imaged with a Zeiss LEO 512 electron microscope and images were acquired by a 2k × 2k bottom-mounted slow-scan Proscan camera controlled by the EsivisionPro 3.2 software.
Intracellular Ca2+ concentration measurements
Cytosolic and mitochondrial Ca2+ concentration measurements with aequorins—Cells (fibroblasts cell cultures, HM, MAF, Phi, HMESO, macrophages, as indicated in the Figures) grown on 13-mm round glass coverslips were transduced (or co-transduced in BAP1 gene expression experiments) with aequorin encoded by an adenoviral construct (cytosolic aequorin, cytAEQ; mitochondria-targeted aequorin, mtAEQ; or the low-affinity mitochondrial aequorin, mtAEQmut). The coverslip with the cells was incubated with 5 μM coelenterazine for 2-3 h in 0.1% FBS medium, and then transferred to the perfusion chamber. All aequorin measurements were carried out in Krebs-Ringer buffer (KRB: 135 mM NaCl, 5 mM KCl, 1 mM MgSO4, 0.4 mM KH2PO4, 5.5 mM glucose, 20 mM HEPES, pH 7.4) supplemented with 1 mM CaCl2. Agonists and other drugs were added to the same medium, as specified in the text. The experiments were terminated by lysing the cells with 100 μM digitonin in a hypotonic Ca2+-rich solution (10 mM CaCl2 in H2O), thus discharging the remaining aequorin pool. The light signal was collected and calibrated into [Ca2+] values by an algorithm based on the Ca2+ response curve of aequorin at physiological conditions of pH, [Mg2+] and ionic strength, as previously described in36. Ca2+
measurements were conducted using a luminometer in cells transduced aequorin, which is a bio-luminescent Ca2+ probe. Note that [Ca2+] is measured only in cells containing aequorin, specifically providing the results only of the transduced cells, and therefore, are not
influenced by the background not-transduced cells. To ensure that cells transduced with aequorin also contain BAP1, BAP1(C91S) or BAP1-targeted chimeras, we use a transduction ratio of 1 (aequorin): 3 (BAP1).
ER Ca2+ concentration measurements with D1ER—Luminal Ca2+ dynamics were measured using single-cell Ca2+ imaging and the Ca2+-sensitive FRET (fluorescence resonance energy transfer)-based cameleon protein D1ER23,37. Fibroblasts were cultured on 24-mm coverslips. When the cells reached 60 % confluence, they were transfected with D1ER. After 36 h, cells were imaged on a Zeiss Axiovert 200M microscope with a cooled CCD camera (Photometrics), equipped with a C-apochromat 40× oil objective (n.a.,1.2) and controlled by METAFLUOR 7.0 Software (Universal Imaging). Emission ratio imaging of the cameleon was accomplished by using a 436DF20 excitation filter, a 450 nm dichroic mirror, and two emission filters (475/40 for ECFP and 535/25 for citrine) controlled by a Lambda 10-2 filter changer (Sutter Instruments). Fluorescence images were background corrected. Exposure times were typically 100 to 200 ms, and images were collected every 5
A
uthor Man
uscr
ipt
A
uthor Man
uscr
ipt
A
uthor Man
uscr
ipt
A
uthor Man
uscr
ipt
to 15 sec. The FRET signal (YFP/CFP) was normalized to the CFP emission intensity, and changes in ER Ca2+ were expressed as the ratio of the emissions at 535 and 470 nm. Cells were treated with 1 μM bradykinin (BK) or 500 μM H2O2 as indicated in the figures, where representative changes in ER [Ca2+] in BAP1WT and BAP1+/- fibroblasts are expressed as D1ER ratios (YFP/CFP) normalized to initial values.
Cytosolic Ca2+ concentration measurements with Fura-2/AM—Dynamic measurements of cytosolic Ca2+ response were performed using the fluorescent Ca2+ indicator Fura-2/AM (Life Technologies). Fibroblasts were grown on 24-mm coverslips and incubated at 37 °C for 30 min in 1 mM Ca2+/KRB supplemented with 2.5 mM Fura-2/AM, 0.02% Pluronic F-68 (Sigma), 0.1 mM Sulfinpyrazone (Sigma). Cells were then washed and supplied with 1 mM Ca2+/KRB. To determine cytosolic Ca2+ response, the cells were placed in an open Leyden chamber on a 37 °C thermostated stage and exposed to 340/380 nm wavelength light using the Olympus xcellence multiple wavelength high-resolution fluorescence microscopy system. H2O2 was added to the 1 mM Ca2+/KRB buffer, and crocidolite asbestos, or glass, added at concentrations of 5μg/cm2. Ca2+ release was recorded upon stimulation as indicated in the figures. To determine whether the Ca2+ release occurred via the ER or if it was secondary to the plasma membrane influx, fibroblasts were loaded with fluorescent Ca2+ indicator Fura-2/AM for 30 min in Ca2+-free KRB buffer
supplemented with 0.1 mM ethylene glycol-bis(β-aminoethylether)-N,N,N′,N′-tetraacetic acid (EGTA). Cells were placed in an open Leyden chamber on a 37 °C thermostated stage and exposed to 340/380 wavelength light, as described above. BK was added to the KRB buffer, and Ca2+ release was recorded upon stimulation as indicated in the figures. The fluorescence data collected were expressed as emission ratios at 340/380 nm. In the figures, the kinetic of the cytosolic Ca2+ responses after H2O2 or BK stimulation is presented as the ratio of fluorescence at 340/380 nm in cells loaded with Fura-2/AM.
Dynamic measurements of cytosolic Ca2+ response after irradiation with UVA (irradiated for 5 minutes with the Olympus xcellence Hg lamp, model: MT-ARC-Hg, 150 W, light was filtered with a 340 filter) or UVB (irradiated at 312 nm for 20 minutes, at a 2 cm fixed distance, with a SPECTROLINE model ENB-280C/F - 220 VOLT - 50 HZ - 0.17 AMPS), were performed using the fluorescent Ca2+ indicator Fura-RED (Life Technologies). Fibroblasts grown on 24-mm coverslips were incubated at 37 °C for 60 min in 1 mM Ca2+/KRB supplemented with 2.5 mM Fura-RED, 0.02% Pluronic F-68 (Sigma), 0.1 mM Sulfinpyrazone (Sigma). Cells were then washed and supplied with 1 mM Ca2+/KRB. To determine the cytosolic Ca2+ response, the cells were placed in an open Leyden chamber on a 37 °C thermostated stage and exposed to 406/494 nm wavelength light using the Olympus xcellence multiple wavelength high-resolution fluorescence microscopy system. The fluorescence data collected were expressed as emission ratios at 406/494 nm. In the figures, the kinetic of the cytosolic Ca2+ responses after UV irradiation is presented as the ratio of fluorescence at 406/494 nm in cells loaded with Fura-RED. Statistical analyses refer to normalized FRET fluorescence ratio over time after irradiaton [Σ(F406/F494)].
Single cells mitochondria Ca2+ measurements with 4mtD3cpv—BAP1WT and BAP1+/- fibroblasts were transfected with the 4mtD3cpv23,37 plasmid, as described above.
A
uthor Man
uscr
ipt
A
uthor Man
uscr
ipt
A
uthor Man
uscr
ipt
A
uthor Man
uscr
ipt
When indicated, co-transfection or silencing were also performed, as described above. After 24 hours, cells were imaged on a Zeiss Axiovert 100TV microscope with a cooled CCD camera R3 Retiga (Q-Imaging), equipped of a FLUAR 40×/1.3 oil objective and controlled by METAFLUOR 7.7.2.0 Software (Molecular Device). Emission ratio imaging of the cameleon was accomplished with a 436DF20 excitation filter, a 450 nm dichroic mirror, and two emission filters (475/40 for ECFP and 535/25 for citrine), controlled by a Lambda 10-2 filter changer (Sutter Instruments). Fluorescence images were background corrected. Exposure times were typically 50 to 100 ms, and images were collected every 1 to 2 s. Mitochondrial Ca2+ uptake was followed over time after stimulation with 1 μM BK or 100 μM H2O2, as indicated in the figures. In the figures, representative traces from single experiments are presented as normalized FRET fluorescence ratio intensity. Statistical analyses refer to normalized FRET fluorescence ratio peak intensity after BK stimulation, or Σ(FRET fluorescence ratio) over time after H2O2 stimulation.
Co-immunoprecipitation
Cells (fibroblasts cell cultures or HEK-293, as indicated in the Figures) were collected and lysed in buffer containing 30 mM Tris-HCl, at pH 7.5, 50 mM NaCl, 1% NP-40. To map the BAP1 and IP3R3 binding region, HEK-293 cells were transiently transfected using
polyethylenimine, collected 24 hours later, and lysed in 50 mM Tris, at pH 7.5, 150 mM NaCl, glycerol 10%, 1 mM EDTA, 50 mM NaF and NP-40 0.1%. All the buffers were supplemented with proteases and phosphatases inhibitors. Extracted proteins were pre-cleared by incubating lysates with G-coated sepharose beads (GE Healthcare) for 1 hour at 4 °C, then the supernatant (700 μg, referred as “Input”) was incubated overnight with IP3R3 antibody at 4 °C; precipitation of the immune complexes was performed with G-coated sepharose beads for 4 hours at 4 °C, according to manufacturer's instructions. Alternatively, the supernatant was incubated for 3 hours at 4 °C with FLAG® M2 resin (Sigma, cat. no A2220) or HA resin (Roche, cat. no. 11815016001). After immunoprecipitation, the beads were washed three times with lysis buffer, at 4 °C, and suspended in 40 μl of 2X Laemmli buffer. 10-20 μl (depending on experiment) were loaded on the gel and the samples were processed by SDS-PAGE and analyzed by WB.
Duolink Proximity Ligation In Situ Assay
BAP1WT and BAP1+/- fibroblasts were fixed in 4% paraformaldehyde for 10 min at 37 °C, and then washed in PBS. Cells were permeabilized with 0.05% Triton X-100 (v:v in PBS) for 10 min at 37 °C. Unspecific binding sites were blocked by incubating cells in 2% BSA (w:v in PBS-0.05% Triton) for 1 hour at 37 °C. Cells were then incubated overnight at 4°C with PLA oligonucleotide probes conjugated to primary antibodies specific for IP3R3 (BD Biosciences, cat. no. 610312) and BAP1 (Santa Cruz Biotechnology, cat. no. sc-28236), in diluent buffer according to the Duolink In Situ – Probes Maker protocol (Sigma-Aldrich, cat. no. DUO92101). Detection was performed according to the manufacturer's protocol. Briefly, a ligation-ligase solution was added to each sample for 30 minutes at 37 °C, and then washed twice for 2 minutes with 1x Duolink In Situ Wash Buffer A. An Amplification-Polymerase solution was added for 100 min at 37 °C, and then washed twice for 10 minutes with 1x Duolink In Situ Wash Buffer B. The slides were mounted using Duolink In Situ
A
uthor Man
uscr
ipt
A
uthor Man
uscr
ipt
A
uthor Man
uscr
ipt
A
uthor Man
uscr
ipt
Mounting Medium with DAPI. Protein-protein interactions appear as red dots. Images were processed and red dots counted using the Analyze Particles ImageJ software plugin.
In vitro ubiquitylation and de-ubiquitylation assays
In vitro ubiquitylation assays were performed as previously described40. Briefly, FLAG-tagged IP3R3(NT) was co-transfected with either empty vector, Myc-FLAG-tagged BAP1 or the catalytic dead mutant BAP1(C91S) into HEK-293 cells. 24 hours after transfection, FLAG-IP3R3(NT) was immunoprecipitated with anti-FLAG M2 agarose beads. The beads were washed three times in lysis buffer and once in PBS. In vitro ubiquitylation assays were performed on immunoprecipitated beads in a volume of 50 μl, containing 50 mM Tris-HCl, at pH 7.5, 5 mM MgCl2, 1 μM OA, 2 mM ATP, and 0.5 mM DTT, 0.1 μM E1 (Boston Biochem), 0.25 μM Ubch3 (Boston Biochem), 0.25 μM Ubch5c (Boston Biochem), and 2.5 μg μl−1 human ubiquitin (Boston Biochem). Samples were incubated for 1 hour at 33 °C, washed twice with PBS at 4 °C, suspended in 2X Laemmli buffer, and analyzed by SDS-PAGE and WB.
For in vitro de-ubiquitylation assays, HEK-293 cells were transfected with
FLAG-IP3R3(NT), Myc-BAP1 or Myc-BAP1(C91S). FLAG-IP3R3(NT) was immunopurified and in vitro ubiquitylation was performed. Then, beads were washed twice with PBS at 4 °C, and suspended in de-ubiquitylation reaction buffer containing 50 mM Tris-HCl, at pH 7.5, 5 mM MgCl2, 1 μM OA, 2 mM ATP, and 0.5 mM DTT. Myc-BAP1 and Myc-BAP1(C91S) were purified with c-Myc tagged Protein MILD PURIFICATION KIT Ver.2 (MBL International, cat. no. 3305), eluted with c-Myc tag peptide accordingly to the
manufacturer's instructions and added to the de-ubiquitylation reaction buffer. Samples were incubated at 33 °C for the indicated times, then beads were washed twice with PBS at 4 °C, and suspended in 2X Laemmli buffer. Samples were processed by SDS-PAGE and analyzed by WB.
Neutral comet assay
BAP1WT and BAP1+/- fibroblasts were plated at 8 × 10⁵/T25 flasks and incubated overnight, then the medium was replaced with cold PBS and cells were irradiated, on ice, with 6 Gy IR dose using a cabinet X-Ray system (Faxitron). Following IR, cells were collected
immediately (detached using trypsin, harvested and frozen in 90% FBS/10% DMSO) or incubated in complete growth medium for the indicated time before being collected. Neutral comet assay and data analysis were performed by Trevigen Inc (https://www.trevigen.co). Samples were tested using Trevigen's CometAssay Electrophoresis System. Images were captured and analyzed using Loats Associates, Inc Comet Analysis System (LOATS). At least 200 cells were scored per sample. Trevigen Neutral Controls Cells were used as electrophoresis controls. Data from triplicate wells for each sample were pooled to calculate the median and mean, and expressed as Tail Moment. Experiments were conducted and analyzed by investigators blinded to the genotype and experimental conditions of the samples.
A
uthor Man
uscr
ipt
A
uthor Man
uscr
ipt
A
uthor Man
uscr
ipt
A
uthor Man
uscr
ipt
Kinetics of H2A.X phosphorylation
BAP1WT and BAP1+/- fibroblasts were plated and treated with 6 Gy IR, as described for neutral comet assay. In UV radiation experiments, fibroblasts were plated at 3.5 × 10⁵/60 mm dish and incubated overnight, then the medium was replaced with PBS and cells were irradiated with 50 mJ/cm2 of either UVA (340 nm, using a UVA-340 sunlamp, Atlas Material Testing Technology), or UVB (290-315 nm, using a Philips UVB Broadband TL 40W/12 RS SLV/25). For UVA and UVB, spectral output was quantified with a General UV-513/AB Digital UV AB Light Meter.
Following radiation, cells were collected immediately or incubated in complete growth medium for the indicated time before being collected. Dry cell pellets were immediately store at -80 °C. Total cell lysates were prepared by sonication in 200 μl of buffer containing 25 mM Tris-HCl pH 7.5 and 1% SDS. Samples were immediately boiled at 95 °C for 10 min. Following centrifugation, the supernatant was collected and the protein concentration determined using the Pierce BCA Protein Assay Kit (Life Technologies, cat. no. 23225). SDS-PAGE and WB were conducted according to standard procedure (see above).
Clonogenic survival assay after exposure to IR or UV
In ionizing radiation experiments, BAP1WT and BAP1+/- fibroblasts were plated and treated with the indicated Gy IR, as described for neutral comet assay. In UV radiation experiments, fibroblasts were plated at 3.5 × 10⁵/60 mm dish and incubated overnight, then the medium was replaced with PBS and the cells were irradiated with 25 mJ/cm2 as described for Kinetics of H2A.X phosphorylation.
After irradiation, fibroblasts were trypsinized, harvested, counted and plated on 6-well plates. Cells were incubated at 37 °C for 14 days (the tissue culture medium was changed twice a week) to allow colony formation. The surviving colonies were washed with PBS and fixed and stained with 0.5% crystal violet in 50/50 methanol/water for 10 min, followed by three washes with PBS. Colonies were counted and the plating efficiencies (PE) were calculated for untreated cells as the ratio of the number of colonies to the number of cells seeded. The surviving fractions, expressed in terms of PE, were calculated as the ratio between the number of colonies that arise after treatment and the number of cells seeded × PE.
In vitro cell transformation assay
HM transformation assay was accordingly to an established protocol28,41. HM cells were cultured and seeded in six-well plates at a density of 3 × 10⁵ cells per well in 20% FBS growth medium. After 24 hours, the medium was switched to 0.1% FBS, and transfection performed with HiPerfect as described above. When indicated, transduction of cells was performed 6 hours after Hiperfect transfection. 24 hours later, HM were pretreated with 10 ng/ml Recombinant Human Tumor Necrosis Factor-alpha (TNF-α; PromoKine, cat. no. C-63720), or 0.1% BSA (vehicle), and incubated for additional 24 hours. At this time point, HM were exposed to 5 μg/cm2 crocidolite asbestos fibers or PBS (control) for 48 hours. HM were then maintained in 10% FBS supplemented with 10 ng/ml TNF-α. Transfection/ transduction were repeated every 96 hours in fresh 10% FBS supplemented with 10 ng/ml
A
uthor Man
uscr
ipt
A
uthor Man
uscr
ipt
A
uthor Man
uscr
ipt
A
uthor Man
uscr
ipt
TNF-α. Media was completely replaced 24 hours after transfection/transduction, then cells were incubated at 37 °C for the remaining 72 hours. After 2 to 3 weeks, three-dimensional foci were identified and counted under a light microscope. Experiments were performed three times.
Statistics and Reproducibility
Statistical analyses were performed using Student's two-tailed unpaired t-tests, unless otherwise specified. P-values < 0.05 were considered statistically significant and marked with asterisks (*P < 0.05; **P < 0.01; ***P < 0.001), as indicated in the Figure legends. All data collected met the normal distributions assumption of the test. Data are represented as mean ± s.e.m., unless otherwise specified. The exact sample size (n) for experimental groups/conditions and whether samples represent technical or cell culture replicates are indicated in the Figure legends and Supplementary Tables. The exact sample size of Ca2+ experiments are reported in Supplementary Tables 1 and 2. For all other experiments, unless otherwise specified, the results shown are representative of experiments independently conducted three times that produced similar results.