HAL Id: hal-02384566
https://hal.archives-ouvertes.fr/hal-02384566
Submitted on 28 Nov 2019
HAL is a multi-disciplinary open access
archive for the deposit and dissemination of
sci-entific research documents, whether they are
pub-lished or not. The documents may come from
teaching and research institutions in France or
abroad, or from public or private research centers.
L’archive ouverte pluridisciplinaire HAL, est
destinée au dépôt et à la diffusion de documents
scientifiques de niveau recherche, publiés ou non,
émanant des établissements d’enseignement et de
recherche français ou étrangers, des laboratoires
publics ou privés.
Full-field characterization of breather dynamics over the
whole length of an optical fiber
Corentin Naveau, Pascal Szriftgiser, Alexandre Kudlinski, Matteo Conforti,
Stefano Trillo, Arnaud Mussot
To cite this version:
Corentin Naveau, Pascal Szriftgiser, Alexandre Kudlinski, Matteo Conforti, Stefano Trillo, et al..
Full-field characterization of breather dynamics over the whole length of an optical fiber. Optics
Letters, Optical Society of America - OSA Publishing, 2019, 44 (4), pp.763. �10.1364/OL.44.000763�.
�hal-02384566�
Full-field characterization of breather dynamics over
the whole length of an optical fiber
C
ORENTIN NAVEAU
,
1,*P
ASCAL
S
ZRIFTGISER
,
1A
LEXANDRE
K
UDLINSKI
,
1M
ATTEO
C
ONFORTI
,
1S
TEFANO
T
RILLO
,
2AND
A
RNAUD
M
USSOT
11
University of Lille, CNRS, UMR 8523 – PhLAM – Physique des Lasers Atomes et Molécules, Lille, France
2Department of Engineering, University of Ferrara, Ferrara, Italy
*Corresponding author: [email protected]
Received XX Month XXXX; revised XX Month, XXXX; accepted XX Month XXXX; posted XX Month XXXX (Doc. ID XXXXX); published XX Month XXXX
Full-field longitudinal characterization of picosecond pulse train formation in optical fibers is reported. The spatio-temporal evolution is obtained via fast and non-invasive distributed measurements in phase and intensity of the main spectral components of the pulses. To illustrate the performance of the setup, we report the first time-domain experimental observation of the symmetry breaking of Fermi-Pasta-Ulam recurrences. Experimental results are in good agreement with numerical simulations.
OCIS codes: (060.4370) Nonlinear optics, fibers; (060.5530) Pulse
propagation and temporal solitons.
A full experimental characterization in phase and intensity of short optical signals in optical fibers is of high interest to get a deeper understanding of a large number of complex nonlinear phenomena such as supercontinuum or rogue wave generation
[1-3].However, direct photo-detection is currently limited to intensity measurements with a resolution of tens of picoseconds. Alternative techniques for full-field characterization based on time lens and/or dispersive Fourier transform have recently attracted a great interest [4-6]. Single-shot measurements of phase and intensity of femtosecond pulses have been independently reported in [5-6]. Compared to more conventional methods such as frequency-resolved optical gating [7] and spectral phase interferometry for direct electric-field reconstruction [8] (see Ref. [9] for a complete review), the temporal resolution is not as good, but shot to shot recordings are allowed, which is crucial for dynamical studies. Nevertheless, all these previous techniques [4-9] are limited to a localized characterization of the pulse and do not allow to study the evolution of a single pulse in the system. Here, we present a novel experimental method which allows to perform a fast and non-invasive characterization of the full-field evolution of short optical pulses along the whole length of an optical fiber. Although the method is suitable for general
phenomena featuring discrete line spectra (i.e. time periodic signals), we illustrate its performance with reference to the nonlinear stage of modulation instability (MI) [10,11]. Modulation instability [12] consists in the exponential growth of an initial weak modulation at the expense of a strong pump wave. Its nonlinear stage is characterized by the amplification of multiple harmonics of the modulation sidebands due to four-wave-mixing, leading to a triangular shape spectrum [13]. By propagating further, the process reverses and the system goes back to its initial state. This is referred to as Fermi-Pasta-Ulam (FPU) recurrence [14]. This phenomenon has been investigated and observed in different settings such as in nonlinear fiber optics [15-18] and spatial nonlinear optics [19]
but also in a large range of other physical frameworks where the dynamics can be described by the nonlinear Schrödinger equation, among which is hydrodynamics [20-21]. However it is characterized by a very rich and complex spatio-temporal dynamics which full experimental observation is still pending. Its symmetry breaking nature have been recently reported experimentally in optical fibers via the study of phase-plane structures experienced by the signal wave [22]. Here, our technique enables to report the first direct observation of this symmetry breaking in the time domain.
Our experimental setup improves the one described in [22] which consists in a vector heterodyne optical time domain reflectometer (HOTDR). The backscattered light is analyzed by means of beating with a local oscillator. It enables the measurement of the longitudinal evolution of the intensity of three waves (pump, signal and idler) and their relative phase (compared to the one of the local oscillator) in a 7.7 km standard SMF-28 fiber. We upgraded the setup in [22] (see Fig. 1. for a simplified sketch) in order to be able to record the evolution of an extra pair of sidebands (harmonics of the signal and idler waves). To this end, a triangular comb of five waves is launched into the fiber (Fig. 2(a)), composed of a strong pump of 460 mW, a first set of symmetrical sidebands (10 dB lower than the pump) detuned by 35 GHz from the pump, and the
second set of sidebands (20 dB lower than the pump) detuned by 70 GHz. In order to be close to the case of pure amplitude modulation described in [22], all the initial relative phases are set to zero. Initial addition of the harmonic components is crucial to run this experiment. Indeed, to overcome the limitations induced by the fact that we analyze backscattered waves, a weak pulse followed the strong pulse (which experiences nonlinear effects) launched into the fiber to serve as a reference in the HOTDR detection system.
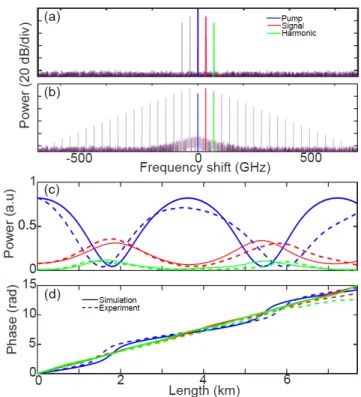
Significant modifications have been introduced on the detection scheme to detect this additional set of sidebands. More specifically, we increased the sensitivity of the system by adding a low noise optical amplifier to boost backscattered waves before the mixing with local oscillator. This allows to get a 5 dB signal to noise ratio for weakest back-reflected waves. Moreover, a programmable filter allows for rapid switching between the frequency components to be isolated for further analysis. Following the procedure described in [22], we are then able to record the evolution of the intensity and of the relative phase of the five main spectral components of the frequency comb propagating inside the fiber with a longitudinal resolution of about 20 m in less than two minutes. Here, we assume that the behavior of sidebands symmetric to the pump is similar. In fact, odd order dispersion terms and Raman effect can be considered as negligible. Thus, we only record the evolution of the pump wave and the two high frequency bands (the signal and its harmonic) as highlighted in Fig. 2(a) and (b). Their intensity evolution is shown in Fig. 2(c) (dashed lines). They exhibit more than two recurrences with growth and return cycles of the pump and sidebands, characteristic of the FPU process. Their corresponding relative phase evolution are displayed in Fig. 2(d). Simulation (solid lines) are obtained by numerically integrating the following nonlinear Schrödinger equation with a split-step method:
−
2 + | | = 0 (1)
where ( , ) is the field envelope, and the distance along the fiber and the retarded time, respectively. is the group velocity dispersion and γ the nonlinear coefficient. The agreement between experiments and simulations is rather good, despite the small discrepancies between the position of the experimental and simulated dips of the pump wave (blue lines). As we have to initially launch five waves into the fiber instead of three ideally to perform our measurements, uncertainties accumulate and the sensitivity of the system to perturbations is increased compared to [22], which can explain these discrepancies. The spatio-temporal evolution of the field in the time domain is then calculated from the inverse Fourier transform of these five waves. Note that we set the local oscillator phase to zero to perform these calculations, leading to an arbitrary constant shift in the time domain that has no impact on the dynamics. The spatio-temporal evolution of the intensity deduced from experimental measurements is displayed in Fig. 3(b) and the phase in Fig. 3(f). As it can be seen, short structures emerge from the initial weakly
Fig. 2. Simulated spectra at (a) = 0 m and (b) = 1.82 km. Longitudinal evolution of (c) power and (d) relative phases compared to the phase of the local oscillator. Blue, red and green correspond to pump, signal and harmonic waves respectively. Dashed lines in (c) and (d) correspond to experimental recordings and solid ones to simulations. Parameters: fiber length = 7.7 km,
group velocity dispersion = −19 × 10 s /m, nonlinear
coefficient γ = 1.3 × 10 /W/m, pump power = 460 mW,
signal to pump ratio -10 dB, harmonic to pump ratio -20 dB, signal detuning 35 GHz from the pump, harmonic detuning 70 GHz from the pump. The initial relative phases of the 5 waves are set to 0.
Fig. 1. Simplified sketch of the experimental setup. , are the
frequencies of the pump laser and local oscillator laser, respectively,
with ∆ = − = 800 MHz. Here = 35 GHz is the input
modulation frequency. MI evolution is studied in a 7.7 km-long single mode fibre (SMF28). The backscattered signal from the fiber goes through a circulator and is analyzed via heterodyning (beating with the local oscillator) and then filtered (programmable filter) to isolate the power and phase evolution of the pump, first order and
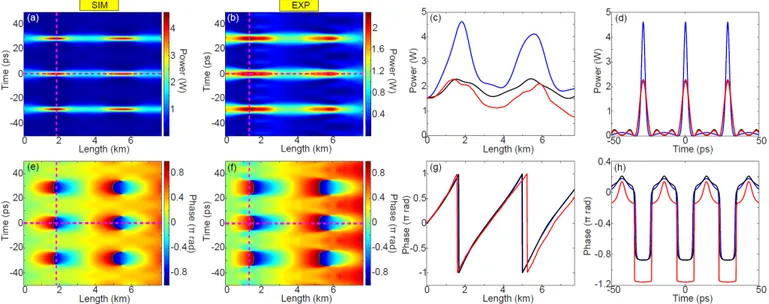
modulated continuous wave. A first maximum compression point appears around 1.5 km and a second one around 6 km. Numerical results displayed in Fig. 3(a) and (e) were obtained by accounting for the full numerical spectrum when calculating the inverse Fourier transform. They show good overall agreement with experimental plots of Fig. 3(b) and (f), respectively. In order to get a more accurate comparison, longitudinal and transversal evolutions along the first maximum compression point (see magenta dashed lines in Fig. 3(a), (b), (e) and (f)) are shown in Figs. 3(c,d,g,h). Experimental intensity traces (red curves in Figs. 3(c) and (d)) look very similar to numerical ones (blue curves) except for a higher power and slightly sharper fronts in the numerical simulations. This discrepancy is due to the limited number of waves considered experimentally to calculate the inverse Fourier transform (only five waves versus the full spectrum in simulations). Indeed, we remind that at maximum compression points, around 40 sidebands are generated (see
Fig. 2(b))andwhile 90% of the energy is accumulated in these five main waves (in simulation), the truncation leads to a lowering of the temporal resolution. We checked from numerical simulations that, truncating the frequency comb to five waves (black curves), we would obtain an excellent agreement with experiments concerning the transverse and longitudinal evolution displayed in Fig. 3(c) and (d). To quantify more accurately the influence of the truncation on the reconstructed spatio-temporal power plot, we define the following error parameter:
= ∑, , − ,
∑, ,
(2)
with and the matrix of the spatio-temporal amplitude with the full spectrum accounted for or the truncation, respectively. Hence, the parameter is a relative least squares error. We then calculated the value of numerically for different numbers of waves accounted for in the reconstruction in simulations. Results are shown in Fig. 4. As it can be seen, follows an exponential decreasing. By increasing from three to five the number of waves, the error is already reduced by a factor of four. Importantly, the reconstruction from three waves (not shown), though in principle possible, is very poor and leads to artefact (for example, the maximum compression points are split in two longitudinally). With seven waves, the error could be further reduced by another factor four, though at the expense of a significant increase in experimental complexity. Note that the phase evolutions along the first maximum compression point displayed in Fig. 3(g) and (h) do not suffer much from this discrepancy due to the truncation procedure. The agreement between experiments and numerical simulations is good. Two phase jumps close to 2π in the longitudinal case (Fig. 3(g)) and
Fig. 4. Influence of the truncation on the precision of the measurement. Black dots correspond to numerical simulations and the blue dashed line is an exponential fit. The inset shows the same plot in log scale with linear fit.
Fig. 3. Spatio-temporal evolution of power ((a) numerical simulations, (b) experiments) and phase ((e) numerical simulations, (f) experiments). (c,g) Longitudinal evolutions of power and phase at the first maximum compression point (along the magenta dashed lines), and (d,h) temporal evolution at this point. Red lines correspond to experiments, blue lines to simulations with the full spectrum and black ones with a truncated spectrum (5 waves).
one close to π between the center of the pulses and their wings in the temporal case (Fig. 3(h)) are observed as expected [3].
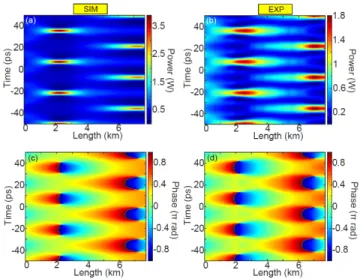
In a second set of experiments, we studied the impact of initial relative phase of the input waves on the MI process. Indeed, as reported in [22], depending on the initial relative phase between the sidebands, different dynamical behaviors can be observed. Here, our aim is to observe directly in the time domain the symmetry breaking nature of the FPU process, which we have indirectly observed in the phase plane in [22]. To do that, we perform the same experiment with a different initial condition. The initial five wave frequency comb is identical in terms of powers, relative phases and frequency shift except for the relative phase of the idler which is changed from 0 to π. Results are displayed in Fig. 5, with the spatio-temporal evolution of power and phase. This time, we experimentally (Fig. 5(b) and (d)) observe two maximum compression points but with a π phase shift. The agreement with numerical simulations (Fig. 5(a) and (c)) is very good.
In conclusion, we have reported the first non-invasive experimental method allowing for full-field longitudinal characterization of breathers formation in the picosecond scale in optical fibers with a 20 m resolution. The technique is illustrated with the first direct observation of the symmetry breaking of the FPU recurrence in the temporal domain. We have reported results by truncating the spectrum to the five main spectral components and get a rather good agreement with numerical simulations. These results could be improved by increasing the number of waves accounted for in the calculations, although this would greatly enhance the experimental complexity. We believe that our system is a very good testbed to further investigate the spatio-temporal dynamics of a large class of nonlinear phenomena involving frequency combs.
Funding. This work was partly supported by the Agence
Nationale de la Recherche through the High Energy All Fiber Systems (HEAFISY) and Nonlinear dynamics of Abnormal Wave Events (NoAWE) projects, the Labex Centre Europeen pour les Mathematiques, la Physique et leurs Interactions (CEMPI) and Equipex Fibres optiques pour les hauts flux (FLUX) through the ‘Programme Investissements d’Avenir’, by the Ministry of Higher Education and Research, Hauts de France council and European Regional Development Fund (ERDF) through the Contrat de Projets Etat-Region (CPER Photonics for Society, P4S) and FEDER through the HEAFISY project.
References
1. J. M. Dudley, G. Genty, F. Dias, B. Kibler and N. Akhmediev, Opt. Express
17, 21497 (2009).
2. B. Kibler, J. Fatome, C. Finot, G. Millot, F. Dias, G. Genty and N. Akhmediev, Nat. Phys. 6, 790 (2010).
3. J. M. Dudley, F. Dias, M. Erkintalo, & G. Genty, Nat Phot. 8, 755 (2014). 4. C.Lei and Keisuke Goda, Nat. Phot. 12, 190 (2018).
5. A. Tikan, S. Bielawski, C. Szwaj, S. Randoux, and P. Suret, Nat. Phot. 12, 228 (2018).
6 P. Ryczkowski, M. Närhi, C. Billet, J.-M. Merolla, G. Genty, and J. M. Dudley, Nat. Phot. 12, 221 (2018).
7. R.Trebino, Frequency-resolved Optical Gating: The Measurement of
Ultrashort Laser Pulses (Springer, 2000).
8. C. Iaconis, and I. A. Walmsley, Opt. Lett 23, 792 (1998). 9. I. A. Walmsley and C. Dorrer, AOP 1, 308 (2009).
10. G. Van Simaeys, Ph. Emplit, M. Halterman, Phys. Rev. Lett 87, 033902 (2001).
11. N. Akhmediev, Nature 413, 267 (2001).
12. V. E. Zakharov and L. A. Ostrovsky, Phys. D 238, 540 (2009).
13. N. Akhmediev, A. Ankiewicz, J. M. Soto-Crespo, J. M. Dudley, Phys. Lett. A 375, 775 (2011).
14. E. Fermi, J. Pasta and S. Ulam, in Collected Papers of Enrico Fermi Vol. 2 (ed. E. Segré), 977 (Univ. Chicago Press, Chicago, Illinois, 1965).
15. S. Trillo and S. Wabnitz, Opt. Lett. 16, 986 (1991).
16. M. Conforti, A. Mussot, A. Kudlinski, S. Rota Nodari, G. Dujardin, S. De Bièvre, A. Armaroli and S. Trillo, Phys. Rev. Lett 117, 013901 (2016) 17. A. Bendahmane, A. Mussot, A. Kudlinski, P. Szriftgiser, M. Confori, S. Wabnitz and S. Trillo, Opt. Express 23, 30861 (2015).
18. A. Mussot, A. Kudlinski, M. Droques, P. Szriftgiser and N. Akhmediev, Phys. Rev. X 4, 011054 (2014).
19. D. Pierangeli, M. Flammini, L. Zhang, G. Marcucci, A. J. Agranat, P. G. Grinevich, P. M. Santini, C. Conti and E. DelRe, Phys. Rev. X 8, 041017 (2018).
20. B. M. Lake, H. C. Yuen, H. Rungaldier and W. E. Ferguson, J. Fluid. Mech 83, 49 (1977).
21. O. Kimmoun, H. C. Hsu, H. Branger, M. S. Li, Y. Y. Chen, C. Khariff, M. Onorato, E. J. R. Kelleher, B. Kiblern, N. Akhmediev and A. Chabchoub, Sci. Rep. 6, 28516 (2016).
22. A. Mussot, C. Naveau, M. Conforti, A. Kudlinski, F. Copie, P. Szriftgiser, and S. Trillo, Nat. Phot. 12, 303 (2018).
Fig. 5. Spatio-temporal evolution of power ((a) numerical simulations, (b) experiments) and phase ((c) numerical simulations, (d) experiments) for the other initial conditions. Parameters are similar than in Fig. 1. except for an initial relative phase of π for the idler component.
FULL REFERENCES
1. J. M. Dudley, G. Genty, F. Dias, B. Kibler and N. Akhmediev, Modulation instability, Akhmediev and continuous wave supercontinuum generation, breathers Opt. Express 17, 21497-21508 (2009).
2. B. Kibler, J. Fatome, C. Finot, G. Millot, F. Dias, G. Genty and N. Akhmediev, The Peregrine soliton in nonlinear fibre optics, Nat. Phys. 6, 790-795 (2010).
3. J. M. Dudley, F. Dias, M. Erkintalo, & G. Genty, Instabilities, breathers and rogue waves in optics, Nature Photonics 8, 755-764 (2014). 4. C.Lei and Keisuke Goda, The complete optical oscilloscope, Nature
Photonics 12, 190-191 (2018).
5. A. Tikan, S. Bielawski, C. Szwaj, S. Randoux, and P. Suret, Single-shot measurement of phase and amplitude by using a heterodyne time-lens system and ultrafast digital time-holography, Nature
Photonics 12, 228-234 (2018).
6. P. Ryczkowski, M. Närhi, C. Billet, J.-M. Merolla, G. Genty, and J. M. Dudley, Real-time full-field characterization of transient dissipative soliton dynamics in a mode-locked laser, Nature
Photonics 12, 221-227 (2018).
7. R. Trebino, Frequency-resolved Optical Gating: The Measurement of
Ultrashort Laser Pulses (Springer, 2000).
8. C. Iaconis, and I. A. Walmsley, Spectral phase interferometry for direct electric-field reconstruction of ultrashort optical pulses, Optics Letters 23, 792-794 (1998).
9. I. A. Walmsley and C. Dorrer, Characterization of ultrashort electromagnetic pulses, Advances in Optics and Photonics 1, 308-437 (2009).
10. G. Van Simaeys, Ph. Emplit, M. Halterman, Experimental Demonstration of the Fermi-Pasta-Ulam Recurrence in a Modulationally Unstable Optical Wave, Physical Review Letters 87, 033902 (2001).
11. N. Akhmediev, Nonlinear physics: déjà vu in optics, Nature 413, 267-268 (2001).
12. V. E. Zakharov and L. A. Ostrovsky, Modulation instability: the beginning, Phys. D 238, 540-548 (2009).
13. N. Akhmediev, A. Ankiewicz, J. M. Soto-Crespo, J. M. Dudley, Universal triangular spectra in parametrically-driven systems, Phys. Lett. A 375, 775-779 (2011).
14. E. Fermi, J. Pasta and S. Ulam, in Collected Papers of Enrico Fermi Vol. 2 (ed. E. Segré), 977-988 (Univ. Chicago Press, Chicago, Illinois, 1965). 15. S. Trillo and S. Wabnitz, Dynamics of the modulation instability in optical fibers, Opt. Lett. 16, 986-988 (1991).
16. M. Conforti, A. Mussot, A. Kudlinski, S. Rota Nodari, G. Dujardin, S. De Bièvre, A. Armaroli and S. Trillo, Heteroclinic structure of parametric resonance in the nonlinear Schrödinger equation, Phys. Rev. Lett 117, 013901 (2016)
17. A. Bendahmane, A. Mussot, A. Kudlinski, P. Szriftgiser, M. Confori, S. Wabnitz and S. Trillo, Optimal frequency conversion in the nonlinear stage of modulation instability, Opt. Express 23, 30861-30871 (2015).
18. A. Mussot, A. Kudlinski, M. Droques, P. Szriftgiser and N. Akhmediev, Fermi-Pasta-Ulam recurrence in nonlinear fiber optics: the role of reversible and irreversible losses, Phys. Rev. X 4, 011054 (2014).
19. D. Pierangeli, M. Flammini, L. Zhang, G. Marcucci, A. J. Agranat, P. G. Grinevich, P. M. Santini, C. Conti and E. DelRe, Observation of Fermi-Pasta-Ulam-Tsingou recurrence and its exact dynamics, Phys. Rev. X 8, 041017 (2018).
20. B. M. Lake, H. C. Yuen, H. Rungaldier and W. E. Ferguson, Nonlinear deep water waves: theory and experiment. Part 2. Evolution of a continuous wave train, J. Fluid. Mech 83, 49 (1977).
21. O. Kimmoun, H. C. Hsu, H. Branger, M. S. Li, Y. Y. Chen, C. Khariff, M. Onorato, E. J. R. Kelleher, B. Kiblern, N. Akhmediev and A. Chabchoub, Modulation instability and phase-shifted Fermi-Pasta-Ulam recurrence, Sci. Rep. 6, 28516 (2016).
22. A. Mussot, C. Naveau, M. Conforti, A. Kudlinski, F. Copie, P. Szriftgiser, and S. Trillo, Fibre multi-wave mixing combs reveal the broken symmetry of Fermi–Pasta–Ulam recurrence, Nature Photonics 12, 303-308 (2018).