1
Artor Niccoli Asabella PhD, MD, 1,2
Alessandra Di Palo MD, 1
Corinna Altini MD, 1 Margherita Fanelli Stat,
1 Cristina Ferrari MD, 1 Valentina Lavelli MD, 2 Girolamo Ranieri MD, 2 Cosmo Damiano Gadaleta MD,
1 Giuseppe Rubini PhD, MD
1. Nuclear Medicine Department, University of Bari “Aldo Moro”, Bari, Italy
2. Diagnostic and Interventional Radiology Unit with Integrated Section of Translational Medical Oncology, National Cancer Research Centre, IRCCS Istituto Tumori “Giovanni Paolo II”, Bari, Italy
Keywords: Malignant pleural mesothelioma 18 - F-FDG PET/CT - Semi-quantitative parameters -SUV -MTV -TLG Corresponding author: Artor Niccoli Asabella MD, PhD Piazza G. Cesare 11, 70124 Bari, Italy Phone number: +39 080 5592913 Fax number: +39 080 5593250 [email protected] Rece ved: 20 August 2018 Accepted revised: 30 September 2018 18
F-FDG PET/CT in therapy response and in predicting
responders or non-responders in malignant pleural
mesothelioma patients, by using semi-quantitative
mRECIST and EORTC criteria
Abstract
Objective: To evaluate the role of uorine-18- uorodeoxyglucose positron emission tomography/ com-18
puted tomography ( F-FDG PET/CT) in therapy response assessment according modi ed response evaluating criteria of solid tumors (mRECIST) and the predictive role of volume-based semi-quantitative parameters in patients with malignant pleural mesothelioma (MPM). Furthermore modi ed RECIST ria for MPM mRECIST and the European Organization for Research and Treatment of Cancer (EORTC)
crite-18
ria were compared and the predictive role of F-FDG PET/CT in the post-therapy outcome. Subjects and 18
Methods: Thirty ve selected patients with MPM underwent F-FDG PET/CT scan at baseline (1) and after 18
therapy (2). Semi-quantitative F-FDG PET/CT parameters were collected for each scan and also differe-nces (Δ) ΔSUVmax, ΔSUVav, ΔMTV, ΔTLG, response index (RI)max% and RIav% were evaluated. Radiolo-gic response to therapy was assessed by using the mRECIST and EORTC. Results: The correlation between response to therapy assessed by EORTC and mRECIST criteria was moderate (K=0.418; 95%CI:0099-0736). According to mRECIST, statistical differences between responders and non-responders were signi cant in the analysis of semi-quantitative parameters. According mRECIST criteria, all parameters de ned a good area under the curve (AUC) but the better AUC resulted for ΔMTV (cut-off≤11.3, sensitivity=91.3%,
speci-city=91.7%) and ΔTLG (cut-off≤59.1, sensitivity=82.6%, speci city=100%). Kaplan-Meier curves bet-ween responders and non-responders did not show statistically signi cant differences. Conclusion: The
18
semi-quantitative analysis of F-FDG PET/CT has an important role in MPM therapy response assessment and has a predictive role in distinguishing responders and non-responders.
Hell J Nucl Med 2018; 21(3): 191-197 Epub ahead of print: 10 November 2018 Published online: 5 December 2018
Introduction
M
alignant pleural mesothelioma (MPM) is a rare and aggressive tumor with high mortality, strictly connected to asbestos exposure with a 20-30 years time lag in the onset. Mesothelioma incidence varies markedly from one country to another; the highest annual crude incidence rates (about 30 cases per million) are observed in Australia, Belgium, and Great Britain. Due to the large use of asbestos in the 1970s-1980s, recently MPM incidence has grown and further increase is expected [1-3]. Chemotherapy with Cisplatino and Pemetrex represents the rst line care in patients with MPM, whereas extra-pleural pneumonectomy and radiotherapy are useful inspeci-c speci-clinispeci-cal speci-conditions [4-6].
Currently, contrast enhancement computed tomography (CECT) is the gold standard imaging technique in MPM assessment. However, since the pleural surface is not a solid organ and the pleural lining has a complex shape, CT imaging may have some difficulties in depicting real tumor extension, because of adjacent pleural effusion or atelectasis and thus in determining the T stage of MPM. In addition, true tumor volume in MPM is a critical factor in determining patients' prognosis and response after therapy [7-9]. The response evaluation criteria in solid tumor (RECIST) used until few years ago are considered only morphologic criteria and the circumferential growth pattern of MPM [10-12]. An alternative measurement protocol speci ed as “modi ed RECIST” for MPM (mRECIST) has been proposed and has become the standard protocol in MPM [13-15], although its use did not completely overcome the difficulties in response interpretation [16, 17].
Fluorine-18-labelled uorodeoxyglucose positron emission tomography/computed 18
tomography ( F-FDG PET/CT) plays a critical role in MPM staging, therapeutic strategy 18
impor-tant role also in therapy response assessment, thanks to so-me semi-quantitative paraso-meters. Voluso-me based paraso-me- parame-ters such as metabolic tumor volume (MTV) and total lesion glycolysis (TLG), allow to better t to MPM the therapy res-ponse assessment, showing the real tumor burden [22].
18 The purpose of our study was to evaluate the role of F-FDG PET/CT in therapy response assessment according the mRECIST criteria and the European Organization for Rese-arch and Treatment of Cancer (EORTC) criteria compared.
18
Furthermore, we studied the predictive role of F-FDG PET/ CT in the post-therapy outcome of patients with MPM. This is the rst similar study in which both semi-quantitative cri-teria of mRECIST and EORTC were evaluated in cancer pati-ents.
Subjects and Methods
Study population
We selected retrospectively 35 patients with histological proven MPM. All patients had initial diagnosis of epithelioid MPM and underwent conventional diagnostic procedures (e.g. thoracic RX, blood biomarker, CT).
The selected patients underwent baseline total body 18
CECT and F-FDG PET/CT at the moment of the diagnosis and also post-therapy, at least 6 weeks after the end of treat-ment (chemotherapy and/or radiotherapy). The interval between the two methods was approximately 3.1 days (ran-ge 1-7 days) both in the baseline and post-therapy study.
The following exclusion criteria were applied: patients who received talc pleurodesis within 1 month from PET/CT in order to exclude the acute phase of in ammation; age yo-unger than 18 years old; history of further malignancy. Writ-ten informed consent was obtained from all patients. Cha-racteristics of the 35 selected patients are reported in Table 1.
Imaging techniques CECT imaging
Contrast enhancement computed tomography examinati-ons were performed with a 16-slice CTMD equipment (TSX-101°, Aquilion 16, Toshiba Medical Systems, Tokyo, Japan) using the following acquisition parameters: slice thickness 1mm, pitch 1.75, increment 0.6mm, rotation time 0.5s, kV/ mAs 120/250. All examinations included intravenous (i.v.) contrast enhancer administration.
18
F-FDG PET/CT
Images were acquired with a combined modality PET/CT Discovery LSA (GE Healthcare, Waukesha, Wisconsin, USA) that integrates a PET (advance nxI) with 16-slice CT scanner
18
(light speed plus). Prior to administration of F-FDG, all pati-ents fasted for at least 8h and had a capillary blood glucose of <160mg/mL. The image acquisition was obtained 50min
18
after the i.v. injection of 4.0MBq/kg of F-FDG. Patients were hydrated by drinking 500mL of water. The CT acquisition parameters were: 340mA (auto), 120kV, slice thickness 3.75mm, tube rotation time 0.8ms and collimation eld of view (FOV) 50cm. The CT images were reconstructed with a ltered back-projection. The CT data were used for attenu-ation correction of PET scanning, which was performed im-mediately after the acquisition of CT images. The PET acqu-isition was obtained in caudal-cranial direction, carried out from the external acoustic meatus to the root of the thigh; PET was reconstructed with a matrix of 128x128, ordered subset expectation maximum iterative reconstruction algo-rithm (two iterations, 28 subsets), 8mm Gaussian lter, and 50cm eld of view.
Rigorous quality controls were performed to ensure cor-rect and stable semi-quantitative parameters properly comparable.
Imaging interpretation CECT image analysis
Contrast enhancement computed tomography baseline and post-therapy images were analyzed by two radiologists with 8 years of experience each. Therapy response asses-sment was performed according to mRECIST and to EORTC criteria.
Patients were classi ed as: complete response (CR), par-tial response (PR), stable disease (SD) and progressive dise-ase (PD). Complete response was de ned as disappearance of all target lesions with no evidence of tumor elsewhere. Stable disease was de ned as neither meeting the criteria of PR nor PD [11, 14-16]. Partial response was de ned as a re-duction of at least 30% in the total tumor measurement. Progressive disease was de ned as an increase of at least 20% in total tumor measured size over the nadir, or as the appearance of one or more new lesions.
18
F-FDG PET/CT image analysis
Fluorine-18-FDG PET/CT images were analyzed qualitati-vely and semi-quantitatiqualitati-vely by using "MultiVol PET/CT" program of Advantage™ Workstation (GE Healthcare, Wau-kesha, Wisconsin, USA). Two nuclear physicians with 8 years Table 1. Clinical characteristics of patients' cohort
Characteristics Value Total, n 35 Sex, n Male/Female 25/10 Age (years) Mean±SD Range 68.29±8.05 52-83 Stage, n I II 15 20 Therapy Chemotherapy (2 lines) Chemotherapy + Radiotherapy Both
28 7
of experience blindly analyzed both baseline and 18
therapy F-FDG PET/CT images.
18 Semi-quantitative parameters were collected both on F-FDG PET/CT scan baseline and after therapy.
Volumes of interest (VOI) were semi-automatically drawn 18
on each pleural area with elevated F-FDG uptake. Volumes 18 of interest were drawn to include all pleural areas with F-FDG uptake without overlap of MPM tumor boundaries; so the number of VOI depended on the extension of MPM.
Standardized uptake value maximum and average (SUVmax and SUVav) were collected from the VOI with the highest value.
In order to assess response to treatment, SUV at the base-line (SUV1) and the post-therapy (SUV2) scans were emplo-yed to calculate the difference ΔSUV (SUV1-SUV2) and the response index (RI=[(SUV1-SUV2)/SUV1]x100); ΔSUV were calculated both for SUVmax and SUVav (ΔSUVmax and ΔSUVav) as well as the RI (RImax and RIav.).
Metabolic tumor volume was calculated automatically for each VOI by using a threshold of 40% of SUVmax, as repor-ted in the literature [23, 24]. Metabolic tumor volume value both baseline (MTV1) and post-therapy (MTV2) was obta-ined by adding MTV values of all VOI drawn for each scan.
Total lesion glycolysis at baseline (TLG1) and post-therapy (TLG2) scans were calculated as: SUVav.xMTV.
Response assessment
Evaluation of response to therapy was performed according mRECIST criteria. Patients were classi ed into 2 groups, the "mRECIST responders" including CR and PR patients and "mRECIST non-responders" including SD and PD patients.
Response to therapy was also evaluated according to the EORTC criteria and patients were classi ed into the groups of "PET/CT responders" if RImax ≥25% and "PET/CT non-responders" if RImax <25% [25].
Representative images of a responder and a non-respon-der patient, according both to mRECIST and EORCT criteria, are shown in Figures 1 and 2, respectively.
Statistical analysis
18
Each F-FDG PET/CT semi-quantitative parameter (at base-line and post-therapy and the differences between two scans) were compared between "mRECIST responders" and "mRECIST non-responders" using Student's t test for inde-pendent samples; P value <0.05 was considered indicative of a signi cant difference.
Receiver operating characteristic (ROC) analysis was per-18
formed to evaluate the semi-quantitative F-FDG PET/CT parameters in predicting therapy response.
The correlation between response to therapy assessed by mRECIST criteria and by EORTC criteria was calculated by Cohen's K coefficient.
Survival curves were estimated using the Kaplan–Meier method.
All statistical analysis was carried out using IBM SPSS Sta-tistics for Mac OS, version 20.0, 2012.
Figure 1. A female, age 77 patient with relapsed MPM evaluated as “mRECIST and
18
EORCT responders”. Images of F-FDG PET/CT maximal intensity projection (MIP) 18
a and axial b images showed intense F-FDG uptake in the right pleural pro le and in the thoracic nodes. Semi-quantitative parameters were: SUVmax1=15.6, SUVav1=8.3 MTV1=257.11, TLG1=2134.01. Fluorine-18-FDG PET/CT MIP c and axial d: 18F-FDG uptake reduction in right pleural pro le; semi-quantitative parameters: SUVmax2=8.3, SUVav2=4.4, MTV2=58.24, TLG2=256.256. Analysis of the difference between the two scans showed: ΔSUVmax=7.3, ΔSUVav=3.9, RImax=46% RIav=46%, ΔMTV=198.87 and ΔTLG=1877.757.
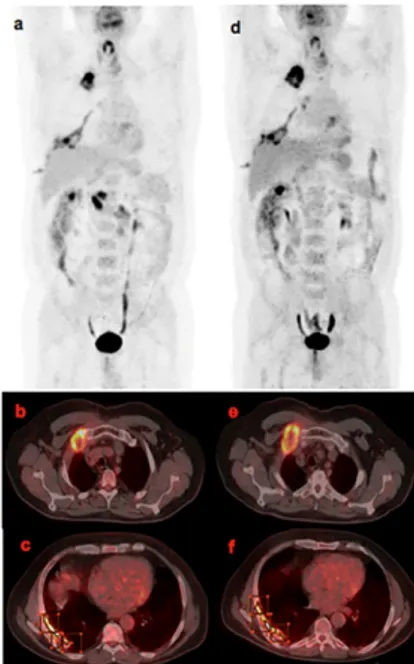
Figure 2. A non-responder patient, male, aged 72 with relapsed MPM by
“mRE-CIST and by EORCT criteria”. Fluorine-18-FDG PET/CT MIP and axial baseline a, b, c 18
and post therapy d, e, f images show intense F-FDG uptake in right pleural pro le. Semi-quantitative parameters: SUVmax1=13.5, SUVav1=7.7 MTV1=34.04, TLG1=262.108, SUVmax2=18.5, SUVav2=9.9, MTV2=90.29 and TLG2=893.871. Analysis of the difference between the two scans showed ΔSUVmax=-5.0, ΔSUVav=-2.2, RImax=-37% RIav=-28%, ΔMTV=-56.25 and ΔTLG=-631.763.
Results
Response to therapy according to mRECIST criteria
Patients “mRECIST responders” were 12/35 while “mRECIST non-responders” were 23/35.
"mRECIST non-responders": 13/23 were SD, 10/23 PD. 18
Semi-quantitative F-FDG PET/CT parameters
18
The average values for all F-FDG PET/CT parameters are shown in Table 2.
18
Comparison of F-FDG PET/CT semi-quantitative para-meters showed statistically signi cant differences between "mRECIST responders" and "mRECIST non-responders" for all parameters except for SUVmax1 (P=0.90) and SUVav1 (P= 0.94), as reported in Table 3.
Receiver operating characteristic analysis of post-tre-18
atment F-FDG PET/CT semi-quantitative parameters sho-wed good diagnostic capability for all of them (Figure 3a); ROC analysis of Δ values showed good diagnostic capability for all parameters, but better performance was detected for ΔMTV (cut-off≤11.3, sensitivity 91.3%, speci city 91.7%) and ΔTLG (cut-off≤59.1, sensitivity 82.6%, speci city 100%) (Figure 3b).
Figure 3. a. The ROC curves of semi-quantitative parameters of the
post-treat-18
ment F-FDG PET/CT showed good diagnostic capability for all parameters. b. The ROC curves of Δ values of the semi-quantitative parameters showed good diagnos-tic capability for all parameters, better for ΔMTV and ΔTLG.
Response to therapy according to EORCT criteria
According to EORTC criteria, “PET/CT responders” patients were 13/35 while “PET/CT non-responders” were 22/35.
The concordance between response to therapy assessed 18
by F-FDG PET/CT between EORTC and mRECIST criteria was moderate (K=0.418; 95% CI: 0099-0736).
Survival results
Survival was calculated from the date of the end of the last treatment to the date of the last follow-up or till death.
Patients were followed-up for an average period of 25.8 months (range 3 to 60 months). At the end of the follow-up period 16/35 patients were still alive, while 19/35 patients were dead. Among “mRECIST responders” 9/12 patients we-re alive while 3/12 patients wewe-re dead. Among “mRECIST non-responders”, 10/23 patients were alive while 13/23 pati-ents were dead. Median survival in “mRECIST responders” was 27 months (95%CI: 20.7 to 33.2), while in “mRECIST non-responders” was 24 months (95%CI: 11.4 to 36.5).
Among “PET/CT responders” 7/13 patients were alive while 6/13 patients were dead. Among “PET/CT
non-respon-18
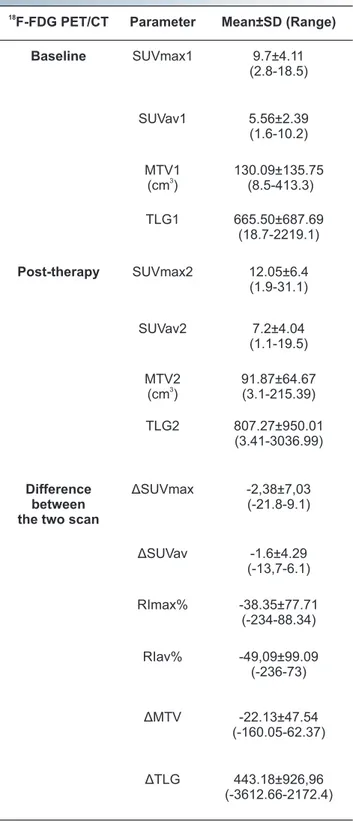
Table 2. F-FDG PET/CT analyses in the population studied. 18
F-FDG PET/CT Parameter Mean±SD (Range) Baseline SUVmax1 9.7±4.11 (2.8-18.5) SUVav1 5.56±2.39 (1.6-10.2) MTV1 3 (cm ) 130.09±135.75 (8.5-413.3) TLG1 665.50±687.69 (18.7-2219.1) Post-therapy SUVmax2 12.05±6.4 (1.9-31.1) SUVav2 7.2±4.04 (1.1-19.5) MTV2 3 (cm ) 91.87±64.67 (3.1-215.39) TLG2 807.27±950.01 (3.41-3036.99) Difference between the two scan
ΔSUVmax -2,38±7,03 (-21.8-9.1) ΔSUVav -1.6±4.29 (-13,7-6.1) RImax% -38.35±77.71 (-234-88.34) RIav% -49,09±99.09 (-236-73) ΔMTV -22.13±47.54 (-160.05-62.37) ΔTLG 443.18±926,96 (-3612.66-2172.4)
ders” 13/22 patients were alive while 9/22 patients were de-ad. Median survival in “PET/CT responders” was 26.4 months (95%CI: 20.3 to 34.4), while in “PET/CT non-responders” was 23 months (95%CI: 11.1 to 33.2).
Kaplan Meier curves of “mRECIST responders” compared to “mRECIST non-responders” did not show statistically sig-ni cant differences, as well as “PET/CT responders” compa-red to “PET/CT non-responders”.
Discussion
Given the particular growth pattern of MPM, characterized by 'rind' around the hemithorax and along interlobar ssu-res [2], standard RECIST criteria ssu-resulted to be not
appro-priate in the therapy response evaluation. Currently “mRE-CIST criteria” represent the mesothelioma guidelines of refe-rence but even them don't t adequately to the complete evaluation of MPM [11, 14-16].
The SUVmax is already known as a signi cant prognostic factor and a guide of treatment response evaluation in many malignant tumors and is the most validated
semi-quanti-18
tative F-FDG PET/CT parameter [25, 26]. Despite this, SUVmax role is still debated. In a study of 57 patients, Niccoli
18
et al. (2013) concluded that F-FDG PET/CT through SUVmax is a useful tool to evaluate the metabolic response to chemo-radiotherapy and to monitor the follow-up in MPM [27].The measurement of SUVmax represents a simple method not strictly dependent on the size of the VOI drawn,
18 however, it expresses only pixels with the highest F-FDG concentration in the VOI, and does not re ect the
18
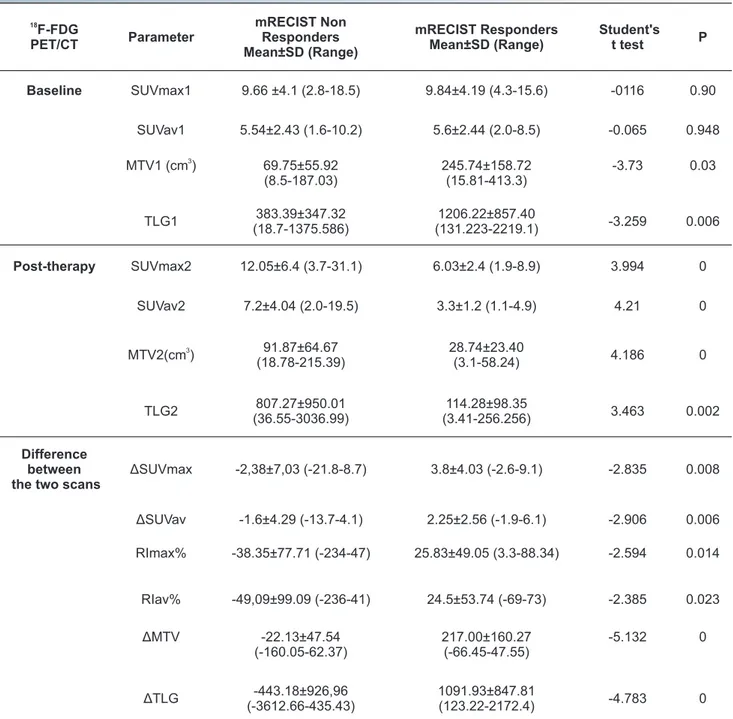
Table 3. F-FDG PET/CT parameters in patients “responders” and “non-responders” according to mRECIST.
18 F-FDG PET/CT Parameter mRECIST Non Responders Mean±SD (Range) mRECIST Responders Mean±SD (Range) Student's t test P Baseline SUVmax1 9.66 ±4.1 (2.8-18.5) 9.84±4.19 (4.3-15.6) -0116 0.90 SUVav1 5.54±2.43 (1.6-10.2) 5.6±2.44 (2.0-8.5) -0.065 0.948 3 MTV1 (cm ) 69.75±55.92 (8.5-187.03) 245.74±158.72 (15.81-413.3) -3.73 0.03 TLG1 383.39±347.32 (18.7-1375.586) 1206.22±857.40 (131.223-2219.1) -3.259 0.006 Post-therapy SUVmax2 12.05±6.4 (3.7-31.1) 6.03±2.4 (1.9-8.9) 3.994 0 SUVav2 7.2±4.04 (2.0-19.5) 3.3±1.2 (1.1-4.9) 4.21 0 3 MTV2(cm ) (18.78-215.39)91.87±64.67 28.74±23.40 (3.1-58.24) 4.186 0 TLG2 (36.55-3036.99)807.27±950.01 (3.41-256.256)114.28±98.35 3.463 0.002 Difference between the two scans
ΔSUVmax -2,38±7,03 (-21.8-8.7) 3.8±4.03 (-2.6-9.1) -2.835 0.008 ΔSUVav -1.6±4.29 (-13.7-4.1) 2.25±2.56 (-1.9-6.1) -2.906 0.006 RImax% -38.35±77.71 (-234-47) 25.83±49.05 (3.3-88.34) -2.594 0.014 RIav% -49,09±99.09 (-236-41) 24.5±53.74 (-69-73) -2.385 0.023 ΔMTV -22.13±47.54 (-160.05-62.37) 217.00±160.27 (-66.45-47.55) -5.132 0 ΔTLG -443.18±926,96 (-3612.66-435.43) 1091.93±847.81 (123.22-2172.4) -4.783 0
Our results showed a difference statistically signi cant in ΔSUVmax and ΔSUVav. between the mRECIST responders and non-responders groups, con rming that the SUV values are reliable parameters for treatment response evaluation of MPM patients.
On the other hand, there is an increasing interest in the 18
use of semi-quantitative F-FDG PET/CT parameters, like MTV and TLG, able to measure the metabolic activity in the entire tumor volume and potentially being more sensitive than SUVmax [21, 23, 26].
Metabolic tumor volume and TLG are three-dimensional (3D) measurements, which incorporate the total tumor vo-lume and its metabolic activity. The role of vovo-lume-based 18
F-FDG PET/CT parameters were already studied for several tumors such as lung cancer, colorectal cancer, and glioma [23, 28-36]. Currently there is not a consensus about the method of measurement of these parameters, especially for MPM [37].
It has been reported that MTV was calculated using com-mercially available workstation, through a single rectangu-lar VOI on the entire corresponding hemithorax, excluding possible interferences from kidneys and myocardium by subtracting a second VOI positioned over them [38]. Lee et al. (2010) calculated MTV through an automatic VOI, using an isocontour threshold based on liver SUVmean, but the most published methods used a xed threshold too [39, 40]. The method of the single VOI is poorly suited to MPM pati-ents because of the characteristic plaque-like tumor mass and also the problems associated with differentiating tumor from adjacent tissues and organs, such as chest wall, medi-astinum, heart and liver.
The evaluation of semi-quantitative parameters requires a very rigorous and precise method that has to be replicable, reliable and not operator-dependent. In our study we chose a xed threshold and calculated MTV by adding MTV of eve-ry VOI drawn in order to cover the whole extent of the tumor and to eliminate possible interferences by other organs. This small time-consuming method, yields a more precise calculation of MTV, and consequently also of TLG, revealing the real metabolic status of the entire neoplastic process.
In a study of 131 MPM patients, some authors demonstra-ted that ΔSUVmax and ΔTLG are useful in predicting thera-py response according to mRECIST criteria, in particular
18
they considered an interim F-FDG PET/CT study [41]. In our study, even if on a smaller number of patients, all parameters analyzed were predictive of the treatment response, con r-ming the signi cant correlation of the metabolic changes
18
on F-FDG PET/CT with treatment efficacy. In particular, ΔMTV and ΔTLG were the best predictors, because they re ected the burden of the entire tumor. This result also sug-gests the necessity to perform both baseline and
post-treat-18
ment F-FDG PET/CT scans with the same rigorous and pre-cise method.
We found a statistically signi cant difference between “mRECIST responders” and “mRECIST non-responders” for all parameters except for SUVmax1 and SUVav1. Further-more, we evidenced that MTV1 and TLG1 were statistically different between the responders and non-responders mRECIST groups, because they also re ected the metabolic differences in the whole tumor mass such as necrosis areas
that could invalidate treatment efficacy.
European Organization for Research and Treatment of Cancer criteria for distinguishing treatment responders
18 from non-responders in MPM are also based on F-FDG PET/CT imaging considering the SUVmax as the reference parameter and are easier to applying respect to mRECIST criteria [15, 25]. Despite this and their moderate concor-dance with mRECIST criteria, the EORCT criteria cannot be applied routinely for MPM because they have not yet been validated by a large MPM population study.
The survival in MPM patients is extremely different depen-ding on the treatments applied and can be longer than 30 months in case of multimodality treatments [42].
A study by Ceresoli et al. (2006), showed a longer overall 18
survival in patients who were F-FDG PET/CT metabolic res-ponders [43]. In another study, Francis et al. (2007), conclu-ded that ΔTLG was signi cantly related to survival [22]. Schaefer et al. (2012), in a study of 41 patients, showed that mRECIST had higher correlation with the overall survival
18
than F-FDG PET/CT [44, 45].
In our study the survival was in accord with other papers in medical literature and we didn't nd any difference statis-tically signi cant between responders and non-responders, neither for mRECIST criteria, nor for EORCT criteria. This could be explained by the small number of our patients stu-died that is anyway appropriate considering the rarity of the MPM and the selective inclusion criteria.
In conclusion, our study suggested the important role of
18
F-FDG PET/CT in therapy response assessment of MPM. 18
The semi-quantitative analysis of F-FDG PET/CT using the mRECIST and less the EORCT criteria has a predictive role in distinguishing responders and non-responders to treat-ment MPM patients.
The authors declare that they have no con icts of interest
Bibliography
1. Antman KH. Natural history and epidemiology of malignant meso-thelioma. Chest 1993; 103 (Suppl 4): 373-6.
2. Pisani RJ, Colby TV, Williams DE. Malignant mesothelioma of the pleura. Mayo Clin Proc 1988; 63(12): 1234-44.
3. Peto J, Decarli A, La Vecchia C et al. The European mesothelioma epi-demic. Br J Cancer 1999; 79: 666-72.
4. Sugarbaker DJ, Flores RM, Jaklitsch MT et al. Resection margins, ex-trapleural nodal status, and cell type determine postoperative long-term survival in trimodality therapy of malignant pleural me-sothelioma: results in 183 patients. J Thorac Cardiovasc Surg 1999; 117(1): 54-63.
5. Sterman DH, Treat J, Litzky LA et al. Adenovirus-mediated herpes simplex virus with thymidine kinase/ ganciclovir gene therapy in patients with localized malignancy: results of a phase I clinical trial in malignant mesothelioma. Hum Gene Ther 1998; 9(7): 1083-92. 6. Takita H, Dougherthy TJ. Intracavitary photodynamic therapy for
malignant pleural mesothelioma. Semin Surg Oncol 1995; 11(5): 368-71.
7. Kawashima A, Libshitz HI. Malignant pleural mesothelioma: mani-festations in 50 cases. Am J Roentgenol 1990; 155: 965-9.
8. Heelan RT, Rusch VW, Begg CB et al. Staging of malignant pleural mesothelioma: comparison of CT and MR imaging. Am J Roen-tgenol 1999; 172: 1039-47.
9. Armato SG, Ogarek JL, Starkey A et al. Variability in mesothelioma tumor response classi cation. Am J Roentgenol 2006; 186: 1000-6. 10. Eisenhauer EA, Therasse P, Bogaerts J et al. New response evaluation
criteria in solid tumours: Revised RECIST guideline (version 1.1). Eur J Cancer 2009; 45: 228-47.
11. Monetti F, Casanova S, Grasso A et al. Inadequacy of the new res-ponse evaluation criteria in solid tumors (RECIST) in patients with malignant pleural mesothelioma: report of four cases. Lung Cancer 2004; 43: 71-4.
12. van Klaveren RJ, Aerts JGJV, de Bruin H et al. Inadequacy of the RE-CIST criteria for response evaluation in patients with malignant ple-ural mesothelioma. Lung Cancer 2004; 43: 63-9.
13. Byrne MJ, Nowak AK. Modi ed RECIST criteria for assessment of res-ponse in malignant pleural mesothelioma. Ann Oncol 2004; 15: 257-60.
14. Nowak AK. CT, RECIST, and malignant pleural mesothelioma. Lung Cancer 2005; 49(Suppl 1): S37-40.
15. Armato SG 3rd, Nowak AK. Revised Modi ed Response Evaluation Criteria in Solid Tumors for Assessment of Response in Malignant Pleural Mesothelioma (Version 1.1). J Thorac Oncol 2018; 13(7): 1012 -21.
16. Armato SG 3rd, Oxnard GR, MacMahon H et al. Measurement of me-sothelioma on thoracic CT scans: a comparison of manual and computer-assisted techniques. Med Phys 2004; 31: 1105-15. 17. Armato III SG, Oxnard GR, Kocherginsky M et al. Evaluation of
semi-automated measurements of mesothelioma tumor thickness on CT scans. Acad Radiol 2005; 12: 1301-9.
18. Kruse M, Sherry SJ, Paidpally V et al. FDG PET/CT in the management of primary pleural tumors and pleural metastases. Am J Roentgenol 2013; 201(2): W215-26.
19. Sharif S, Zahid I, Routledge T et al. Does positron emission tomog-raphy offer prognostic information in malignant pleural meso-thelioma? Interact Cardiovasc Thorac Surg 2011; 12(5): 806-11.
rd
20. Armato SG 3 , Labby ZE, Coolen J et al. Imaging in pleural meso-th
thelioma: a review of the 11 International Conference of the Inter-national Mesothelioma Interest Group. Lung Cancer 2013; 82(2): 190-6.
21. Basu S, Saboury B, Torigian DA et al. Current evidence base of FDG-PET/CT imaging in the clinical management of malignant pleural mesothelioma: emerging signi cance of image segmentation and global disease assessment. Mol Imaging Biol 2011; 13(5): 801-11. 22. Francis RJ, Byrne MJ, van der Schaaf AA et al. Early prediction of
res-ponse to chemotherapy and survival in malignant pleural meso-thelioma using a novel semi-automated 3-dimensional
volume-18
based analysis of serial F-FDG PET scans. J Nucl Med 2007; 48: 1449-58.
23. Larson SM, Erdi Y, Akhurst T et al. Tumor Treatment Response Based on Visual and Quantitative Changes in Global Tumor Glycolysis Using PET-FDG Imaging. The Visual Response Score and the Change in Total Lesion Glycolysis. Clin Positron Imaging 1999; 2(3): 159-71. 24. Lee JA. Segmentation of positron emission tomography images:
so-me recomso-mendations for target delineation in radiation oncology. Radiother Oncol 2010; 96(3): 302-7.
25. Young H, Baum R, Cremerius U et al. Measurement of clinical and 18
subclinical tumour response using [ F]- uorodeoxyglucose and positron emission tomography: Review and 1999 EORTC recom-mendations. Eur J Cancer 1999; 35(13): 1773-82.
18 26. Chung MK, Jeong HS, Park SG et al. Metabolic tumor volume of
F-uorodeoxyglucose positron emission tomography/computed tomography predicts short-term outcome to radiotherapy with or without chemotherapy in pharyngeal cancer. Clin Cancer Res 2009; 15(18): 5861-8.
18
27. Niccoli A, Notaristefano A, Rubini D et al. F-FDG PET/CT in suspec-ted recurrences of epithelial malignant pleural mesothelioma in asbestos- bers-exposed patients (comparison to standard diag-nostic follow-up). Clinical Imaging 2013; 37: 1098-103.
28. Guillem JG, Moore HG, Akhurst T et al. Preoperative uorodeoxy-glucose-positron emission tomography assessment of response to preoperative chemoradiation: a means for determining long term outcomes of rectal cancer. J Am Coll Surg 2004; 199(1): 1-7.
29. Akhurst T, Ng V V, Larson SM et al. Tumor burden assessment with positron emission tomography with. Clin Positron Imag 2000; 3: 57-65.
18 30. Altini C, Niccoli Asabella A, De Luca R et al. Comparison of F-FDG
PET/CT methods of analysis for predicting response to neoadjuvant chemoradiation therapy in patients with locally advanced low rectal cancer. Abdom Imaging 2015; 40(5): 1190-202.
18 31. Tralins KS, Douglas JG, Stelzer KJ et al. Volumetric analysis of F-FDG
PET in glioblastoma multiforme: prognostic information and pos-sible role in de nition of target volumes in radiation dose esca-lation. J Nucl Med 2002; 43: 1667-73.
18
32. Oner AO, Budak ES, Yildirim S et al. The value of F-FDG PET/CT para-meters, hematological parameters and tumor markers in predicting KRAS oncogene mutation in colorectal cancer. Hell J Nucl Med 2017; 20(2): 160-5.
33. Nguyen T, Hess S, Petersen H et al. Can semiquantitative measu-rements of SUVmax and cut-off values differentiate colorectal malignant from benign lesions? Hell J Nucl Med 2017; 20(2): 113-21. 34. Khiewvan B, Torigian DA, Emamzadehfard S et al. Update of the role
of PET/CT and PET/MRI in the management of patients with cer-vical cancer. Hell J Nucl Med 2016; 19(3): 254-68.
35. Bhoil A, Singh B, Singh N et al. Can 3'-deoxy-3'-(18)F- uorothymidine or 2'-deoxy-2'-(18)F- uoro-d-glucose PET/CT better assess respon-se after 3-weeks treatment by epidermal growth factor receptor ki-nase inhibitor, in non-small lung cancer patients? Preliminary results. Hell J Nucl Med 2014; 17(2): 90-6.
36. Zhang Y, Li B, Li X et al. An imaging target TGF-β1 for hepatocellular carcinoma in mice. Hell J Nucl Med 2017; 20(1): 76-8.
37. Marin-Oyaga VA, Salavati A, Houshmand S et al. Feasibility and performance of an adaptive contrastoriented FDG PET/CT quanti -cation technique for global disease assessment of malignant ple-ural mesothelioma and a brief review of the literature. Hell J Nucl Med 2015; 18(1): 11-8.
38. Veit-Haibach P, Schaefer NG, Steinert HC, et al. Combined FDG PET/ CT in response evaluation of malignant pleural mesothelioma. Lung Cancer 2010; 67(3): 311-7.
18 39. Lee HY, Hyun SH, Lee KS et al. Volume-based parameter of F-FDG
PET/CT in malignant pleural mesothelioma: prediction of thera-peutic response and prognostic implications. Ann Surg Oncol 2010; 17(10): 2787-94.
18
40. Altini C, Niccoli Asabella A, Di Palo A et al. F-FDG PET/CT role in sta-ging of gastric carcinomas: comparison with conventional contrast enhancement computed tomography. Medicine (Baltimore) 2015; 94(20): e864.
41. Lopci E, Zucali PA, Ceresoli GL et al. Quantitative analyses at baseline and interim PET evaluation for response assessment and outcome de nition in patients with malignant pleural mesothelioma. Eur J Nucl Med Mol Imaging 2015; 42(5): 667-75.
42. Montanaro F, Rosato R, Gangemi M et al. Survival of pleural malig-nant mesothelioma in Italy: a population-based study. Int J Cancer 2009; 124(1): 201-7.
43. Ceresoli GL, Chiti A, Zucali PA et al. Early response evaluation in malignant pleural mesothelioma by positron emission tomography
18
with [ F] uorodeoxyglucose. J Clin Oncol 2006; 24: 4587-93. 44. Schaefer NG, Veit-Haibach P, Soyka JD et al. Continued pemetrexed
and platin-based chemotherapy in patients with malignant pleural 18
mesothelioma (MPM): value of F-FDG-PET/CT. Eur J Radiol 2012; 81(1): e19-25.
45 Incerti E, Broggi S, Fodor A et al. FDG PET-derived parameters as prognostic tool in progressive malignant pleural mesothelioma tre-ated patients. Eur J Nucl Med Mol Imag 2018: doi: 10.1007/s00259-018-4056-6.