Technoeconomic assessment of solar combined heat and power
systems based on hybrid PVT collectors in greenhouse applications
Kai Wang1,*, Antonio Marco Pantaleo1,2, Giacomo Scarascia Mugnozza2, Christos N. Markides1 1 Clean Energy Processes (CEP) Laboratory, Department of Chemical Engineering, Imperial CollegeLondon, South Kensington Campus, London SW7 2AZ, United Kingdom
2 Department of Agro-Environmental Sciences, University of Bari, Via Amendola 165/A, 70125 Bari, Italy * Corresponding author: [email protected]
Abstract. This paper presents a technoeconomic analysis of a solar combined heat and power (S-CHP) system
based on hybrid photovoltaic-thermal (PVT) collectors for distributed cogeneration in a greenhouse tomato-farm in Bari, Italy. The thermal and electrical demands of the greenhouse of interest are currently fulfilled by a gas-fired CHP system that features an internal combustion engine (ICE) prime mover, and partially by an auxiliary gas boiler and electricity from the grid. A PVT-water S-CHP system is designed and sized based on a transient model, with hourly weather data and measured demand data given as inputs. Annual simulations are performed to predict the transient behaviour of the S-CHP system and to assess the system’s energy outputs. The economic profitability of such solution is also evaluated by considering the investment costs and cost savings due to the reduced on-site energy consumption. The results show that, with an installation area of 30,000 m2, the PVT S-CHP system is able
to cover up to 73% of the annual thermal demand of the greenhouse, while delivering a net electrical output 2.6 times that of the annual electrical demand. This performance is similar to that achieved by the equivalent ICE-CHP system (92% and 2 times, respectively). Furthermore, the total annual cost saving of the PVT S-CHP system is more than 6 times higher than that of the ICE system, due to the much lower fuel cost of the PVT system. Similarly, the potential CO2 emission reduction associated with the PVT system is considerably higher, at 3010 tCO2/year
saved (vs. 86 tCO2/year). The payback time of the PVT system is not significantly longer than that of the ICE
system (10.4 years vs. 8.4 years), but its levelized cost of energy is much lower (0.076 €/kWh vs. 0.132 €/kWh)due to the higher annual cost savings. These results indicate that such PVT S-CHP systems have an excellent technoeconomic potential in the proposed greenhouse applications and could be competitive over conventional fossil-fuel-based ICE-CHP systems in terms of energetic, economic and also environmental metrics.
1. Introduction
Greenhouse farming plays an important role in the agriculture sector due to its ability for improving of crop yield and quality. Intensive energy demand is needed to ensure the appropriate climatic conditions (e.g. lighting, temperature, humidity, air composition, etc) for crop growth. Conventional fossil-fuel based energy solutions have heavy environmental impacts, and renewable energy alternatives are therefore being explored, such as solar energy [1], geothermal energy [2], biomass [3], etc.
Solar energy has been the most extensively studied renewable energy source in the context of greenhouse applications. Roof-installed photovoltaics (PV) were investigated for covering the electrical demand of greenhouses in previous studies [4,5] while the effect of PV panels on crop production were also considered [6,7]. Other researchers proposed the integration of PV panels with ground source heat pump to provide cooling and heating for a greenhouse in Turkey [8], and found that nearly zero energy target is achievable with a simple payback time of around 7 year if given access to reasonable installation areas. An environmental analysis based on the tests of twin greenhouses in Valenzano (Italy) showed that an integration of PV panels, a ground source heat pump and an alkaline electrolyser can reduce carbon emissions by 50% compared to a conventional hot air
generator using liquefied petroleum gas [9-11]. Another study showed that application of advanced solar technology for better thermal storage, PV power generating and light utilization balance can be effective to further promote solar energy utilization in modern solar greenhouses [1].
Solar thermal technologies [12] have also been investigated for heating and cooling provision to greenhouses with flat-plate and evacuated-tube collectors in used for space heating in several Chinese greenhouse projects [1,13]. Another experimental study using solar air heaters (SAH) for greenhouse heating in Iraq showed that all the daily thermal demand can be covered if 45% of the roof area is covered with the SAHs [14]. Other researchers proposed to use rock-beds to store excess heat during daytime, and found the system was able to improve tomato yields by 22% compared to a conventional greenhouse [15]. Solar-desiccant assisted evaporative cooling systems were also studied for year-round greenhouse lettuce cultivation in hot and humid climates prevailing in tropics and subtropics [16].
Hybrid PV-thermal (PVT) collectors [17-24], which generate both electricity and useful thermal energy from the same aperture area, have a good potential in meeting the multi-vector energy demands of greenhouses. Mahdavi et al. [25] performed energy/exergy based evaluation of heating/cooling potential of PVT-air collectors and earth-air heat exchanger integrated into a solar greenhouse based on a thermal model. As there is no thermal storage in their system, the heating/cooling potential of the PVT-air system was found to be limited. Nayak and Tiwari [26] conducted an energy/exergy analysis of a PVT system for a greenhouse at Delhi based on experimental tests under typical clear day conditions. An exergy efficiency of around 4% was observed for such system integrated with the greenhouse. Hussain et al. [27] evaluated the energy potential and economic viability of concentrated PVT (CPVT) systems as a substitute for electricity, kerosene, and diesel for greenhouse heating. They found that by installing a CPVT system instead of buying electricity, kerosene and diesel for greenhouse heating, the discounted payback periods were 21 years, 16 years and 11 years, respectively. According to literature review, work on PVT systems for greenhouse application is still scarce and has been mostly focused on energetic modelling while economic and environmental considerations are rarely considered.
This paper aims to perform a technoeconomic assessment of a PVT-driven solar combined heat and power (S-CHP) system for greenhouse applications. As a case study, a tomato greenhouse farm in Monopoli based in Bari, Italy is selected. An energetic model considering the dynamic heat transfer processes in PVT collectors and thermal storage tank is developed for year-round simulations of the S-CHP system. Dynamic characteristics and energetic performance are then analysed, followed by an economic assessment based on existing cost models of the proposal system.
2. Description of the greenhouses and PVT S-CHP system
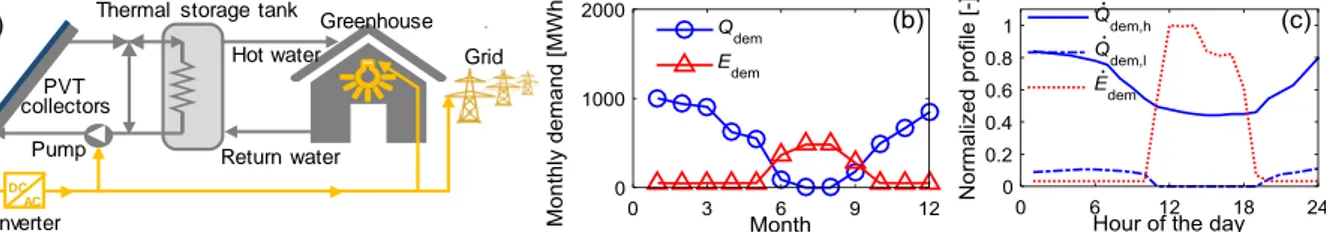
The proposed S-CHP system based on PVT collectors is shown in Figure 1(a). Part of the solar energy is directly converted to electricity by the PV cells while the rest is partially collected and stored in a thermal storage tank as thermal energy via the circulating heat transfer fluid. The stored thermal energy is extracted through a water circulation loop for greenhouse heating. The electrical output is used to compensate the electricity consumption of the pumps and to cover the electrical demand of the greenhouse, with any excess exported to the grid via net metering option. A natural gas boiler and grid electricity are used as backup sources if the energy outputs of the PVT S-CHP system are insufficient.
A large tomato greenhouse farm operated by Fratelli Lapietra Company in Monopoli (Bari, Italy) is selected as an application case for the proposed S-CHP system. The farm aims to use advanced CHP technologies to produce different kinds of tomatoes with yields up to 50 kg/m2-year. It consists of four greenhouses with a total area of 40,900 m2. The optimal temperature and relative humidity for tomatoes are respectively 20-25 °C and 50-60%. The tested monthly thermal demands of the greenhouses are reported in Figure 1(b). Two different profiles of the hourly thermal demand are assumed for hot and cold periods respectively based on averages of the tested profiles in typical days, as denoted by Qdem,s (June − September) and Qdem,w (October − May), respectively. The farm has a year-round baseload demand of electricity for illumination, ventilation, irrigation and water circulation, and here a constant hourly profile is assumed. In hot periods (June-September), extra electricity is required to meet the cooling load for the greenhouses, and the hourly profile is shown in Figure 1(c) [8].
The required temperature of the hot water delivered to the greenhouses is 55 °C (with a 35 °C return). The energy demands are currently fulfilled by three 320 kWe/1500 kWt internal combustion engines
(ICEs) and gas boiler is used as an auxiliary source. The electrical efficiency of the ICEs is around 34% and the total efficiency of the ICE-CHP is about 82% at the normal operational condition. The ICEs are used primarily for covering the thermal demand and all the generated electricity is exported to the grid in its current operational scenario. The ICE-CHP is operated with variable outputs following the thermal demand during winter season, while it is switched off in summer and partially in the spring season. Although electrical demand is high during summer season, it is not profitable to run the ICE-CHP for covering the electrical demand as massive amount of thermal energy needs to be discharged.
Figure 1. (a) PVT-CHP system for greenhouses, (b) monthly, and (c) hourly energy-demand profiles. 3. Technoeconomic model of the PVT S-CHP system
A transient model has been built for the proposed PVT S-CHP system. Single-glazed PVT-water collectors with sheet-and-tube thermal absorber are used in this work. The energy balance equations for the glass covers, PV cells and water in the thermal storage tank are:
𝑀g𝐶gd𝑇d𝑡g= 𝑄̇s,g+ 𝑄̇r,pv−g+ 𝑄̇c,pv−g− 𝑄̇r,g−sky− 𝑄̇c,g−a (1)
𝑀pv𝐶pvd𝑇pv
d𝑡 = 𝑄̇s,pv− 𝑄̇r,pv−g− 𝑄̇c,pv−g− 𝑄̇c,pv−w (2)
𝑀wt𝐶wtd𝑇wt
d𝑡 = 𝑄̇w−wt− 𝑄̇wt,loss− 𝑄̇dem (3)
where M, C, T and 𝑄̇ denote the mass, heat capacity, temperature and heat transfer rate, respectively. The subscripts ‘s’, ‘r’, ‘c’, ‘g’, ‘pv’, ‘wt’, ‘w’, ‘loss’, ‘dem’, ‘a’ and ‘sky’ refer to solar energy, radiation, convection, glass cover, PV cells, water tank, water, heat losses, thermal demand, ambient and sky, respectively. The detailed equations for these heat transfer mechanisms can be found in Refs. [17,28]. The effectiveness-NTU method is used to characterize the heat transfer process between the PV cells and the circulating water, and that between the circulating water and the water in the thermal storage tank. With given initial temperature conditions, weather conditions and demand data, Eqs. (1) – (3) and the two effectiveness-NTU equations are solved iteratively in MATLAB with a time step of an hour over the whole year.
The economic performance of the system is assessed in terms of payback time (PBT) and levelized cost of energy (LCOE) based on the investment cost, operational and maintenance costs, and cost saving due to displaced natural gas and grid electricity consumption and the revenue of exported electricity. The annual cost saving, 𝐶s, is calculated by,
𝐶s= 𝐸cov∙ 𝑐e+ 𝐸exp∙ 𝑠e+𝑄cov
𝜂boil𝑐ng− 𝐶O&M (4)
where 𝐸cov and 𝑄cov are the annual electrical and thermal energy demands covered by the system in
kWh, 𝐸exp the annual electricity exported to the grid in kWh, 𝑐e and 𝑐ng the prices of electricity (0.205 €/kWh) and natural gas (0.056 €/kWh), respectively, 𝜂boil the boiler efficiency (0.8), 𝑠e the electricity price for the net metering option applicable to the system (0.103 €/kWh), and 𝐶O&M the operation and maintenance (O&M) costs. The above prices correspond to the local energy prices of the greenhouses. The cost models of the PVT S-CHP system are given in Table 1. The payback time, PBT, is found from,
𝑃𝐵𝑇 =ln[ 𝐶0(𝑖F−𝑑)
𝐶s +1]
ln(1+𝑖F1+𝑑) (5)
where d is the discount rate (2.8%) and iF the inflation rate (1.2%) assumed for the annual fuel savings. Finally, the levelized cost of energy, LCOE, is defined as,
𝐿𝐶𝑂𝐸 =𝐶0+∑𝑛𝑖=1𝐶O&M(1+𝑖F)𝑖−1(1+𝑑)−𝑖
∑𝑛 𝑄(1+𝑑)−𝑖
𝑖=1 (6)
where Q is the net annual production of energy in the form of electricity. As both thermal energy and PVT collectors Pump DC AC Inverter
Thermal storage tank Greenhouse
Return water
Hot water Grid
(a)
. . .
electricity are provided from the PVT system, a conversion factor of 0.55 is used from thermal energy to electricity, which corresponds to the typical efficiency of a natural gas power plant [29]. The lifetime n is assumed as 25 years. The annual CO2 emission reduction by the PVT S-CHP system is also estimated using the current CO2 emission factors in Italy. The ICE-CHP system currently operating in the greenhouses is used as a baseline case for comparison. Measured energetic data and the costs of the ICE-CHP system quoted from the manufacturer are used to derive its thermoeconomic metrics.
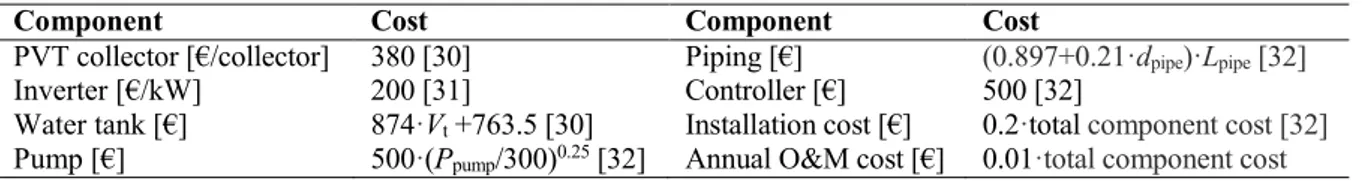
Table 1. Cost models for the PVT S-CHP system.
Component Cost Component Cost
PVT collector [€/collector] 380 [30] Piping [€] (0.897+0.21·dpipe)·Lpipe [32]
Inverter [€/kW] 200 [31] Controller [€] 500 [32]
Water tank [€] 874·Vt +763.5 [30] Installation cost [€] 0.2·total component cost [32]
Pump [€] 500·(Ppump/300)0.25 [32] Annual O&M cost [€] 0.01·total component cost 4. Results and discussion
The PVT collectors are installed with a title angle of 35° orientated to the south, and the dimension of a single collector is 1.61 m×0.958 m.The calculated thermal and electrical efficiencies, 𝜂t and 𝜂e, of the PVT collectors under the standard operational condition are,
𝜂t= 0.664 − 5.41 ∙ 𝑇r− 0.021 ∙ 𝐺 ∙ 𝑇r (7) 𝜂e= 0.15 ∙ [1 − 0.0045 ∙ (𝑇PV− 𝑇a)] (8) where 𝑇r, 𝑇PV, 𝑇a and 𝐺 are the reduced temperature, PV cell temperature, ambient temperature and solar
irradiance. The reduced temperature is defined by (𝑇fluid− 𝑇a)/𝐺, where 𝑇fluid is the average fluid temperature of the collector. The PVT S-CHP system is sized to ensure that most of the energy demands of the greenhouses can be met, i.e., more than 70% of the annual demand. By fulfilling this target, the installation area of the PVT collectors is selected as 30,000 m2 for this application. The volume of the thermal storage tank is sized by using a ratio of 50 l per unit area of installed collectors [30,33].
Figure 2 shows the changes of the thermal and electrical efficiencies of the PVT collectors in two representative periods of the year, i.e., 5 days in January and in June. It is observed that the electrical efficiency is noticeably lower when the solar radiation is high, especially in middays in June when the efficiency has a remarkable drop. This is because that the cell temperature is higher at high solar radiation conditions. Besides, as shown in Figure 1(b), the thermal energy demand in June is significantly lower than that in January, and thus the water in the thermal storage tank is at much higher temperatures, leading to significant increases of cell temperature in middays when the water is circulated. The thermal efficiency in January is remarkably higher than that in June, due to the lower operating temperatures and lower heat losses. It should be noted that although the solar irradiance is much higher in June, the collected thermal energy is found to be even lower, as the thermal storage tank is at high temperatures and the water circulation pump is turned off for most of the time. This implies that the thermal performance of the PVT system is highly dependent on the thermal demand. Due to the low thermal demand in summer (see Figure 1(b)), a lot of solar heat during summer exceeds the demand and it is not actually used. In order to improve the global energy performance of the system, other technologies could be integrated in future researches, such as biomass drying or solar cooling.
Figure 2. Solar irradiance, thermal efficiency and electrical efficiency of the PVT-CHP system during the period: (a) 1 January to 5 January, and (b) 20 June to 25 June.
Figure 3 shows the monthly energy demands and coverages. The proposed PVT S-CHP is able to provide a significantly fraction of the thermal demand (Qdem). The coverage ratio is higher than 50% for all the months, especially from March to November when it is higher than 73%, as shown in Figure 3(a). Compared to the thermal demand, the electrical demand (Pdem) in most periods of the year is very low and thus abundant excess electricity is exported to the grid (Pexp), as shown in Figure 3(b). From June to September, most of the electrical output is consumed for greenhouse cooling.
Figure 3. Monthly demands and coverages of: (a) thermal energy, and (b) electricity.
Table 2 summarizes the performance metrics of the PVT S-CHP system based on the annual simulation. The results of the ICE-CHP system, which is currently used in the greenhouses, is also presented as a baseline case. The annual coverage ratio for thermal demand is up to 73% for the PVT S-CHP system, compared to 92% of the ICE system. The annual net electrical output of the PVT S-CHP is 2.6 times the total electrical demand, and it is about 2 times for the ICE-CHP system. For the PVT system, as most of the generated electricity is exported to the grid, the electricity instantly consumed in the greenhouses accounts for 72% of the total annual electricity demand. In the current operation scenario of the ICE-CHP system, all the electrical output is exported to the grid, which together with the high fuel costs of the ICEs affects the annual cost saving, i.e., only 14% of the total energy cost is avoided. For the PVT system, although the total energy output is at a similar level as that of the ICE system, its zero fuel cost makes the annual cost saving significantly higher, i.e., all of the total energy cost can be covered along with an extra 7% revenue. The payback time of the PVT system is longer than that of the ICE system (10.4 years vs. 8.4 years), but the levelized cost of energy is much lower due to the higher annual cost saving (0.076 €/kWh vs. 0.132 €/kWh). The emission reduction assessment shows that the PVT S-CHP system has a potential to reduce the emission by 3010 tCO2/year, which is more than 35 times higher than that of the ICE-CHP system. These results show that the proposed PVT S-CHP has a good technoeconomic potential for the investigated greenhouse application in terms of energetic, economic and environmental metrics. One of the limitations of this solution is the land occupancy, since 3 ha of agricultural land should be diverted to allocate the proposed S-CHP plant, and this implies socioeconomic and environmental issues that should be properly addressed.
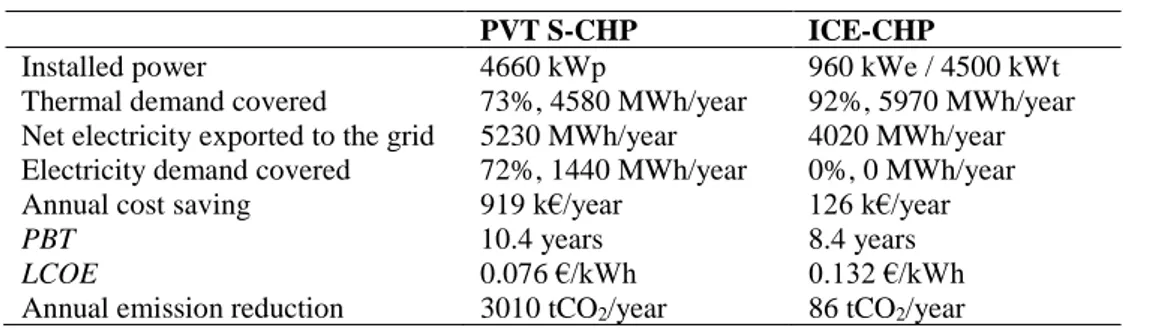
Table 2. Energetic, economic and environmental results of PVT S-CHP system and ICE-CHP system.
PVT S-CHP ICE-CHP
Installed power 4660 kWp 960 kWe / 4500 kWt
Thermal demand covered 73%, 4580 MWh/year 92%, 5970 MWh/year
Net electricity exported to the grid 5230 MWh/year 4020 MWh/year
Electricity demand covered 72%, 1440 MWh/year 0%, 0 MWh/year
Annual cost saving 919 k€/year 126 k€/year
PBT 10.4 years 8.4 years
LCOE 0.076 €/kWh 0.132 €/kWh
Annual emission reduction 3010 tCO2/year 86 tCO2/year
5. Conclusion
A technoeconomic analysis has been conducted of a PVT S-CHP system in a distributed cogeneration application in which heat and power are supplied to a greenhouse tomato-farm in Bari, Italy. Both heating and electricity are needed to maintain optimal indoor conditions for crop growth, which are currently met by an ICE-CHP system, together with an auxiliary gas boiler and electricity from the grid. A transient model has been developed for the PVT S-CHP system, which is able to predict the performance and
assess operational strategies. Annual simulation results show that, with an installation area of 30,000 m2, the proposed system is able to provide a significant fraction of the thermal demand, i.e., >50% for all months and >70% from March to November. The annual generated thermal energy by amounts to 73% of the total onsite thermal demand, compared to a 92% coverage by the equivalent ICE system. In addition, the annual net electrical output of the system amounts to 2.6 times that of the total onsite electrical demand, compared to about 2 times for the ICE system. As the operation of the PVT system is associated with zero fuel costs, its annual cost saving is significantly higher than that of the ICE system. Specifically, the total annual cost saving of the PVT system is more than 6 times higher than that of the ICE equivalent. Furthermore, the payback time of the PVT system is not significantly longer than that of the ICE system (10.4 years vs. 8.4 years), while its levelized cost of energy is much lower due to the higher annual cost saving (0.076 €/kWh vs. 0.132 €/kWh). Finally, emission reduction estimates show that 3010tons of CO2 emissions per year can be abated by such a PVT S-CHP system, which is 35 times higher than that of the ICE alternative. This work suggests that PVT S-CHP systems have an excellent technoeconomic potential in the proposed greenhouse application, and can be competitive over conventional fossil-fuel based CHP systems in terms of energetic, economic and also environmental metrics.
6. Acknowledgment
This work was supported by the UK Engineering and Physical Sciences Research Council (EPSRC) [grant number EP/M025012/1]. The authors would also like to thank UK company Solar Flow (www.solar-flow.co.uk). Data supporting this publication can be obtained on request from [email protected]. 7. References
[1] Wang TY, et al. 2017 Renew. Sust. Energy Rev. 70 1178 [2] Aljubury IMA and Ridha HD 2017 Renew. Energy 111 321
[3] Chau J, Sowlati T, Sokhansanj S, Preto F, Melin S and Bi X 2009 Appl. Energy 86 364 [4] Marucci A and Cappuccini A 2016 Appl. Energy. 170 362
[5] Barbera E, Sforza E, Vecchiato L and Bertucco A 2017 Energy 140 116
[6] Allardyce CS, Fankhauser C, Zakeeruddin SM, Gratzel M and Dyson PJ 2017 Sol. Energy 155 517 [7] Trypanagnostopoulos G, Kavga A, Souliotis M and Tripanagnostopoulos Y 2017 Renew. Energy 111 724 [8] Yildirim N and Bilir L 2017 Energy Convers. Manage. 148 1278
[9] Russo G, Anifantis AS, Verdiani G, Scarascia Mugnozza G 2014 Biosys. Eng. 127 11 [10] Blanco I, Pascuzzi S, Anifantis AS, Scarascia Mugnozza G 2014 J. Agric. Eng. 45 111 [11] Anifantis AS, Pascuzzi S, Scarascia Mugnozza G 2016 J. Agric. Eng. 47 164
[12] Ramos A, et al. 2017 Briefing paper No 22, Grantham Institute Imperial College London p.1-9. [13] Hassanien RHE, Li M and Tang YL 2018 Energy Buildings 169 305
[14] Joudi KA and Farhan AA 2014 Renew. Energy 72 406
[15] Gourdo L, Fatnassi H, Tiskatine R, Wifaya A, Demrati H, Aharoune A, et al. 2019 Energy 169 206 [16] Ghosh A and Ganguly A 2017 Sol. Energy 158 644
[17] Herrando M, Markides CN and Hellgardt K 2014 Appl. Energy 122 288
[18] Guarracino I, Freeman J, Ramos A, Kalogirou SA, Ekins-Daukes NJ, Markides CN 2019 Appl. Energy 240 1014 [19] Ramos A, Chatzopoulou MA, Guarracino I, Freeman J, Markides CN 2017 Energy Conver. Manag. 150 838 [20] Wang K, Herrando M, Pantaleo AM and Markides CN 2019 Energy Procedia 158 1229
[21] Herrando M and Markides CN 2016 Appl. Energy 161 512
[22] Wang K, Herrando M, Pantaleo AM, Markides CN 2018 8th Heat Powered Cycles Conf. Bayreuth, Germany [23] Mellor A, et al. 2018 Sol. Energy 174 386
[24] Herrando M, Pantaleo AM, Wang K and Markides CN 2019 Renew. Energy 143 637 [25] Mahdavi S, Sarhaddi F and Hedayatizadeh M 2019 Appl. Therm. Eng. 149 996 [26] Nayak S and Tiwari GN 2008 Energy Buildings 40 2015
[27] Hussain MI, Ali A and Lee GH 2016 Sol. Energy 135 719
[28] Guarracino I, Mellor A, Ekins-Daukes NJ and Markides CN 2016 Appl. Therm. Eng. 101 778 [29] Gas Fired Power Plants, IEA Energy Technology Systems Analysis Programme - Technology Brief E02
<https://iea-etsap.org/E-TechDS/PDF/E02-gas_fired_power-GS-AD-gct_final.pdf> (accessed 11/01/2019) [30] Herrando M, Ramos A, Freeman J, Zabalza I and Markides CN 2018 Energy Convers. Manage. 175 67 [31] Petrollese M and Cocco D 2016 Sol. Energy 137 477
[32] Quoilin S, Declaye S, Tchanche BF and Lemort V 2011 Appl. Therm. Eng. 31 2885 [33] Calise F, d'Accadia MD and Vanoli L 2012 Energy Convers. Manage. 60 214