107
The concentration of Health research and
innovation across EU regions
♦di Claudio Cozza
∗e Monica Plechero
°Abstract
Health research and innovation (R&I) is attracting the attention of EU, national and regional poli-cymakers. As Health policies are becoming a public policy priority – targeting not only social needs but also the overall economic development of EU countries – Health R&I have been identi-fied as key areas of investment. However, despite the attempts to reduce inequalities also in this field, a strong concentration of Health R&I across EU regions still exists. The paper provides recent and novel empirical evidence on the topic, describing the concentration of Health patents, publica-tions and EU project participation in top EU regions. Regional data help in assessing that, also in the Health sector, concentration is not only a cross-country but also a within-country issue.
Keywords: EU regions, Research, Health. JEL classification: O33, R12.
La concentrazione delle attività di innovazione e ricerca sanitaria
nelle regioni UE
Sommario
La ricerca e innovazione (R&I) nel settore della salute sta attraendo sempre più l’attenzione dei poli-cymaker nazionali, regionali ed europei, divenendo un’area strategica di investimento. Le politiche sulla salute sono infatti una priorità pubblica che ha come target non solo i bisogni sociali ma anche lo sviluppo economico nei paesi UE. Sebbene ci siano vari tentativi di ridurre le disuguaglianze all’interno della comunità europea, in questo settore esiste ancora una forte concentrazione in alcune aree rispetto ad altre. L’articolo fornisce nuove e recenti evidenze empiriche sull’argomento mo-strando come la diversa distribuzione di attività brevettuali, pubblicazioni e partecipazione a progetti di ricerca non è solo divergente fra paesi ma anche fra regioni appartenenti ai singoli paesi UE.
Parole chiave: regioni UE, Ricerca, Salute. Classificazione JEL: O33, R12.
♦
This work was supported by European Commission [Grant Agreement No 643574] under the European Union Horizon 2020.
∗ Istituto Ricerche, AREA Science Park, Trieste (IT), [email protected]. ° DISEI, Università degli Studi di Firenze, Firenze (IT), [email protected].
108
Introduction
Over the last years, European policymakers – both at the national and at the sub-national level – have widened their perspective regarding Health. From the generic attention to EU citizens’ healthcare, the focus has shifted towards a more complex framework where Health is an increasingly crucial social need. Already in 2007 with the white paper “Together for Health” (EC, 2007), the European Commission has identified the most crucial chal-lenges regarding Health in its area: the increase in chronic diseases, the growing technological costs to face Health challenges and especially an ageing population. The consideration of those issues has then been included in the wider Europe 2020 Strategy (EC, 2013a), where two additional poli-cy points have been highlighted:
• Despite a generic increase in health conditions across EU countries, also an increase in inequality can be detected: «poorer and disadvantaged people die younger and suffer more often from disability and disease». • As a consequence, the concept of “investing in Health” has to be further
developed.
Indeed, such a shift in the analytical viewpoint, where Health policies should represent even more than in the past, a pivotal asset for the growth and cohesion of world society, can be found in other policy documents. As stated by the OECD (2014, p.9), «European countries have achieved signif-icant gains in population health, but there remain large inequalities in health status both across and within countries». The efforts made by EU governments are reflected in several recent indicators: Health represents the second most important budget line in EU countries; overall the 73% of Health expenditures is funded by the public sector; and one employee out of 10 works in this sector. Therefore, especially in a EU society where life expectancy constantly grows, investing in Health has to be considered a compulsory task for achieving economic prosperity and social cohesion.
Following this logic, Health is no more intended as a simple value in it-self and it is becoming a public policy priority in the EU. For this reason, it is more and more important to focus on the economic aspects of Health. In-vesting in the efficiency of Health system and especially on prevention will bring also increases in work productivity and will reduce social inequali-ties. This is especially true when looking at poorer areas and performing an economic analysis at the sub-national level (Purohit, 2016). Furthermore, local public policies are to provide adequate Health services (Williams,
109
2017), which imply investments in Health Research and Innovation (R&I). Such goals are strictly related to the capability of R&I actors to make sub-stantial advancements in the field (Intereconomics Forum, 2015). Not by chance, Health (together with Demographic change and Well-being) is one of the societal challenges of the EU Horizon 2020 research programme. Health goals are, therefore, intrinsically contained in the EU R&I strategy.
Given the cumulative nature of R&I assets, however, EU countries and especially EU regions are expected to perform very differently. Even more than in general terms, the convergence of EU countries and regions in R&I has to be achieved with strong policy tools (Goecke & Hüther, 2016). Not by chance, then, the EU Horizon 2020 Programme addresses the inequali-ties in the field of Health R&I, in order to find the right policy measures to reduce the gap among EU countries and regions. Such a gap might be par-ticularly significant in the Health R&I domain, thus implying a minor ca-pacity of some national and/or regional Health systems to respond ade-quately to societal contextual needs. Following the approach mentioned above, less R&I in Health systems might lead to the worsening of the work and social conditions of some EU areas.
The key role of Health is also confirmed by the fact that it is one of the most recurrent priorities for EU regions’ smart specialization strategies (S3, see Sörvik & Kleibrink, 2015). Indeed regions in almost all EU countries claim Health as their S3 priority. However, different regions might refer to specific – and very different – sub-areas of Health, targeting it from very different perspectives. That is, for instance, referring to Health when deal-ing with the Pharmaceuticals, Biotech or Medical technology sectors, even-tually key in their territory; or simply when dealing with their ageing popu-lation; or maybe meaning the introduction in their systems of healthcare in-novations, such as e-Health.
To tackle such a challenging perspective, a deeper knowledge about the availability and quality of Health indicators across is needed. While the World Health Organisation (WHO) European regional office has developed an extensive exercise for developing adequate healthcare indicators (WHO, 2012), measures of Health R&I in Europe are very scarce. We claim that such limited evidence is in contradiction with the idea of smarter invest-ments in Health and might eventually bring to incorrect policy decisions in EU countries and regions. In particular, a poor knowledge about Health R&I performances and the use of inadequate indicators in Europe might
110
hide the real inequalities in the sector, thus extending instead of reducing the gap between top and least performing countries.
This paper aims at better understanding Health R&I inequalities, includ-ing their technological and economic dimensions, in Europe. It is structured as follows: in section 2 we report the main data limitations and the method-ological problems in mapping Health R&I in the EU; in section 3, using novel data, we provide an overview of the current situation in EU Health R&I, showing the concentration and polarisation across countries and re-gions; in section 4 we provide some conclusions and policy remarks.
1. The (limited) mapping of Health R&I in the EU
The difficulty in measuring Health R&I is intrinsically related to its def-inition. Considering the most relevant measure – that is Health R&D – a warning comes from an OECD report related to R&D in Health (OECD, 2001). It is there stated that «in the widest sense we are interested in all R&D which is relevant to human health. Here there are no generally ac-cepted international definitions or guidelines on coverage. There are few (if any) areas of investigations which can “logically” be excluded from possible relevance to health – perhaps cosmology». To overcome such a problem, the WHO in 2013 organised an “Informal workshop on monitor-ing financial flows in support of health research & development”. This workshop has reinforced, in particular, the idea of overcoming the limita-tions of data availability for Health R&D. Following the WHO workshop, the newly-born Global Observatory for Health R&D by OECD and WHO has already started to work on better indicators for measuring Health R&D1. First results of the Observatory have led to estimations of Health
R&D and clinical trials provided for all world countries in a recent Lancet
1 The idea behind this Global Observatory is to monitor and analyze relevant
infor-mation on Health R&D, building on national and regional observatories (or equivalent func-tions) and existing global data collection mechanisms with a view to contributing to the identification of gaps and opportunities for health R&D.
111
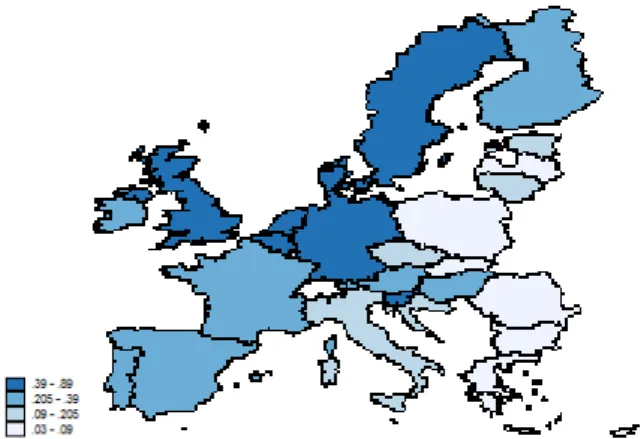
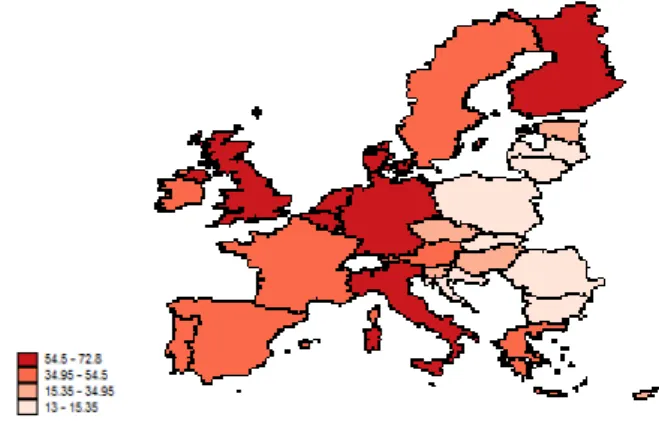
publication (Røttingen et al., 2013). Such estimations confirm the high de-gree of concentration in the EU. As shown in figure 1, the highest shares of expenditure in Health R&D on GDP are detected for most technologically advanced EU countries, including Sweden, Denmark, UK and central EU countries such as Germany, Netherlands and Belgium. With the notable ex-ception of Slovenia and partially Hungary, the least performing countries belong to Eastern Europe. However, according to the Observatory itself, a lot of work still remains to be done in order to provide stakeholders with the best information to monitor and assess Health R&I in all countries and regions.
Fig. 1 – Health R&D (as a percentage of GDP) in EU countries
Source: Own elaboration on Røttingen et al. (2013). Year: 2010 or latest available year. For mapping Health R&I, there are also other methodological problems. On the one side, this is related to the complexity and specificity of the sec-tor: Health includes manufacturing (e.g. the pharmaceuticals) and services (e.g. the hospitals) activities; it includes very strong investment both by the public and by the private bodies; it relies on strong propriety protection for some technological aspects, while it implies the full accessibility of knowledge for others; it affects both the macro level (the society as a whole) and the micro level (companies, professionals, individual citizens). On the other side, then, there is a more practical problem related to the in-stitutional level at which the policies decisions are taken: while Health pol-icies often involve decisions at the NUTS2 regional level (e.g. using EU
112
Structural Funds, see EC, 2015), many indicators which should sustain the decision processes only exist at the country level.
In fact, the joint analysis of R&I figures at the NUTS2 regional and sectorial (Health) level is not straightforward. Usually the deepening of one dimension (i.e. the regional one) excludes that of the other one (the sectorial). Indeed the most important publication on the innovativeness of EU regions (that is the Re-gional Innovation Scoreboard) does not fully cover any specific sector. Region-al/sectorial analyses are usually included in case studies or in reports covering one country only or other limited breakdowns (EC, 2013b). Providing ad ade-quate map of Health R&I in all NUTS2 regions has been therefore one of the main point of a Horizon 2020 project, aimed at filling in the informative gap in terms of Health at the regional level, in the EU2.
2. An overview of the concentration and disparities of Health
R&I in Europe
The mapping of Health R&I has been undertaken selecting the most com-mon indicators in the economics of innovation (Smith, 2005): scientific publications and patent applications. Although it is arguable that both indi-cators concern more research than innovation, also in the Health sector, it is clear that they catch two different aspects of the R&I process. It is in fact expected that publications reflect more the public sector involvement, while patents are closer to the private engagement in R&I (Callon, 1994). Alt-hough this distinction has not to be intended as normative, regional data on Health patents and publications give a confirmation of it. In table 1 we show the correlation coefficients between regional Health outcomes
(pa-2 The project "European regions network for Health Research & Innovation", funded by the
Horizon 2020, having as main goal to propose new initiatives and concrete approaches to EU, na-tional and regional decision-makers in Health to: i) reduce the gaps in Health R&I across the EU regions, ii) to increase the participation in Horizon 2020, and iii) to facilitate synergies between Horizon 2020 (H2020) and European Structural & Investment Funds (ESIFs).
113
tents and publications) and the breakdown of the main innovation input variable, that is R&D expenditure. The breakdown allows to identify the share of R&D performed in each region by the three main sectors: business, government and higher education (BERD, GOVERD and HERD respec-tively). In table 1 it is clearly shown as the business sector has a higher cor-relation coefficient with patents, while the government sector with publica-tions. Intermediate values come out for the higher education sector, and this reflects the specificity of universities for which both outcomes are relevant. Tab. 1 – Correlation between R&D inputs and outputs
BERD (business expenditure in R&D), GOVERD (government expenditure in R&D) and HERD (high-er educational R&D expenditure) ref(high-ers to year 2011 because of bett(high-er data quality with respect to pre-vious years. Correlations are significant at 1% level.
In figures 2 and 3 we show the results of the mapping. The maps show a clear concentration of Health R&I in a limited number of countries and regions. Northern EU countries always show the highest performances, although the two maps do not perfectly coincide. Only four countries (Denmark, Ireland, the Netherlands and Sweden) rank at the top in both indicators, suggesting that spe-cialisation in the sector might be more relevant than the size of the national economies. In fact, several large EU countries only rank in the second quartile, in either one indicator or both. As expected, the almost totality of least performing countries are Eastern EU ones, confirming their urgent need to fill in the gap with the rest of Europe. Not by chance, policy instruments3 at the EU level have
3 The definition of Widening countries, which are currently devoted special attention
and resources (e.g. a dedicated budget of the Horizon 2020 programme), can be found in EC, 2015, or at: https://ec.europa.eu/programmes/horizon2020/en/h2020-section/spreading-excellence-and-widening-participation) R&D expenditure Health Patents (2008-2010) Health Publications (2008-2012) BERD R&D 0.7906* 0.6039* GOVERD R&D 0.6829* 0.7089* HERD 0.7488* 0.9074*
114
been recently adopted to tackle the issue and try to help catching-up countries in R&I.
Fig. 2 – Health publications and patents in EU-28 countries, by population
Scientific publications EPO patent applications
Source: Own elaboration on European Commission – DG Research data. Patents and pub-lications have been classified by FP7 Health thematic priority. Year: average 2008-2012 for publication, average 2008-2010 for patents. Colours reflect the quartiles.
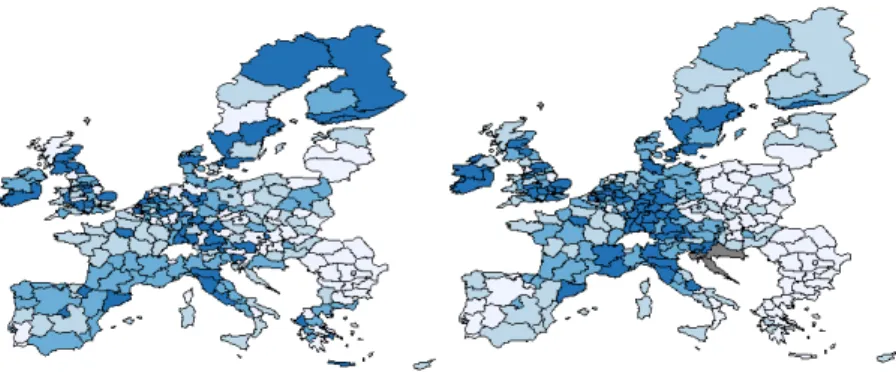
Fig. 3 – Health publications and patents in EU-28 regions, by population
Scientific publications EPO patent applications
Source: Own elaboration on European Commission – DG Research data. Patents and pub-lications have been classified by FP7 Health thematic priority. Year: average 2008-2012 for publication, average 2008-2010 for patents. Colours reflect the quartiles. Grey colour refers to missing data.
115
However, what emerges by looking at regional maps is that concentra-tion is not only a cross-countries matter. Indeed, in almost all countries there is a high polarisation of regions in terms of Health R&I outcomes. If we look at regional publications, we can observe that almost all countries have at least one top region, either belonging to the first quartile (mostly in the case of Western EU countries) or to the second one (especially for East-ern EU ones). It is instead in the case of patent applications that the cross-country and within-cross-country polarisations tend to coincide: top regions are almost all located in Central Europe (including Germany, BENELUX but also parts of France and Northern Italy) and in Northern countries (Ireland, UK and Scandinavian ones). In other words, the regional patent map strongly reflects the industrialisation of EU countries and its already known concentration. While, concerning scientific publications, a more “democrat-ic” spread of the indicator might suggest a positive role of public and high-er education sectors engagement in Health R&I.
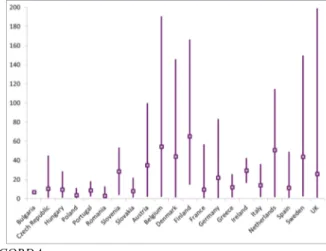
The cross- and within-countries polarisation is then appearing also in the main indicators of the funding of Health R&I. Figure 4 shows the distribu-tion of FP7 Health project participants (in the whole 2007-2013 period). Again, Western EU countries show both the highest average values but also a great disparity between their top and least performing regions. In the group of Widening countries mentioned above, only Slovenia and Czech Republic show performances in line with some of the non-Widening ones. Fig. 4 – Regional dispersion of FP7 Health projects participation, per million population: average, minimum and maximum values.
116
Such a figure helps in better understanding the real extent of concentra-tion in European Health R&I. In fact, couples of countries with a very simi-lar average can have a completely different situation behind. We make some examples. A good performing country as the Netherlands has a higher average than Denmark; however, the top Danish region achieves a maxi-mum score of more than 140 projects per million population, while the top Dutch one does not go beyond 120. Even more, the top region in Europe (London) belongs to a country (UK) whose average is not particularly high. Then, a low performing country in terms of average, that is the Czech Re-public, shows a top region that is in line with countries with higher averag-es (e.g. Slovenia and Ireland) and even above large countriaverag-es (e.g. Italy).
Of course, having a low average might signal the strong unbalances that exist in some EU countries. Indeed, many countries have just one or two spots of better performance, as compared to a very poor environment in the rest of their territories. The joint analysis of the national and the NUTS2 regional level, then, is even more needed to depict the concentration and unbalances of Health R&I, in both top and least performing countries.
The figures shown confirm the idea that less performing regions and countries might need to catch-up and reinforce their R&I performance. As already mentioned, in the Horizon 2020 there is a small share of the overall budget dedicated to Widening countries, including all Eastern countries plus Luxembourg and Portugal. The definition of Widening country fol-lows the EC approach of measuring in a synthetic way the outcomes of the R&I process, as well as its excellence. Indeed the definition derives from the composite indicator of Research Excellence, put forward in a EC-JRC report (2013) which aims at measuring research excellence in Europe, at country level, from a multiple point of view. The (top) quality of scientific and technological outputs concerns four different typologies of research ac-tivities: highly-cited publications; high-quality patent applications; quality of universities and research institutes; and capacity to receive prestigious grants such as the ERC ones.
This indicator has not only an intrinsic motivation that is to quantify al-together the different dimensions of research excellence. From a policy per-spective, the indicator provides a synthetic overview of R&I to better un-derstand which European countries are less performing and therefore in need of specific policy support. Not by chance, Widening countries are those below the 70% of the EU average.
117
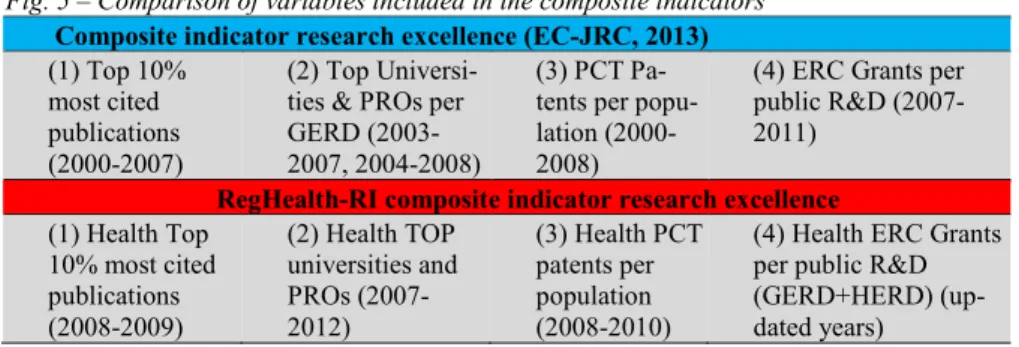
In the framework of the RegHealth-RI project, an attempt has been made to replicate the EC-JRC indicator for the Health sector, with minor adaptations. Unfortunately, the regionalisation of this indicator – that we consider very important for policy support reasons – is not measurable for strong lack of data4. At the national level, the Health Research Excellence
indicator has been calculated as shown in figure 5, where it is also com-pared to the original EC-JRC one.
Fig. 5 – Comparison of variables included in the composite indicators
Composite indicator research excellence (EC-JRC, 2013)
(1) Top 10% most cited publications (2000-2007)
(2) Top Universi-ties & PROs per GERD (2003-2007, 2004-2008)
(3) PCT Pa-tents per popu-lation (2000-2008)
(4) ERC Grants per public R&D (2007-2011)
RegHealth-RI composite indicator research excellence
(1) Health Top 10% most cited publications (2008-2009) (2) Health TOP universities and PROs (2007-2012) (3) Health PCT patents per population (2008-2010)
(4) Health ERC Grants per public R&D (GERD+HERD) (up-dated years)
The intensity of the Health Research Excellence indicator is displayed, for all EU countries, in figure 6, where again the four colours represent the quartiles of the distribution.
Although the composite indicator of Health research excellence at coun-try level appears similar to the EC-JRC one, important differences emerge. For some top performing countries, the Health indicator inverts the overall ranking: Italy goes up from the second to the first quartile, while for Swe-den the opposite happens. Overall, the predominance of Nordic and Cen-tral-Western EU countries is confirmed. The last quartile includes only Eastern European countries.
4 To make an example, the lack of information of most cited publications in Health
available for all regions. Moreover, given the problematic issues identified also at the na-tional level for some variables, the risk of calculating a regional indicator was to increase even more its unreliability.
118
Fig. 6 – RegHealth-RI project Composite Indicator of Health Research Excellence
Source: Own elaboration on RegHealth-RI data
All in all, we can observe that such a picture almost overlaps with those of figure 2. This is not surprising, as it merges similar information that we have presented there and similar to those in figure 4. In other words, we be-lieve that such a composite indicator might hide two levels of differences: • The specific performance of single countries in one indicator (e.g.
pub-lications or patents or EU project participation);
• The within-countries regional polarisation, as we have shown in figures 3 and 4.
In practical terms, it is suggested that for those widening regions with low levels of scientific outcomes (health publications) public policies should be aimed at developing local competences. A direct objective might be that of increasing the share of highly educated workers on total popula-tion. Vice versa, those widening regions with good scientific performance but that show low performances in terms of health patents , it is suggested to introduce more policies aimed at the networking with partners from ad-vanced regions with stronger innovation capabilities, possibly via public-private partnerships.
Therefore, from a policy perspective we suggest that a deeper and de-tailed analyses of R&I variables can be more useful than a synthetic picture of the overall phenomenon. Detailed analyses can better inform national and regional policymakers about their specific (e.g. regional & sectorial) strengths and weaknesses, to adopt the most suitable policies. One of the aims of the Horizon 2020 project from which this paper originated was to provide a sectoral and regional breakdown of health R&I variables. The
119
first descriptive outcomes have been presented in this paper. At the mo-ment, data do not allow further analyses, as most of variables are still avail-able at the regional or at the sectoral level alternatively. To proceed with detailed analyses suggested here, it is recommended that additional evi-dence, especially on the input side of health R&I, is gathered. The prelimi-nary outcomes of this paper suggest that this analytical direction can be fruitful, as it allows to better target innovation policies. Not only distin-guishing between top and least performing regions, but also differentiating different types of regions within these two categories.
Conclusions
In this paper, we have shown the degree of concentration of Health R&I in EU countries and regions. Being R&I more and more key in shaping EU Health policies, shifting from the pure measure of healthcare to a wider concept of “investing in Health”, we believe this mapping is of great value. This is particularly relevant for less performing countries (so called Widening) that have and deserve dedicated funding and resources. In fact, their R&I per-formances are still very far from that of most advanced EU countries.
However, we also suggest that such a Widening definition based on composite indicators (EC-JRC, 2013) might be misleading and a wider ana-lytical approach should be followed. Being Health, on the one side, and R&I, on the other side, increasingly key issues for EU policy.
In addition, given the growing relevance of policies at the regional level, also in the framework of Smart Specialisation Strategies, there is the need of improving measures of regional & sectorial Health R&I. In fact, these sub-national measures might catch specific Health activities and subsectors which singularly or jointly may contribute to the development of some re-gions, better than standard classifications (e.g. NACE codes). Regional data remain also crucial to identify whether the polarisation of R&I outcomes happens even within countries, also the most developed ones.
References
Callon, M. (1994). Is science a public good? Science, Technology & Human Values, 19(4), 395 – 424. Doi: 10.1177/016224399401900401
120
European Commission (2007). White Paper ‘Together for Health: A Strategic Approach for the EU 2008-2013.
European Commission (2013a). Investing in Health. Commission Staff Working Document. European Commission (2013b). Cross-Cutting Analysis of Scientific Publications versus
Other Science, Technology and Innovation Indicators.
European Commission - Joint Research Centre (2013). An analysis of national research sys-tems (I): a composite indicator measuring scientific and technological research excel-lence, JRC Scientific and Policy Reports.
European Commission (2015). Spreading Excellence and Widening Participation, Work Programme 2016-2017.
Goecke, H. & Hüther, M. (2016). Regional Convergence in Europe, Intereconomics, 51(3), 165–171. Doi:10.1007/s10272-016-0595-x
Intereconomics Forum (2015). The impact of Horizon 2020 on Innovation in Europe. In-tereconomics, Vol. 50, No. 1.
OECD (2001). Measuring Expenditure on Health-related R&D. OECD (2014). Health at a Glance: Europe 2014.
Purohit, B. C. (2016). Health care system efficiency: a sub-state level analysis for Orissa (India). Review of Urban & Regional Development Studies, 28(1), 55-74. Doi: 10.1111/rurd.12044.
Røttingen, J. A., Regmi, S., Eide, M., Young, A. J., Viergever, R. F., Årdal, C., Terry, R. F. (2013). Mapping of available health research and development data: what's there, what's missing, and what role is there for a global observatory?. The Lancet, 382(9900), 1286-1307. Doi: 10.1016/S0140-6736(13)61046-6.
Smith, K. (2005). Measuring Innovation. In J. Fagerberg, D. C. Mowery, R. R. Nelson (Eds.), The Oxford Handbook of Innovation, Oxford, Oxford University Press.
Sörvik, J. & Kleibrink A. (2015). Mapping innovation Priorities and Specialisation Patterns in Europe, S3 Working Paper Series, JRC Technical Reports – IPTS, No. 8, 2015. WHO (2012). The evidence base of Health 2020.
Williams, G. (2017). Enhancing the value of health care services at regional level. Review of Urban & Regional Development Studies, 29(1), 46–62. doi:10.1111/rurd.12058.