A bibliometric analysis of scientific production on atypical
antipsychotic drugs from Italy
Un’analisi bibliometrica della produzione scientifica sui farmaci antipsicotici
atipici in Italia
FRANCISCO LÓPEZ-MUÑOZ1,2,3*, DOMENICO DE BERARDIS4,5, MICHELE FORNARO6,7, FEDERICA VELLANTE5, MASSIMO DI GIANNANTONIO5, FRANCISCO J. POVEDANO-MONTERO1,
MARIA PÓVEDA FERNÁNDEZ-MARTÍN1, GABRIEL RUBIO2,8, CECILIO ÁLAMO9 *E-mails: [email protected]; [email protected]
1Faculty of Health Sciences, Camilo José Cela University, Madrid, Spain
2Neuropsychopharmacology Unit, Hospital 12 de Octubre Research Institute (i+12), Madrid, Spain
3Portucalense Institute of Neuropsychology and Cognitive and Behavioural Neurosciences (INPP), Portucalense University, Porto, Portugal 4NHS, Department of Mental Health, Psychiatric Service of Diagnosis and Treatment, Hospital “G. Mazzini”, ASL 4, Teramo, Italy
5Department of Neurosciences and Imaging and Clinical Sciences, University “G. D’Annunzio”, Chieti, Italy 6Department of Psychiatry, Federico II University of Naples, Naples, Italy
7New York State Psychiatric Institute (NYSPI), Columbia University, NYC, NY, USA
8Department of Psychiatry, “Doce de Octubre” University Hospital, Complutense University, Madrid, Spain 9Department of Biomedical Sciences (Pharmacology Area), Faculty of Medicine and Health Sciences, University of Alcalá,
Alcalá de Henares, Madrid, Spain
SUMMARY. Objective. A bibliometric study of peer-reviewed scientific publications on atypical antipsychotic drugs (AADs) from Italy is
herein presented. Methods. We selected the documents from Scopus database. We applied several bibliometric indicators of production and dispersion, including Price’s Law about the increase of scientific literature, and Bradford’s Law. We also calculated the participation index across different countries. The bibliometric data have also been correlated with some social and health data sourcing in Italy, such as total per capita expenditure on health and gross domestic expenditure. Results. A total of 2949 original documents were published within the period 1972-2015. Our results state fulfilment of Price’s Law, with scientific production showing exponential growth (r=0.901, as against an r=0.838 after linear adjustment). The drugs most widely studied were clozapine (257 documents), risperidone (179), and olanzapine (172). Stratifica-tion into Bradford zones yielded a nucleus represented by the Journal of Clinical Psychopharmacology and Rivista di Psichiatria (58 articles, each one). A total of 1091 different journals were evaluated. Conclusions. The publications on AADs in Italy have undergone exponential growth over the studied period, which is in line with the progressively burgeoning on novel AAD releases. No evidence of saturation point was observed.
KEY WORDS: atypical antipsychotic drugs, bibliometry, schizophrenia, Italy.
RIASSUNTO. Introduzione. Lo scopo è stato di condurre uno studio bibliometrico delle pubblicazioni scientifiche peer-reviewed sui
far-maci antipsicotici atipici (AAD) in Italia. Metodi. Sono stati selezionati i documenti rilevanti dal database Scopus. Sono stati impiegati di-versi indicatori bibliometrici di produzione e dispersione, inclusa la legge di Price sull’aumento delle letteratura scientifica e la legge di Brad-ford. Sono anche stati calcolati gli indici di partecipazione per quanto concerne i diversi stati. I dati bibliometrici sono stati anche correlati con alcuni dati italiani sociali e sulla salute, come la spesa totale pro-capite sulla salute e la spesa pubblica totale. Risultati. Negli anni 1972-2015 sono stati pubblicati 2949 documenti originali. I risultati del nostro studio hanno soddisfatto la legge di Price, con una produzione scien-tifica che ha mostrato una crescita esponenziale (r=0,901, r=0,838 dopo correzione lineare). I farmaci più studiati sono risultati essere la clo-zapina (257 documenti), il risperidone (179) e l’olanclo-zapina (172). La stratificazione secondo le zone di Bradford ha fatto emergere un nucleo maggiormente rappresentato dal Journal of Clinical Psychopharmacology e dalla Rivista di Psichiatria (58 articoli ognuno). È stato valutato un totale di 1091 riviste. Conclusioni. Le pubblicazioni sugli AAD in Italia hanno mostrato una crescita esponenziale nel periodo studiato, dato in linea con il progressivo impiego e lo studio sull’uscita dei nuovi AAD. Non è stata trovata alcuna evidenza di punto di saturazione.
INTRODUCTION
Schizophrenia is par excellence the prototype of psychi-atric disorders. It is a persistent, debilitating and severe men-tal illness, with an etiopathogenic base not fully understood. According to epidemiological studies, its prevalence fluctu-ates between 0.5 and 1.0% in the general population1. The World Health Organization (WHO) classifies this illness among the 10 leading disorders carrying high disability in the adult population2.
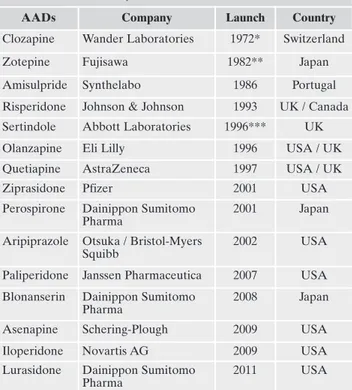
The main therapeutic pillar for schizophrenia treatment during the last 60 years have been antipsychotic drugs. The first antipsychotics, called classical or typical, have relevant side effects, principally extrapyramidal symptoms (EPS)3. However, after the reintroduction in the United States of clozapine, the research expectations shifted dramatically, and opened the door to the so-called “atypical antipsychotics” (AADs)4. The clinical criteria for atypicality include an an-tipsychotic efficacy at least similar to that of classical agents, altogether with a lower propensity for EPS. The advances achieved in the field of antipsychotic drugs in the past 20 years have been remarkable, with the clinical introduction of numerous AADs (risperidone, olanzapine, quetiapine, ziprasidone, aripiprazole, etc.) (Table 1). These agents have
notably improved the quality of life (QoL) of psychotic pa-tients and have significantly contributed to weakening the stigma surrounding psychiatric pharmacotherapy5. Thus, since 1993, with the clinical introduction of the new antipsy-chotics and, later on, with their authorization for the treat-ment of bipolar disorder since 2003, research related to these drugs has advanced considerably, and this has undoubtedly translated into a considerable increase in the amount of sci-entific literature on these drugs – as it has been analyzed, in the specific case of Italy, in this study.
No accurate prevalence or incidence data is available on schizophrenia in Italy6. The reasons for this are two-fold. The first is that the expected prevalence (based on studies in oth-er countries and sevoth-eral small regional studies in Italy) is about 4-5/1000, although studies are needed on a much larg-er population (at least 50,000 individuals) to allow more ac-curate estimate with an acceptable confidence interval. The second reason is that schizophrenia, unlike other mental health disorders such as most anxiety disorders and unipolar depression (assessed in the ESEMED study [European Study of the Epidemiology of Mental Disorders], the only epidemiological study of mental disorders carried out in the general population in Italy), cannot be considered reliable as it was performed using non-professional interviewers (with low associated costs); to involve professionals would have been cost prohibitive7. Based on international data, in Italy, with an adult population (age ≥18 years) roughly above 50 million individuals, it can be estimated that there are around 245,000 people with or who have been affected with a schiz-ophrenic disorder at some point in their lifetime8.
In Italy, more than 30 years after the approval of law 180/78, which decentralised treatment of psychiatric patients, and the beginnings of local psychiatric services, the network of local services for mental health care in Italy likely repre-sents, on an international level, a model to be adopted in the development of community interventions6. In the last decade, at national and regional levels, the efficiency of the community psychiatric system has been assessed system in terms of level of care provided to patients with psychoses, and in particular, with schizophrenia. However, any judge-ment regarding the efficacy of judge-mental health services cannot be complete without evaluating the outcomes of interven-tions, which represents a central but difficult task. In fact, sig-nificant positive outcomes, or improvement in health follow-ing intervention, are the primary goal of mental health serv-ices. Thus, the need for better cost-utilization and resources information about antipsychotics is crucial to gather a more comprehensive picture of the current pharmacological trends and effectiveness of care management of schizophre-nia patients.
The use of bibliometric indicators for studying research activity in a specific country or in a particular field is based on the premise that scientific publication is the essential re-sult of such activity9. Despite their methodological limita-tions, bibliometric studies are useful tools for assessing the social and scientific relevance of a given discipline or field10. Our group has studied, with a bibliometric approach, the evolution of scientific literature in psychiatry by specific re-search groups, on different psychiatric disorders, on aspects related to the discipline, and on specific therapeutic tools in the field of psychopharmacology11-14. In recent years, we have also analysed the evolution of scientific production on
Table 1. Clinical development of AADs.
AADs Company Launch Country
Clozapine Wander Laboratories 1972* Switzerland
Zotepine Fujisawa 1982** Japan
Amisulpride Synthelabo 1986 Portugal
Risperidone Johnson & Johnson 1993 UK / Canada Sertindole Abbott Laboratories 1996*** UK
Olanzapine Eli Lilly 1996 USA / UK
Quetiapine AstraZeneca 1997 USA / UK
Ziprasidone Pfizer 2001 USA
Perospirone Dainippon Sumitomo Pharma
2001 Japan
Aripiprazole Otsuka / Bristol-Myers Squibb
2002 USA
Paliperidone Janssen Pharmaceutica 2007 USA Blonanserin Dainippon Sumitomo
Pharma
2008 Japan
Asenapine Schering-Plough 2009 USA
Iloperidone Novartis AG 2009 USA
Lurasidone Dainippon Sumitomo Pharma
2011 USA
*Reintroduced in 1990 in USA and UK after being withdrawn from the market in 1975.
**Commercialized by Astellas in Germany in 1990.
***Marketing authorization was suspended by the European Med-icines Agency (EMA) in 1998 and the drug was withdrawn from the market. In 2002, based on new data, the EMA suggested that sertin-dole could be reintroduced for restricted use, and with extensive ECG monitoring requirement.
AADs in different countries in Asia15and Spain16. Herein, we focused this bibliometric approach on AADs publications sourcing in Italy.
RESULTS
Following studying of the repertoire analyzed, during the period 1972-2015, we gathered 2,949 original documents (ar-ticles, reviews, editorials, letters to the editor, etc.) dealing with different aspects related to AADs in Italy. Of these, 257 correspond to clozapine, 179 to risperidone, 172 to olanzap-ine, 122 to aripiprazole, 101 to quetiapolanzap-ine, 36 to amilsupride, 24 to paliperidone, 22 to ziprasidone, 13 to asenapine 11 to sertindole, 9 to lurasidone, and 2 iloperidone. No document relative to zotepine, blonanserin, and perospirone was found.
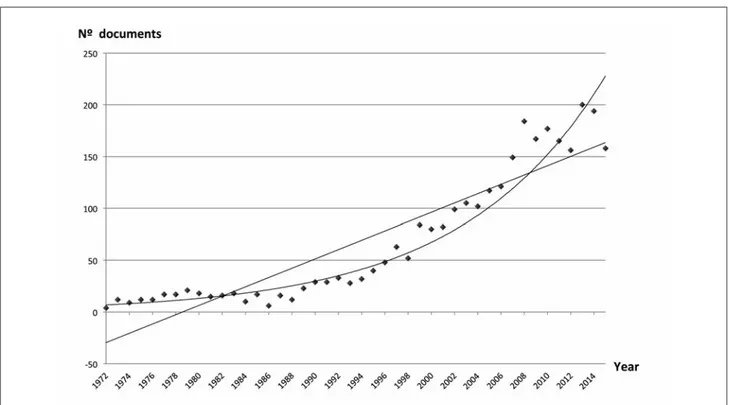
As outlined in Figure 1, over the last 40 years there has been a steep increase in the number of publications generat-ed in relation to AADs in Italy at a in line with worldwide trend. The mathematical adjustment to an exponential curve, shown in Figure 1, permits us to obtain a correlation coeffi-cient r=0.9014, indicating 9.86% of variance unexplained by this fitting. In contrast, the linear adjustment of the measured values provides an r=0.8383, and therefore a percentage of unexplained variance of 16.17%. With these data we can con-clude that the repertoire analyzed is more in keeping with an exponential fitting than a linear one, and that the postulates of Price’s Law are fulfilled.
To calculate doubling time, the scatter plot in Figure 2 shows the temporal production of publications along the trend line, which was fitted to the equation y=28.489e0.1127x, with a correlation coefficient of 0.9268. This production cor-responds to 44 years and a doubling time of 6.11 years.
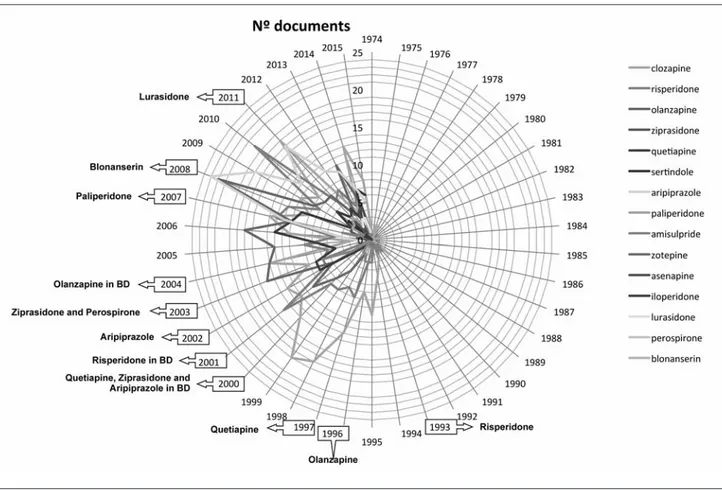
The clinical introduction of the new AADs in different countries of the world, altogether with their authorization for the treatment of bipolar disorder, appears to have
con-METHODS Data collection
The database used for the present bibliometric study was Sco-pus, the largest abstract and citation database of peer-reviewed lit-erature: scientific journals, books and conference proceedings. It covers nearly 22,000 titles from over 5000 publishers, of which 20,000 are peer-reviewed journals in the scientific, technical, med-ical, and social sciences (including arts and humanities).
Using remote downloading techniques, we selected documents containing, in the AD (author address) section the descriptor Italy, and in the TI (title) section, the descriptors atypic* antipsy-chotic*, second-generation antipsyantipsy-chotic*, clozapine, risperidone, olanzapine, ziprasidone, quetiapine, sertindole, aripiprazole, paliperidone, amisulpride, zotepine, asenapine, iloperidone, lurasi-done, perospirone and blonanserin, always confining the year of publication to the period 1972-2016. Further descriptors, referring to pharmacological aspects, were not restricted to any field of the database. For the purposes of this study we considered all the orig-inal articles, brief articles, reviews, editorials, letters to the editor, etc., and all duplicated documents were eliminated.
Bibliometric indicators
Among the bibliometric indicators of production applied is Price’s Law17. This law, without doubt the indicator most widely used in analysis of the productivity of a specific discipline or a par-ticular country, reflects a fundamental aspect of scientific produc-tion, which is its exponential growth. In order to assess whether the growth of scientific production in AADs follows Price’s Law of exponential growth, we made a linear adjustment of the data obtained, according to the equation y=4.491x - 8886, and another adjustment to an exponential curve, according to the equation y=1E-69e0.081x.
Other indicators related to growth of scientific literature are doubling time and annual growth rate. The first is the amount of time required for the subject matter to double its production; and the annual growth rate represents how the magnitude has grown over the previous year, expressed as a percentage. The equation that calculates the doubling time (D) is represented by the fol-lowing expression:
Ln2 D = ——
b
where b represents the constant that relates the rate of growth to the size of the science already acquired. To calculate the annu-al growth rate, we used the following equation:
R = 100 (eb– 1)
As a bibliometric indicator of the dispersion of scientific infor-mation we used Bradford’s Law. With the aim of revealing the dis-tribution of the scientific literature in a particular discipline, Brad-ford proposed a model of concentric zones of productivity (Brad-ford zones) with decreasing density of information18. Thus, each
zone would contain a similar number of documents, but the num-ber of journals in which these are published would increase on passing from one zone to another. This model permits identifica-tion of the journals most widely used or with greatest weight in a given field of scientific production.
As an indicator of the publications’ repercussion we used the Impact Factor (IF). This indicator, developed by the Institute for Scientific Information (Philadelphia, PA, USA), is published an-nually in the Journal Citation Reports (JCR) section of the Science Citation Index (SCI). The IF of a journal is calculated on the basis of the number of times this journals is cited in the source journals of the SCI during the two previous years and the total number of articles published by the journal in question in these two years. The JCR lists scientific journals by specific areas, ascribing to each of them their corresponding IF and establishing a ranking of “prestige”19. We used the IF data of 2015 published in the JCR.
Another indicator included in the present analysis is the na-tional participation index (PI) of Italy for overall scientific pro-duction (the ratio of the number of documents generated by Italy and the total number of documents on this topic). This PI has al-so been compared with global PI in biomedical and health sci-ences (as well as for Psychiatry and Mental Health area in partic-ular). Likewise, the PI has been correlated with some health data of Italy, such as total per capita expenditure on health and gross domestic expenditure. The PI has also been correlated with the corresponding PI for the world’s 11 most productive countries during the period 1996-2015. The health data were obtained from The World Bank20(2014) and World Health Organization De-partment of Health Statistics and Informatics21.
Figure 1. Growth of scientific production on AADs in Italy. A linear adjustment of the data was carried out, and a fitting to an exponential curve, in order to check whether production follows Price’s Law of exponential growth.
Linear adjustment: y = 4.491x – 8886 (r² = 0.838). Exponential adjustment: y = 1E-69e.0.0814x(r² = 0.901).
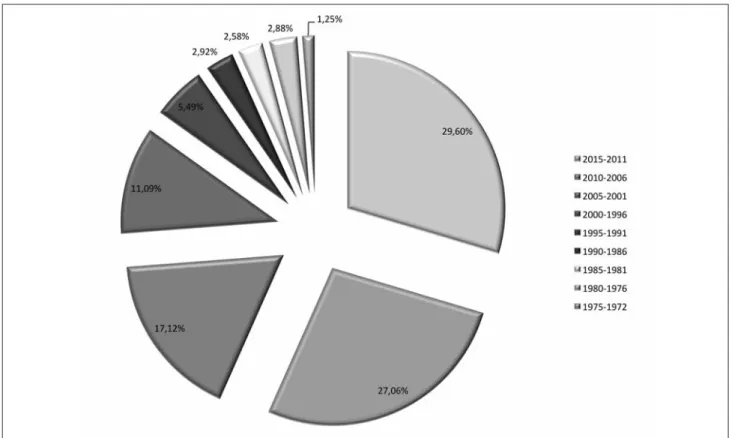
tributed substantially to the increase in scientific production in the field of AADs in Italy, as can be seen in Figure 3. With effect from 2008, the growth is manifest, due mainly to two drugs, aripiprazole and olanzapine, respectively. Figure 4 il-lustrates the matter even better. It can be observed that cu-mulative growth in total scientific production related to AADs in Italy in each five-year period over the previous one even gradually increases. Figure 5 shows the growth, for pe-riods of five years, of the Psychiatry and Mental Health vs. AADs.
As regards the scientific media in which the documents on AADs have been published, we have applied the Bradford’s model. The mean number of articles per Bradford zone is 983, though if we discard the last zone, whose accuracy is ob-viously lower, the mean would be 841. Table 2 shows the di-vision into Bradford’s areas of the material under study. A total of 1,091 different journals were involved in the publica-tion of the material analyzed, it should be noted that just over 16% of them are responsible for 50% of documents. The core consists of 38 journals, being those that contain the largest number of articles Journal of Clinical
Psychopharma-cology and Rivista di Psichiatria (which is a broadly-read
Journal popular among Italian psychiatrists), with a 1.97 both IP, and IF of 3,243 and 0,723 respectively.
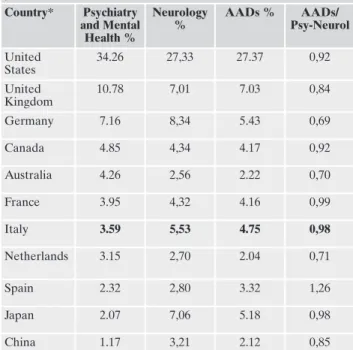
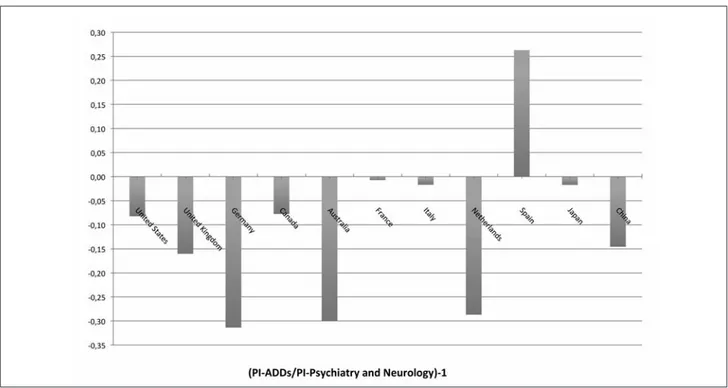
The general contribution of Italy science, within this the-matic area, represents a global PI of 4.75 with respect to world production in period analyzed. Among the countries generating research on AADs, the most significant, as Table 3 shows, is the United States, whose PI is 27.37, followed by the United Kingdom (PI=7.03), Germany (PI=5.43), Japan (PI=5.18), Canada (PI = 4.17) and France (PI = 4.16). How-ever, if we consider the productivity of these countries in this area in relation to their overall production in the field of Psy-chiatry and Neurology, only 1 (Spain) of the 11 largest pro-ducers in the period 1996-2015, devote a higher percentage of attention to the study of AADs (Figure 6). In the analysis of the correlation between PI and the per capita health ex-penditure of each of the countries with the highest scientific production in health sciences, the distribution obtained is quite similar (Figure 7).
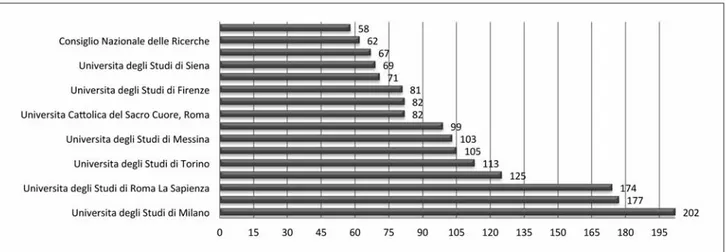
Figure 8 shows the most productive institutions in relation to the material under study. As it can be seen, 50% of total production was generated in the 13 institutions most produc-tive, among which stand out University of Milano, “Alma Mater Studiorum” University of Bologna and University “La Sapienza” of Rome. However, it must be said that we defined the corresponding institution solely based on the informa-tion given in the AD field in the Scopus web database.
Figure 4. Evolution of the number of documents every five-years periods.
Figure 5. Cumulative growth by five-year periods of scientific production on total productivity in Psychiatry (and Mental Health) and Neu-rology area, and AADs in Italy. Data from each five-year period refer to evolution over the previous period. The period of reference is 1996-00. Data expressed in percentages.
DISCUSSION
Bibliometric studies constitute interesting tools for as-sessing the social and scientific importance of a given disci-pline over a specific time period. Despite their methodologi-cal limitations, these analyses permit an overview of the growth, size and distribution of the scientific literature relat-ed to a particular discipline, and the study of the evolution of not only the biomedical speciality, field of specialization or
issue in question, but also the scientific production of an in-stitution, country, author or research group9.
Taking into account these premises, the design of the pres-ent analysis allows us to make a global assessmpres-ent of the growth of scientific literature in relation to AADs in Italy. In this regard, it should be stressed how, as Figure 1 shows, the number of scientific publications has undergone exponential growth over the last 44 years, and especially after 1998, with-out evidence, up to the end of the period studied, of the process of saturation postulated by Price in his theory of ex-pansion of scientific literature17. This finding is concordant with the results of our earlier studies from other countries of European Unión, such as Spain16. Precisely, should be noted as positive, that the time of duplication of the AADs about scientific literature is situated in only 6.11 years, which de-monstrates the great dynamism that presents this scientific activity in Italy.
To date, there are relatively few observational studies that have analyzed antipsychotic prescription trends in Italy22,23. Moreover, corresponding bibliometric studies on antipsy-chotics utilizations in schizophrenia patients in Italy are scant, or virtually absent6.
This is a compelling issue, especially considering the high morbidity and mortality risks associated with the use of ei-ther first- or second-generation antipsychotic compounds. Regrettably, substantial lack of bibliometric studies, pre-scription and cost-utilization trends of varying psychiatric drugs in Italy in line with corresponding lack of information for general medicine drugs overall, both in comparison with other Western Europe and North American countries24.
The great development of the scientific literature on AADs coincides with its approval for marketing by the US Food and Drug Administration (FDA) and other interna-tional regulatory agencies in the treatment bipolar disorder. Since 2004, other AADs such as risperidone, quetiapine, ziprasidone, aripiprazole, and asenapine, etc. have been also approved for the treatment of manic episodes, and olanzap-ine and aripiprazole for relapse prevention in patients with bipolar disorder. Quetiapine is indicated as monotherapy for the acute treatment of depressive episodes associated with bipolar disorder, and olanzapine-fluoxetine combination for treating treatment-resistant major depressive disorder. Also aripiprazole was approved in 2007 by the FDA for treating treatment-resistant major depression as an add-on to an an-tidepressant. Finally, AADs are also commonly used (and studied) in numerous off-label indications, such as toxicolog-ical psychosis, agitation symptoms, tics, substance abuse dis-orders, etc.25,26. In this sense, there has been an important up-surge in the five-year period 2002-06, coinciding with the pe-riod of official approval of the new antipsychotics, and new indications for AADs (bipolar disorder, depression, autism, etc.). In the individual analysis of the new AADs, risperidone emerges as the agent most widely studied, as shown by the present bibliometric study.
Another aspect of interest in relation to scientific produc-tion that we have analyzed is its quality. To this end we used the indicators of impact and excellence of the publications on the topic in question. The fact that such prestigious jour-nals as European Neuropsychopharmacology (IF=4.409) or
Progress in Neuro-Psychopharmacology and Biological Psy-chiatry (IF=4.361) publish articles on AADs from Italy is an
important factor in this regard, which indicates the relevance
Table 2. Distribution of the journals in Bradford’s zones.
Nº of journals % of journals Nº of articles % of articles Bradford multiplier Core 38 3.48% 853 28.93% Zone 1º 140 12.83% 829 28.11% 3.68 Zone 2º 913 83.68% 1267 42.96% 6.52 TOTAL 1091 100% 2949 100% 5.10 Total number of journals = 1091
Average number of articles = 983
Average number of articles, excluding the last Bradford zone = 841
Table 3. Distribution of documents on AADs in the world’s 10 most productive countries in biomedicine and health sciences for the period 1996-2015. Country* Psychiatry and Mental Health % Neurology % AADs % AADs/ Psy-Neurol United States 34.26 27,33 27.37 0,92 United Kingdom 10.78 7,01 7.03 0,84 Germany 7.16 8,34 5.43 0,69 Canada 4.85 4,34 4.17 0,92 Australia 4.26 2,56 2.22 0,70 France 3.95 4,32 4.16 0,99 Italy 3.59 5,53 4.75 0,98 Netherlands 3.15 2,70 2.04 0,71 Spain 2.32 2,80 3.32 1,26 Japan 2.07 7,06 5.18 0,98 China 1.17 3,21 2.12 0,85
Psy-Neurol (area of focus in Neurology and Psychiatry); AADs (atypical antipsychotic drugs).
* The world’s 11 most productive countries in Psychiatry (and Men-tal Health) and Neurology for the period 1996-2015.
Total documents 1996-2015 in Psychiatry and Mental Health: 544,264 (Scimago Journal & Country Rank).
Total documents in Neurology 1999-2015: 968,287 (Scimago Jour-nal & Country Rank).
Figure 6. Relationship between production of scientific literature on AADs and total production in the field of Psychiatry and Neurology in the world’s 11 most productive countries.
PI (participation index), AAD (atypical antipsychotic drugs).
Figure 7. Gross domestic product (GDP) per capita and relationship between production of scientific literature on AADs and the total ex-penditure on health on GDP and per capita in Int$, in the world’s 11 most productive countries in Psychiatry and Neurology.
PI (participation index). *World Bank data20.
(both clinical and social) that this country has acquired in re-cent years. Moreover, it is noteworthy, as we have said, that, among the 10 publications most widely used in Italy for the international divulgation on AADs research, 5 are in the ranking of the most relevant in the field of Psychiatry (IF >2) (JCR 2015).
During the two last decades, there has been a notable in-crease in scientific production in the area of Psychiatry and Neurology in Italy (Figure 5), with this percentage even high-er in AADs, at the height of othhigh-er biomedical disciplines (Table 4) where ranges from the 5th to 8th position. As we have shown in recent studies15,16, research scientific on AADs is one of the fields experiencing faster growth with in psychiatry. Similarly, other authors, using bibliometric tools, have reported that the research activity in the field of schiz-ophrenia is superior to that of other psychiatric fields27. These authors also suggest that the attraction of research on schizophrenia may have been positively affected by the clin-ical perception of the greater seriousness of the illness com-pared to other psychiatric pathologies. Moreover, Theander
and Wetterberg28 report that the number of references on schizophrenia in Medline has followed the general increase of medical publications, which accounts for 0.42% compared to the total medical literature in the period studied.
The two major Anglophone countries, United States and United Kingdom, head the ranking of producer countries and between them generate over a third of total scientific production in this field (34.39%). The fact that in these two countries are home to the pharmaceutical companies re-sponsible for the development of AADs [olanzapine (Eli Lil-ly, USA), risperidone and paliperidone (Janssen Pharmaceu-tica, USA), quetiapine (AstraZeneca, UK), ziprasidone (Pfizer, USA), and aripiprazole (Bristol-Myers Squibb/Otsu-ka Pharmaceutical Co., USA/Japan)] may help to explain this high PI.
Table 3 shows the data from the 11 most productive coun-tries in the Psychiatry & Mental Health and Neurology dis-cipline and compares them with productivity in the specific field of AADs. It is worthy of note how some countries, such as Germany, Canada, and Italy sit near the top of the ranking for AADs production (Table 4), reflecting the special inter-est of these countries in research into these drugs. Other countries, such as the United States and United Kingdom maintain rates of productivity in AADs research that are in proportion with their global index for Psychiatry and Neu-rology. Finally, we must highlight countries, such as Spain, where the ratio of research on AADs is higher than in these areas of knowledge (Figure 6), as we have shown in a recent publication16.
The correlation of scientific production in AADs with the
per capita health expenditure of each country, shown in
Fig-ure 8, offers us a parallel view of this phenomenon; in gener-al, there is confirmation of the notion that the higher the spending on health, the greater the research production. In this regard, it should be made clear that a country’s scientif-ic production in a given field tends to reflect a science re-search and development policy begun some years prior to the period analyzed, and is not the fruit of particular eco-nomic circumstances12,13. The correlation analysis between scientific production in AADs and the gross domestic in
Figure 8. Contribution of different Italian institutions.
Table 4. Contribution of Italy in different areas of biomedicine.
Area Rank* PI
Medicine 7 4.10
Biochemistry, Genetics and Molecular Biology 7 3.59
Health Professions 8 2.76
Neuroscience 6 4.19
Pharmacology, Toxicology and Pharmaceutics 7 3.67
Psychiatry and Mental Health 7 3.59
Neurology 5 5.32
Neurology (Clinical) 5 5.63
*Data Scimago Journal & Country Rank (1996-2015). PI (Participation Index)
heath expenditure located to Netherlands, Australia and Canada at the last three positions.
According to the 2015 OECD Health Statistics, covering the period 1960 to 2014, providing comparative analyses on health status, risk factors to health, health care resources and utilisation as well as health expenditure and financing, Italy performances set in the lower-tier level compared with other 33 countries appraised by the OECD29. In 2013, per capita health spending in Italy dropped by 3.5% in real terms - the third year in succession that health expenditure has fallen in real terms. Preliminary estimates point to a further contrac-tion of 1.4% in 2014. Both public and private health spend-ing have shown continuous falls since 2011. As a result, per capita spending on health in Italy remains at a level below that prior to the economic crisis. A number of cost-contain-ment measures have been taken in the wake of the econom-ic crisis to reduce publeconom-ic spending on health. Cuts in phar-maceutical spending, which were already targeted prior to the crisis, have contributed to the overall fall. The share of the generic market has increased, although it remains rela-tively low in Italy. In 2010: a 12.5% reduction in the retail price of generic drugs was brought in while the following year saw maximum reimbursement prices for generics estab-lished in line with prices in Germany, UK, France and Spain29.
Health spending in Italy (excluding investment expendi-ture in the health sector) was 8.8% of GDP in 2013, slightly below the OECD average of 8.9%. This has increased by 1 percentage point since 2003, mainly because of slow growth in GDP over this ten-year period. The share of the economy allocated to health spending is similar to Spain, Portugal and Greece, but well below the levels of France and Germany (10.9% and 11.0% respectively). The share of government spending in Italy as a share of total spending on health has remained relatively constant over the last decade at around 77%. This is slightly above the OECD average of 73%. Among OECD countries, only the United States and Chile report public spending on health below 50%. Although out-of-pocket spending at 22% of health spending has not in-creased in recent years, it remains relatively high compared with other western European countries such as France (7%), Germany (14%) and United Kingdom (10%), although still well below some other southern European countries such as Greece (31%) and Portugal (28%). In per capita terms (ad-justed for different price levels using economy-wide pur-chasing power parities), Italy spent USD 3077 per head in 2013. This compares with an OECD average of USD 3453 29. Previous bibliometric studies have drawn attention to a series of limitations characteristic of this approachs30. It is obvious, for example, that the international scientific produc-tion in a particular field, such as AADs in this case, is much more extensive (many journals or contributions made to sci-entific conferences and meetings are not indexed in the usu-al databases). We can usu-also cite the lack of standardization of the name of the authors, or those derived from the incorrect use of methodological filters31.
Nevertheless, the recognized quality of the publications in-cluded in the databases employed in the present study, which collects not only articles written in English but also in other languages, and their coverage mean that the documents se-lected constitute a more than representative sample of the in-ternational research on the area in question. By way of
con-clusion, it can be asserted that, despite the limitations charac-teristic of bibliometric studies, and thanks to the design of this study, we have been able to offer a picture of the representa-tiveness and evolution of international research on AADs in Italy, observing the parameters of quality and dissemination most commonly employed at an international level. Research in this field will possibly continue to grow in the coming years, bearing in mind that the ideal antipsychotic drug has not yet been found5and that etiopathogeny of schizophrenia is still, in its majority, unknown. Besides, AADs have, and will con-tinue to have, an ever-expanding range of clinical indications, both within the psychiatric ambit and outside it, to judge from the promising results obtained for the different pathologies with which they have been studied; in consequence, scientific production in relation to these drugs will certainly continue to be abundant, as is happening with the prescription patterns of AADs in this region.
Conflict of interest: the authors have declared no conflict of in-terest.
Acknowledgements: this research was supported by grant UCJC 2014/43 from III Convocatoria de Ayudas a la Investigación Com-petitiva de la Universidad Camilo José Cela.
REFERENCES
Goldner EM, Hsu L, Waraich P, Somers JM. Prevalence and in-1.
cidence studies of schizophrenia disorder: a systematic review of literature. Can J Psychiatry 2002; 47: 833-43.
World Health Organization. Mental health: new understanding, 2.
new hope. Geneva: WHO, 2001.
López-Muñoz F, Alamo C, Rubio G, Cuenca E. Half a century 3.
since the clinical introduction of chlorpromazine and the birth of modern psychopharmacology. Prog Neuro-Psychopharmacol Biol Psychiatry 2004; 28: 205-8.
Hippius H. A historical perspective of clozapine. J Clin Psychia-4.
tr 1999; 60 (Suppl. 12): 22-3.
López-Muñoz F, Álamo C. Neurobiological background for the 5.
development of new drugs in schizophrenia. Clin Neurophar-macol 2011; 34: 111-26.
Altamura CA, Fagiolini A, Galderisi S, Rocca P, Rossi A. Schiz-6.
ophrenia today: epidemiology, diagnosis, course and models of care. Ital J Psychopathol 2014; 20: 223-43.
Alonso J, Angermeyer MC, Bernert S, et al. Prevalence of men-7.
tal disorders in Europe: results from the European Study of the Epidemiology of Mental Disorders (ESEMeD) project. Acta Psychiatr Scand 2004; Suppl 420: 21-7.
De Masi S, Sampaolo L, Cappello S. Gli interventi precoci nella 8.
schizofrenia. Linee Guida dell’Istituto Superiore di Sanità, 2007. Website: http://www.snlg-iss.it/cms/files/LG_schizofrenia.pdf (last accessed, February 28, 2017).
Bordons M, Zulueta MA. Evaluación de la actividad científica a 9.
través de indicadores bibliométricos. Rev Esp Cardiol 1999; 52: 790-800.
White HD, McCain KW. Bibliometric. Ann Rev Inf Sci Technol 10.
1989; 24: 119-86.
López-Muñoz F, Alamo C, Rubio G, García-García P, Martín-11.
Agueda B, Cuenca E. Bibliometric analysis of biomedical publi-cations on SSRIs during the period 1980-2000. Depress Anxiety 2003; 18: 95-103.
López-Muñoz F, Vieta E, Rubio G, García-García P, Alamo C. 12.
Bipolar disorder as an emerging pathology in the scientific lit-erature: a bibliometric approach. J Affect Dis 2006; 92: 161-70.
López-Muñoz F, Álamo C, Quintero-Gutiérrez FJ, García-Gar-13.
cía P. A bibliometric study of international scientific productivi-ty in attention-deficit hyperactiviproductivi-ty disorder covering the period 1980-2005. Eur Child Adolesc Psychiatr 2008; 17: 381-91. López-Muñoz F, García-García, P, Sáiz-Ruiz J, et al. A biblio-14.
metric study of the use of the classification and diagnostic sys-tems in psychiatry over the last 25 years. Psychopathology 2008; 41: 214-25.
López-Muñoz F, Shen WW, Shinfuku N, et al. A bibliometric 15.
study on second-generation antipsychotic drugs in the Asia-Pa-cific Region. J Exp Clin Med 2014; 6: 111-7.
López-Muñoz F, Rubio G, Molina JD, et al. Mapping the scien-16.
tific research on atypical antipsychotic drugs in Spain: A biblio-metric assessment. Actas Esp Psiquiatr 2013; 41: 349-60. Price DJS. Little science, big science. New York: Columbia Uni-17.
versity Press, 1963.
Bradford SC. Documentation. London: Crosby Lockwood, 1948. 18.
Garfield E. Citation indexing. Its theory and application in sci-19.
ence, technology and humanities. New York: Wiley, 1979. World Bank. World Development Report 2014. Risk and Op-20.
portunity. Managing Risk for Development. Washington, DC: The World Bank, 2014.
World Health Organization Department of Health Statistics 21.
and Informatics. World Health Statistics 2015. Geneva: WHO, 2015.
Franchi C, Tettamanti M, Marengoni A, et al. Changes in trend 22.
of antipsychotics prescription in patients treated with cholinesterase inhibitors after warnings from Italian Medicines
Agency. Results from the EPIFARM-Elderly Project. Eur Neu-ropsychopharmacol 2012; 22: 569-77.
Bolcato J, Terrazzani G, Giusti P, Walley T, Chinellato A. Atypi-23.
cal antipsychotic prescribing patterns in an Italian district 2001-2009 and the impact of regulatory warnings. Open Sci J Clin Med 2014; 2: 10-4.
Bramness JG, Henriksen B, Person O, Mann K. A bibliometric 24.
analysis of European versus USA research in the field of addic-tion. Research on alcohol, narcotics, prescription drug abuse, to-bacco and steroids 2001-2011. Eur Addict Res 2014; 20: 16-22. Fountoulakis KN, Nimatoudis I, Iacovides A, Kaprinis G. Off-la-25.
bel indications for atypical antipsychotics: A systematic review. Anns Gen Hosp Psychiatr 2004; 3: 4-14.
Mortimer AM, Shepherd CJ, Rymer M, Burrows A. Primary 26.
care use of antipsychotic drugs: an audit and intervention study. Ann Gen Psychiatr 2005; 4: 18-26.
Clement S, Singh S, Burns T. Status of bipolar disorder research. 27.
Br J Psychiatr 2003; 182: 148-52.
Theander SS, Wetterberg L. Schizophrenia in Medline 1950-2006: 28.
a bibliometric investigation. Schizophr Res 2010; 118: 279-84. OECD. Health Statistics 2016. Website:
29.
http://www.oecd.org/els/health-systems/health-data.htm (last accessed, February 28, 2017).
Johnson MH, Cohen J, Grudzinskas G. The uses and abuses of 30.
bibliometrics. Reprod BioMed Online 2012; 24: 485-6. Sanz-Valero J, Veiga de Cabo J, Rojo-Alonso C, et al. Los filtros 31.
metodológicos: aplicación a la búsqueda bibliográfica en la me-dicina del trabajo española. Med Segur Trab 2008; 54: 75-83.