A FISCAL REVOLUTION? PROGRESSIVITY IN THE SPANISH TAX SYSTEM, 1960-1990
Sara Torregrosa Hetland
Document de treball de l’IEB
2014/8
Documents de Treball de l’IEB 2014/8
A FISCAL REVOLUTION?
PROGRESSIVITY IN THE SPANISH TAX SYSTEM, 1960-1990
Sara Torregrosa Hetland
The IEB research program in Tax Systems’ Analysis aims at promoting high quality
research in the field of taxation, taking into account not only the traditional approach to
optimal taxation, but also administrative issues and the decentralization or globalization
context. The ultimate aim of the program is to generate socially useful knowledge in
this field. Special emphasis is put on empirical research, and on the analysis of the
Spanish Tax System. The program enjoys the support from the IEB-Foundation.
The Barcelona Institute of Economics (IEB) is a research centre at the University of
Barcelona (UB) which specializes in the field of applied economics. The IEB is a
foundation funded by the following institutions: Applus, Abertis, Ajuntament de
Barcelona, Diputació de Barcelona, Gas Natural and La Caixa.
Postal Address:
Institut d’Economia de Barcelona
Facultat d’Economia i Empresa
Universitat de Barcelona
C/ Tinent Coronel Valenzuela, 1-11
(08034) Barcelona, Spain
Tel.: + 34 93 403 46 46
Fax: + 34 93 403 98 32
[email protected]
http://www.ieb.ub.edu
The IEB working papers represent ongoing research that is circulated to encourage
discussion and has not undergone a peer review process. Any opinions expressed here
are those of the author(s) and not those of IEB.
Documents de Treball de l’IEB 2014/8
A FISCAL REVOLUTION?
PROGRESSIVITY IN THE SPANISH TAX SYSTEM, 1960-1990
*Sara Torregrosa Hetland
ABSTRACT:
The main objective of this paper is to calculate the distribution of the tax burden
across income levels in Spain between 1960 and 1990. The chosen period covers the final years of
Franco’s dictatorship and the first ones of the present parliamentary regime, and is thus meant to
explore how political change was reflected on taxation. Does transition entail a fiscal revolution?
Here is one case study developed and compared to other national experiences. Effective tax reform
seems to have been politically blocked during the dictatorship, with public budgets growing
fundamentally on the grounds of social security contributions. Democracy brought about a
comprehensive transformation starting in 1977, which aimed at improving fairness (progressivity)
and increasing revenue (to fund the development of the Welfare State). In this work I analyse
whether the reforms entailed effective changes in the distribution of the tax burden, by imputing tax
collection to taxpayers, based on income and consumption micro-data from Household Budget
Surveys. The results show a persistent (albeit decreasing) regressivity in the tax system, which
caused an increasingly negative redistribution of income. Pre-Tax incomes grew unequal during the
period and net incomes even more so as a result: the tax reform did not fulfill its equalizing
promises. The joint effect of the fiscal system, however, seems to have been slightly positive due to
progressive social spending.
MAIN RESULT: The Spanish tax system is shown to overburden low income families, maybe
negatively affecting their economic activity - in addition to social cohesion. A simpler design could
attain a progressive distribution of the tax burden reducing costs in administration, incentives to
evasion, or alienation of taxpayers.
JEL Codes: D31, N34, N44, H23
Keywords: Tax system, progressivity, redistribution, income inequality
Sara Torregrosa Hetland
Department of Economic History and Institutions
Universitat de Barcelona
690 Avda. Diagonal
08034 Barcelona (Spain)
E-mail:
[email protected]
*This paper is part of the PhD dissertation project “Tax system and redistribution: the Spanish fiscal transition
(1960-1990)", under the pacient supervision of Alfonso Herranz Loncán and Alejandro Esteller Moré, to whom I am most grateful for their help. I also thank the comments by Mercè Costa, Sergio Espuelas and participants at the 8th European Economics Society Summer School in Madrid and the XXI Encuentro de Economía Pública at Girona. I acknowledge financial support from the Spanish Ministry of Education’s scholarship program Formación del Profesorado Universitario and the Research Project ECO2012-39169-C03-03. I also thank the kindness and professionality of personnel in the Public Finance Ministry Archive and the Institute for Fiscal Studies. I am in debt with Jorge Onrubia for kindly sharing his data on the Personal Income Tax.
1
Introduction
“Do you think that, generally, taxes are fairly collected? That is, that the ones who own more pay more? Or do you think otherwise?”1
During the last thirty years, approximately 80% of Spanish citizens would answer no to this question according to annual opinion polls. Back in 1994 the percentage was 75.8%; in the middle of the economic crisis it has risen until 88% (Alvira and Garc´ıa, 2005; Centro de Investigaciones Sociol ´ogicas, 2012). Spaniards do not seem to believe that their tax system is progressive, contrary to what was proclaimed during the political transition. But, are they right?
This paper cannot tackle the question of justice in the collection of taxes, since the answer would be based on normative stances. It will however analyse the distribution of the tax burden in the country, which is a prerequisite to make educated judgements.
The funding of the State is a significant flow of money in current economies, and not only on quantitative grounds. It is no doubt a political issue, which can shed light on the nature of power structures –together, of course, with the destination of those flows. It is also an economic issue, since the effects of taxing basic consumption or high incomes are not at all the same. And last but not least, it is a social matter: progressive taxation can reduce income inequality, which is itself a central concern of societies.
Progressivity is commonplace today in the debate about taxation, but that was not always the case in the past. The systems established at the beginning of the liberal era (in the first half of the 19th Century) were based on a different concept of equity, namely that proportionality would ensure the justice of taxes. The evolution of both economic thought and political scenarios brought about the idea that the tax burden should be progressive (i.e., represent an increasing proportion of taxpayers’ income as this grows),2and that the overall system should redistribute income in order to mitigate social inequality. However, after the development of the Welfare States the validity of these opinions has been questioned, especially since the economic conditions of the 1970s-80s motivated a stronger emphasis on the incentive effects of taxation upon growth. In this sense, a strand of literature has related higher inequality to lower growth via increased redistribution; e.g. Alesina and Rodrik (1994) and Persson and Tabellini (1994). But, is this so? More unequal societies will redistribute more – as long as they are democratic?
The issue of the distribution of tax payments has caught the attention of scholars (as well as politicians and the population) for a long time. Literature calculating tax burdens for different segments of the population stems from the path-breaking studies of Barna (1945) and Nicholson
1Author’s translation for “¿Y cree Ud. que, en general, los impuestos se cobran con justicia? Esto es, ¿que pagan m´as quienes
m´as tienen, o no lo cree as´ı?”. This is a question posed in the surveys made by the Centro de Investigaciones Sociol´ogicas (Center of Sociological Research), an official research center.
2The principle of progressivity arises from the ideas of ability to pay and equal sacrifice, together with decreasing
marginal utility of income and minimum total sacrifice, as stated by Edgeworth in 1897 (Edgeworth, 1994). A comprehen-sive view on the topic can be found in Musgrave (1994).
(1965) for the UK and Musgrave (1951); Musgrave et al. (1974) and Pechman and Okner (1974) for the USA. The basic lines of their methodology are followed until today by several works, both from academia (de Kam et al., 1996; Piketty and Saez, 2007; Breceda et al., 2009) and by official statistical institutions (yearly estimations are made in the USA and the UK).
For the particular case of Spain several analyses have been carried out in the past, most of them focusing on particular taxes (especially on the personal income tax, IRPF; e.g. Argim ´on and Mar´ın, 1989 and Onrubia et al., 2007). Some general estimations were performed for certain years in the late period of Franco’s regime (Perona, 1972; Valle, 1974; Lagares, 1975) and also for 1990 (Manresa and Calonge, 2001). Regrettably, these are not directly comparable, since to a certain extent they follow different methodologies: so far, we do not have a long run description of the evolution of the tax burden distribution in the country. Estimating it, and comparing it with that of other countries, is the primary goal in this paper. The preliminary hypothesis arising from the previously mentioned works is that the Spanish fiscal system underwent a transition from a regressive to a somewhat proportional system.
This study is a necessary part of the historical interpretation of the Spanish transition to democracy. As soon as 1977 a broad tax reform was initiated, having among its main declared goals an improvement in equity. Progressivity and redistribution were explicitly introduced, even in the 1978 Constitution. I analyse to what extent such policy orientation was real, and was ef-fectively applied in practice. The main finding is that regressivity was not eradicated from the tax system by the reform, although it was attenuated, after having increased during the 1960s. As a result, taxation effected an inverse redistribution of income, thus contradicting the political discourse and leaving the country far from convergence with the European Welfare State model.
The rest of the paper is organised as follows: section 2 describes the Spanish tax system and its main reforms, and presents the data series. In section 3 I explain the methodology used for the tax incidence analysis. Section 4 presents the results, while an international comparison is addressed in section 5. Finally, a general conclusion sums up the main contributions of the paper and also comments on further paths for research on the topic.
2
Reforms and persistence in the tax system
In the history of taxation in modern Spain, two main systems may be distinguished. Both of them were born in times of political change: in the first case, foundations were established in 1845, shortly after parliamentary politics stabilized in the country under dominance of the moderate party (which took several years of civil war). In turn, the current system came about in 1977, as Franco’s dictatorship gave way to a new parliamentary regime. This coincidence provides a motivation for this paper, which follows the idea Schumpeter wrote about long ago:
“The public finances are one of the best starting points for an investigation of society, especially though not exclusively of its political life. The full fruitfulness of this approach is seen particularly at those turning points, or better epochs, during which existing forms begin
to die off and to change into something new, and which always involve a crisis of the old fiscal methods” (Schumpeter, 1954).
The 1845 system followed the model of the French Revolution. Its main features were the predominance of indirect taxes (especially excises), the design of direct taxation as product taxes,3 and a scarce revenue potential (which tended to stagnate). In spite of the huge change in some areas, there was a continuity with the Ancien R´egime in several aspects, such as the maintenance of fiscal monopolies and collection techniques. These make the distinction between direct and indirect items unreliable as a significant guidance when it comes to incidence.
Such a structure was completed in the turn of the century with the addition of new taxes on capital and labour, following the evolution of the economy.4 No substantial changes came about until those taking off in 1977. However, this long period did not lack reforms. During the 2nd Republic (1932) the first precedent of the personal income tax was introduced, albeit as a limited, “complementary” levy on very high incomes. During Franco’s dictatorship (1939-1975) the main regulatory changes were Larraz’s in 1940 (which reinforced the role of consumption excises) and Navarro Rubio’s in 1957 and 1964. The latter are related to a major turn in economic policy: the abandonment of autarchic orientation with the 1959 Stabilization Plan.5 The 1957 reform pursued an increase in revenues, together with the extension of incentives to investment, while in 1964 the alleged objective was redistributive. Nevertheless, collection procedures took a step backwards with the generalization of objective collective assessment of taxable bases (related to the lack of capacity in the tax administration). Redistribution does not seem to have found its way under the dictatorship, in spite of the propaganda filling the Minister of Finance’s speeches.
Despite the lack of fundamental tax reform, there were indeed some significant changes in the financing of public administrations in Franco’s Spain. Social Security was introduced in a 1963 law as the result of integration of different (public and private) social insurance programs.6 As
3Product taxation is directed upon each specific source of income regardless of the taxpayer’s characteristics, as
op-posed to personal taxation, which aims to jointly consider the economic capacity coming from all sources.
4The government also attempted at the time to introduce progressive rates in the Inheritance tax, something which was
rejected at the Senate (but finally passed in a similar fashion in 1910). The debate in Parliament shows the full validity of the idea of proportionality at the time: increasing rates were not defended as a redistributive tool (a socialist, subversive idea), but because of their revenue-increasing effect or, in any case, as a compensation for regressivity in other taxes (San Juli´an, 2011).
5The Stabilization Plan was a deflationary programme put forth in time of critical economic imbalances. It was meant
to start a process of internal and external liberalization, and is generally used to signal the limits between the two main phases of the dictatorship. After this initial set of measures Development Plans were designed during the following decade, which some authors consider as the expression of reactions against liberalization (Gonz´alez, 1979).
6All along this paper Social Security Contributions will be considered as a tax. This might be arguable in some contexts,
since it depends on the extent to which the system functions as an insurance, though publicly administered, or not. The answer is to be found in aspects such as its compulsory or voluntary nature, the level of budgetary autonomy (State’s participation in the financing of Social Security was marginal during the dictatorship, and has been increased later), the actuarial or pay-as-you-go administration (we are in the second case), the proportionality between contributions and
a consequence, in the final years of the dictatorship public budgets did grow noticeably, but this was achieved without a (politically complicated) ‘tax’ reform, using an independent contributory system that increased pressure on labour (Fuentes Quintana, 1990).
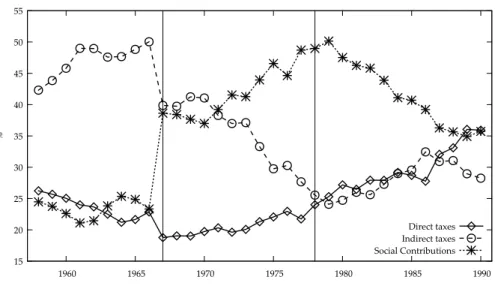
Figure 1 shows that the share of Social Contributions in total tax revenue progressively grew during the late period of the dictatorship, becoming the main source of funding in the beginning of the 1970s. The shares of indirect and direct taxation got closer over these years: the absolute predominance of the first at the beginning (considered an indication of regressivity) gave way to both lines approaching each other and almost coinciding since 1978. Such a process can therefore not be seen as a result of the political transition, since it had started earlier. On the other hand, it does not necessarily imply an improvement in progressivity: direct taxes are not progressive per se, they can be if they are personal and have increasing rates. During Francoism the growth in direct taxation was led by a proportional tax on salaries. The evolution of big categories is therefore suggestive, but inconclusive. A deeper analysis is required.
Figure 1: Main categories as % of total Spanish tax revenue
15 20 25 30 35 40 45 50 55 1960 1965 1970 1975 1980 1985 1990 % Direct taxes Indirect taxes Social Contributions
Source: Own compilation (see appendix).
The first vertical line represents the discontinuity in the series in 1967, due to the coming into force of the 1963 law (Ley de Bases de la Seguridad Social), which entailed the unification of the public social insurance system, the incorporation of some private insurance institutions and an improvement in aggregate accounting.
The second vertical line marks the reform year 1978, after which direct and indirect taxes grow in a balanced way, and social contributions lose participation in total revenue.
benefits, or the existence of non-contributory pensions (which were developed in the democratic period). Bandr´es and Cuenca (1996) showed how, in 1992, the ’transfer’ component in Spanish public pensions was around 50% of the benefit received, as a result of the policy of minimum pensions and differential revaluations during the previous decades. This redistributive component was also not homogeneous across professional regimes: actuarial equilibrium was not followed, so it is justified to approach social contributions as a tax and pensions as benefits.
Transition to democracy brought about a comprehensive transformation of the tax system, which was thought of as a basic aspect of the regime change. The main political parties shared some central features of a reform program based on previous work by the Institute for Fiscal Studies7 under the direction of E. Fuentes Quintana. It was therefore possible that only a few years after Franco’s death direct taxation was personalised and organised around a progressive-schedule income tax, as part of the negotiations in the Moncloa Pacts.8 The reform aimed at attaining a balance between direct and indirect taxes, thus improving the fairness of the system, and at increasing revenue, since it was to go hand-in-hand with the development of the Welfare State in response to social demands. All this meant a convergence with other European countries, which were taken as a model.
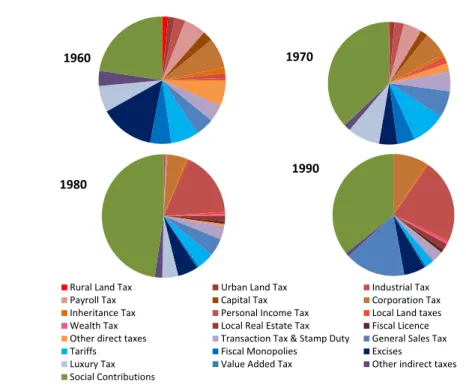
This 1977-78 reform is very perceptible in figure 2. The Personal Income Tax (hereafter, PIT) re-placed a whole range of product taxes, especially the above-mentioned tax on salaries and wages (Impuesto sobre los Rendimientos del Trabajo Personal) and the tax on dividends and other capital income (Impuesto sobre las Rentas del Capital). When looking at collection data it is clear that PIT in Spain was something very different from its old precedents with similar names, which were taxes with very low revenue generation capacity and falling only on very high incomes.
A Wealth tax was introduced during the same years. Despite its widespread presence in aca-demic and public debate, this tax always provided a small share of the public budget, as did the Inheritance tax. Both have gradually become irrelevant; a process related to widespread fraud and, in the last case, to normative changes after their cession to Autonomous Communities (Dur´an and Esteller, 2010).
The consensus period did not last long, and gave way to what some have called the “fis-cal counter-reform”(Pan-Montojo, 1996). The culmination of the projected changes was delayed, especially in indirect taxes: VAT was not introduced until 1986, at the time of accession to the Eu-ropean Economic Community. It replaced a general (cumulative) Transactions Tax put into place in 1964 (Impuesto General sobre el Tr´afico de Empresas) and the so-called Luxury Tax. Generally speaking, indirect taxation followed the lead of international integration and the harmonization in the construction of the common market (also affecting excises, public monopolies and tariffs).9 Social Contributions appear in figure 2 as a single category, but comprise flows administered by several organisms. Separate management was reduced in 1978 with the creation of some gen-eral institutions, but important differences across regimes remained (i.e., between the “gengen-eral” workers and those of special sectors, such as agrarian, self-employed, or others – some extremely
7The Instituto de Estudios Fiscales is a center of studies related to the Ministry of Public Finance.
8These were general agreements reached in the autumn of 1977 by the main parties (those who had presence in
Parlia-ment after the first elections of the new regime, celebrated in June). They focused for the most on setting a policy response to the economic crisis, but entailed also several points on taxation, as explained in Com´ın (2006).
9Tariffs had a considerable importance in the sixties (a general feature of underdeveloped countries, interrupted by
autarchy), which was lost due to commercial liberalization. State monopolies, banned by EU legislation, had to disappear and were replaced by excises.
Figure 2: Composition of Spanish tax revenue
1980
Rural Land Tax Urban Land Tax Industrial Tax Payroll Tax Capital Tax Corporation Tax Inheritance Tax Personal Income Tax Local Land taxes Wealth Tax Local Real Estate Tax Fiscal Licence Other direct taxes Transaction Tax & Stamp Duty General Sales Tax Tariffs Fiscal Monopolies Excises
Luxury Tax Value Added Tax Other indirect taxes Social Contributions
1990 1970 1960
Source: Own compilation (see appendix).
specific). Legally, around 80% of these taxes was paid by employers.
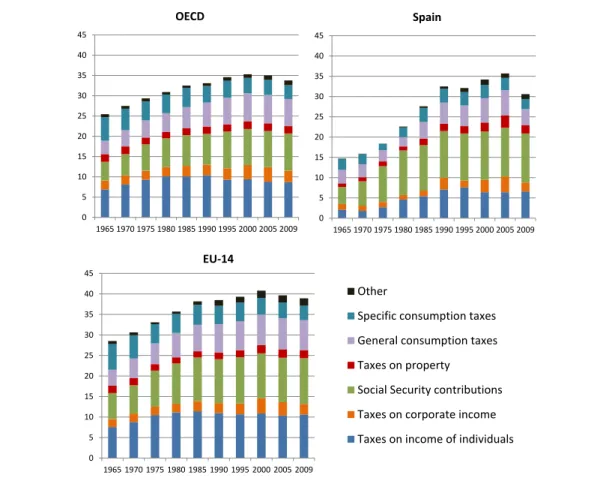
After 1978 public budgets experienced a significant expansion, which made possible the fund-ing of the nascent Welfare State (albeit insufficiently, causfund-ing the generation of major deficits).10 The process of Spanish convergence with the most advanced countries that was made possible by the democratic transition remained nevertheless incomplete: as shown in figure 3, total tax rev-enue in terms of GPD approached that of the OECD countries, but this was to some extent driven by the short-run economic performance (and therefore not sustained after the current crisis set in). Furthermore, the tale is somewhat different if our reference is the European Union, which was really the “role model”: in this case, even in the years of intense economic euphoria in the country, a considerable differential in levels stayed in place. Understanding this fact requires tak-ing into account (among other thtak-ings) that the economic context was different to the one that saw the original development of the European Welfare States, specially because of the consequences of the oil shocks and the turn taken by economic policies in the eighties. Emphasis moved from equity to efficiency.
The system put in place between 1977 and 1986 was undeniably simpler than the one that preceded it (figure 2): back in 1960 we had a large number of taxes contributing relatively little
10Since the first years of democracy, the State deficit situated itself mostly over 2% of GDP, with a first maximum in 1985
Figure 3: Tax revenue as percentage of GDP 0 5 10 15 20 25 30 35 40 45 1965 1970 1975 1980 1985 1990 1995 2000 2005 2009 OECD 0 5 10 15 20 25 30 35 40 45 1965 1970 1975 1980 1985 1990 1995 2000 2005 2009 Spain 0 5 10 15 20 25 30 35 40 45 1965 1970 1975 1980 1985 1990 1995 2000 2005 2009 EU-14 Other
Specific consumption taxes General consumption taxes Taxes on property
Social Security contributions Taxes on corporate income Taxes on income of individuals
Source: OECD Statistics (unweighted average) EU-14: European Union of 15 members excluding Spain.
to the total, while in 1990 revenue was very much concentrated around three items: Social con-tributions, the Personal income tax and the Value added tax. But Spain remained different from Europe all along in the bigger relative share accounted for by Social contributions, and the lower role of PIT. This feature can be explained by the history of successive reforms.
After 1990 no global redesign has been undertaken. However, partial modifications have been abundant and in some cases have affected the central components of the system: the personal income tax (1991, 1998, 2006), the corporate income tax (1995, 2006) and the value added tax (1992, 1995, 2010, 2012). Increases in VAT rates have several times been implemented in conjunction with reductions in social security contributions (Alonso et al., 2011).
The democratic period also involved the decentralisation in favour of regional governments, both of expenditure and revenue: several minor taxes at first, and later on also partially the central items of the system have been decentralized. This process finally entailed also the transfer of regulatory capacities in 1996, which have brought about a partial differentiation among regions and a “race to the bottom” in some taxes like the Inheritance Tax (as was previously mentioned).
What do these changes imply in terms of tax burden distribution? According to the predom-inant discourse, or to the logic of a transition from dictatorship to democracy, we should expect an increase in progressivity. That is what political economy models predict (Meltzer and Richard (1981) and subsequent literature). Nevertheless, aspects such as the constantly high weight of Social Contributions, or the more intense taxation of salary income in the Personal Income Tax,11 sustain our hypothesis of a still regressive or near-proportional incidence in 1990, as Manresa and Calonge (2001) obtained. This culmination of the tax reform process is not consistent with the political discourses emanated from the government (which generally present the incidence of the tax system as that expected of its most familiar component, PIT), nor with the most extended opinion among citizens about fairness in taxation.12 My objective is to explore the path by which such scenario was attained.
3
Calculating progressivity
This tax incidence analysis proceeds by imputation of tax revenue (actual payments can generally not be used, due to the lack of data) to the social groups assumed to have borne the corresponding burden. An extensive discussion on tax burden, incidence and other related concepts is not dealt with in this paper for space reasons; for a general survey see Fullerton and Metcalf (2002). I use the results of previous literature to assign tax payments and obtain a profile of effective tax rates by percentiles, and indices of progressivity and redistribution.13 The methodology has some lim-itations, such as the uncertainty on the economic incidence of several taxes and the non-inclusion of possible dynamic effects.14
In what follows, I review the main aspects of the analysis: the temporal dimension, the taxes covered, the incidence hypotheses applied, the income concepts considered and the indicators that are calculated.
3.1
Time span of the analysis
I have chosen several years, on a more or less regular basis, that are representative of the evolution of the tax system between 1960 and 1990. The delimitation of these three decades comes first from the economic periodization of Franco’s regime (as said before, a second phase opens around 1959),
11Related to the bigger possibilities of fraud in other sources, and subsequently aggravated by the –incomplete–
intro-duction of the dual model, which applies a reduced rate to capital income.
12I am following the conclusions of Alvira and Garc´ıa (2005) in this particular aspect, but it is fair to recognise that we
lack more specific information on public attitudes towards progressivity. That is one point intended for future work.
13Progressivity is defined as the increase in the tax rate as income grows, while redistribution is the difference in
in-equality caused by taxation (Lambert, 2001).
14I am taking pre-tax incomes as given, without considering that taxes could have an impact on them through labour
and closes in 1990 since the reform starting in the Transition was then completed (a different cycle begins thereafter, marked by internal decentralization). Finally, the choice of 1982 is due to the availability of micro-data for the Personal Income Tax, permitting a much more exact calculation than for the immediately previous years.15
The analysis performed here is annual all along: both the revenue and the income data refer to 12-month periods. A strand of literature has signalled the variability of income across the life-cycle, and considers that tax incidence is best analysed with yearly taxes on “permanent income” or in a lifetime perspective. Both are choices not taken here. In the first approach, permanent income is normally obtained with an econometric estimation or proxied by the level of actual consumption (Poterba, 1989), and taken as a better indicator of economic capacity, since it varies less. Such an approach would be valid if there were perfect capital markets, which allowed indi-viduals to distribute their total incomes across life in an homogeneous, desired way. Nonetheless, taking this as a baseline assumption seems rather unrealistic.
The lifetime-income-lifetime-burden perspective is conceptually different. It attempts to cal-culate the total amount earned and paid in taxes by an individual throughout her life (Davies et al., 1984; Fullerton and Rogers, 1993). A weakness in this procedure is the inconsistency of tax policy in such a long term, so that it only reflects a hypothetical scenario. However, if it is thoroughly undertaken, the lifetime analysis would allow disentangling interpersonal from inter-temporal redistribution: its results would correspond only to the first one.16
This interpretation is emphasized in Bengtsson et al. (2012), who combine the annual and the lifetime perspectives: as is to be expected, in the second calculation the tax system appears less progressive. However, the Welfare State has an important dimension of inter-temporal, intra-personal redistribution (“income smoothing”; see e.g. Barr, 2004). Both aspects of redistribution are taken into account in this research; therefore, I adopt the annual perspective. It is also less demanding in terms of data (a hard constraint in this case) and more consistent in a context of changing tax policy.
It should be noted that this paper does not consider any dynamics: when discussing the ef-fects of the tax system on income inequality, it is always inside the annual benchmark, between different “phases” of income (which are defined in subsection 3.4). I am not trying to assess the effects of taxation in one year on inequality in subsequent years.
15These micro-data have been used for the years 1982 and 1990 (tax returns filed in 1983 and 1991). They represent
a great source of information, but have some problems of their own. One is the possible miss-representation of the top taxpayers due to the absence of oversampling in the first years (something which has been fixed later on). I have worked with the data provided by the IEF and also with some files kindly sent to me by Jorge Onrubia.
16I am referring to inter-temporal “life-cycle” redistribution, not to redistribution between generations. Such a study
3.2
Taxes considered
The intention of the paper is to present results representative for the whole of the tax system. I am therefore using data on taxes raised by all Public Administrations in Spain: the main ones by the central State (the most powerful taxing unit), and also those levied by the Social Security and sub-central governments (municipalities, provincial administrations and Autonomous Communities). A complete list can be found in table A.1 in the Appendix. Other non-tax public revenue is not included in the analysis.17
A complete disaggregation is not available, specially for local taxes at the beginning of the period (when the tax system was more complex and the statistics are of less quality). All in all, the study covers over 90% of tax revenue for most years.
3.3
Incidence hypotheses
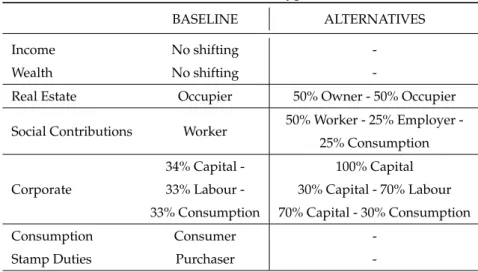
As is well known, the long-term economic incidence of taxes does not necessarily coincide with the legal one. Regrettably, this is a matter which theoretical and empirical works still have not completely clarified (Fullerton and Metcalf, 2002). I have only considered one hypothesis re-garding income, wealth and consumption taxes, since there is quite a wide consensus in applied literature. On the other hand, alternative possibilities are calculated for the most controversial cases: Social Contributions, the Corporate Income Tax and Real Estate taxes (see table 1).
Table 1: Tax incidence hypotheses
BASELINE ALTERNATIVES Income No shifting -Wealth No shifting
-Real Estate Occupier 50% Owner - 50% Occupier Social Contributions Worker 50% Worker 25% Employer
-25% Consumption
Corporate
34% Capital - 100% Capital 33% Labour - 30% Capital - 70% Labour 33% Consumption 70% Capital - 30% Consumption Consumption Consumer
-Stamp Duties Purchaser
-Source: Author’s compilation.
Social Contributions have been the centre of important debate in the country, specially in rela-tion with the causes of unemployment. The quesrela-tion whether employers’ contriburela-tions are borne by them or by the worker (via a smaller net salary) remains unsolved. International literature
17Such as public fees or “special contributions” (occasional payments related to the benefit of a public action; e.g.,
infrastructure construction). The criterion is to circumscribe the analysis to compulsory payments that do not entail a direct benefit to the citizen.
concludes that workers would eventually assume the whole burden (Brittain, 1971; Gruber and Krueger, 1990; Gruber, 1997), but studies with Spanish data show no consensus. Most cited is Argim ´on and Gonz´alez-P´aramo (1987), which states a 100% impact on workers; however, oth-ers have reached different results: for Toharia (1981) there would be shifting to prices, Escobedo (1991) found incidence on salaries around 40% and finally Melguizo (2007) concluded that this was a cost borne by enterprises.
Such diversity does not make it easy to decide on an incidence hypothesis to apply. Neverthe-less, the institutional framework in which Social Security was introduced in the country, together with the evidence on the scarce initial resistance of employers to the contributions (Molinero and Ys`as, 1998) make me turn towards an incidence on workers. According to theory, this would be the result with a very rigid labour supply, which is close to the findings of national and in-ternational empirical work (Fern´andez Val, 2003; Blundell and MaCurdy, 1998). I therefore use total shifting as the baseline hypothesis, but in combination with a mixed alternative, since sev-eral studies point at Social Contributions among the causes of high unemployment in the country (something that would not be the case if they were completely paid by workers). In that sense, the political and institutional change of the years considered might have favoured a decrease in shifting, given that workers’ bargaining power grew with the legalization of labour unions. To-wards the end of the 1970s businesses started to make noisier complaints about the burden of social contributions (Cabrera and Del Rey, 2002). The alternative hypothesis imputes 50% of the tax to employees, 25% to the employer and 25% to consumers (see Appendix C.2).18
Concerning the Corporate Income tax, there is barely any empirical evidence for Spain: only a study from the seventies that concludes shifting to prices (Lagares, 1976). According to the author, such a result would be due to considerable oligopolization in the market. The conven-tional theoretical assumption is that in an economy with fixed capital supply, this factor will bear the burden of the corporate tax, while relaxing that condition makes a portion pass on to labour (Gravelle, 2010). Such shifting can be caused by effects on savings or international capital mobil-ity. The degree of openness of the Spanish economy was increasing during our period of study, but departing from a very low level and being only considerable at the end (with the integration in the EEC). It could therefore be considered plausible that shifting towards labour was weak. However, the lack of solid evidence makes me turn to a balanced incidence between the three possible bearers of the tax. Estimations with the alternative incidence hypotheses are shown in Appendix C.3.
There has also been some discussion in the case of Real Estate taxes. They can be considered a tax on housing services, therefore borne by the tenant in rented properties (this is the “tradi-tional” view). Other authors have maintained that a part of the tax could be falling on the owners and potentially shifted to other forms of capital: in that sense, Mieszkowski (1972) distinguished
18Note that the same incidence hypotheses are applied to both workers’ and employers’ social contributions. Although
studies have always considered the first paid by workers, it is inconsistent with incidence theory to make a distinction among them.
among the nationally homogeneous component in the tax (borne by fixed-supply capital) and the differentials among regions which would fall on the occupiers. In any case, applied literature has mostly imputed this tax on occupiers, be them owners or tenants. However, the Spanish housing market has for a long time had some particularities: since the 1920s rentals were rigidly regulated, with a near general freeze on prices (Artola, 2012; Betr´an, 2002), until liberalization in 1985. This is the reason for the alternative estimation with 50% of the tax paid by owners (Appendix C.4).
3.4
Income and tax concepts
To analyse the incidence of taxation we need data on the distribution of income and wealth among the population. Detailed historical evidence about this issue is scarce until the last quarter of the 20th century. The main source are the Household Budget Surveys (HBS), conducted by the Na-tional Statistical Institute (INE, from now on) more or less on a ten-year basis since 1964. However, they suffer from severe under-reporting, which biases the results that can be obtained with the direct use of the data: therefore, I have previously carried out an upwards adjustment to National Accounts as is described in Torregrosa (2013). I have only used the micro-data from 1973-74, 1980-81 and 1990-91 (adjusted to the income and price levels of 1970, 1982 and 1990). The original files of the 1964 survey are lost and only aggregate published information can be found.
In this paper, income is used as an indicator of economic capacity by which to rank households (pre-tax incomes) and also to impute tax payments. The following phases are distinguished:
• PRE-TAX INCOME = Gross Monetary Income (Net Monetary Income + Factor Taxes & So-cial Contributions) + Imputed Income (Self-production + Owner-occupied housing) • NET FACTOR INCOME = Pre-Tax Income – Factor Taxes & Social Contributions • POST-TAX INCOME = Net Factor Income – Consumption Taxes
• DISPOSABLE INCOME = Net Factor Income + Public Benefits + Transfers
• POST-TAX-AND-TRANSFER INCOME = Disposable Income – Consumption Taxes Factor taxes are those direct taxes falling on the households’ production factors (e.g. wages or capital income), while consumption taxes are paid in the process of acquiring goods or services. This distinction is close to the legal definition of direct and indirect taxes, but does not match it exactly: among consumption taxes I include the share of direct taxes of corporations that are shifted onto consumers (following the incidence hypothesis of the Corporate tax).
The Post-tax income used here is a statistical construction, not perceived as such by the house-holds, since indirect taxes are paid during consumption out of Disposable income. But it is a necessary concept for the goal of this paper: the comparison of inequality in Pre-tax income and Post-tax income, before adding public benefits and other similar flows, allows an assessment of the distributive effects of the tax system. This is contrary to what happens in real economic life, but it is the way to isolate taxation from public and private transfers. Gini indices for Dispos-able income and for Post-tax-and-transfer income are also shown in the paper, because of their
importance as a reflection of consumption capacity. But I do not consider them suitable to anal-yse tax incidence (this would be incomplete since it only includes personal direct taxation, and confounds the effects of public revenue and expenditure).
A further word has to be said about public benefits. A part of them corresponds to Pre-tax income (the capitalization component), while another (the redistribution one) is a transfer from the State and belongs only to Disposable income. It is out of the scope of this paper to distinguish among both: I have considered all of them as redistributive transfers.19 However, an alternative estimation is performed in Appendix C.5 which places pensions as part of Pre-tax income.
One important question is household size: a sensible ranking should use “equivalent income” (household income divided by “equivalent household size” to obtain an adjusted per capita value that takes into account economies of scale within the family). Households are then weighted by their (real) size, so as to give the same importance to all individuals in the conclusions regardless of the family they belong to. I am using OECD’s scale, which gives value 1 to the first adult, 0.7 to the subsequent ones and 0.5 to the minors in the household (up to 14 years old). The choice is consistent with empirical results based on Spanish data (Bosch-Domenech, 1991; Duclos and Mercader-Prats, 1999; Labeaga et al., 2004).
3.5
Indicators
I calculate the following indicators (most widely used in related literature): • Average Effective Tax Rates by income range:
AET Ri=
Σ(Ti/Yi)Wi ΣWi
, i = 1...N ,
where Tiis total tax payments by household i, Yiher total pre-tax income, Wiher weight in the calculation (given by the product of sampling weight ρ and the household’s real size Si), and N is the total number of households in the range. The graphic profile of these AET Rs is a very illustrative approach to the distribution of the tax burden: a tax is progressive if they grow with income, as was first stated by Musgrave and Thin (1948).
• Kakwani index (1977): progressivity indicator based on the Lorenz curve. It is obtained as the difference between the concentration index of tax payments CT and the Gini index of Pre-tax income GY:
K = CT − GY
It takes value 0 for a proportional tax, positive for a progressive one.
• Reynolds-Smolensky index (1977): redistribution indicator. GY being the Gini index for Pre-Tax income and GY −T the corresponding Gini for Post-tax income, it is defined as:
RS = GY − GY −T
A tax is redistributive if RS>0. This change in inequality can be decomposed as follows: GY − GY −T = (GY − CY −T) − (GY −T− CY −T) = V E − RR,
where CY −T is the concentration of Post-tax income with households ranked by Pre-tax incomes. Here the component V E captures the Vertical Effect (redistribution among house-holds keeping them ranked by Pre-Tax income) and RR is the Re-Ranking Effect. If RR is positive (households get ordered differently as a result of horizontal inequity), V E overes-timates (underesoveres-timates) the decline (increase) in inequality caused by taxation.20
The redistribution index RS is related to the progressivity index K in the following way: RS = t
(1 − t)K − RR
The preceding equation shows how redistribution is a combined result of progressivity (K) and tax burden (“level” effect given by t) – and the possible re-ranking. It is important to keep this relation in mind, since the different indicators can evolve in counter-intuitive ways (e.g., getting more progressive but less redistributive, as a result of a decrease in the tax rate).
For all calculations, I have taken Equivalent Pre-Tax incomes as a reference.21 Related to this, one last caveat should be made: since my calculations for each year involve a different distribu-tion of income along with different tax reguladistribu-tions, the evoludistribu-tion in all the indices is a joint effect of both. That is, an increase in progressivity cannot be directly attributed to changes in the nor-mative system, since the evolution of tax bases also plays a role (which could be coincident, or counteracting). There are proposals in the literature to disentangle both effects, which is a point left for future work (Dardanoni and Lambert, 2002; Kasten et al., 1994; Seidl, 1994). The same issue, of course, is present when comparing the effect of tax systems in different countries.
4
Results
In this section I review the main findings of my calculations. First, the above-mentioned tax progressivity indicators are shown for the three benchmark years 1970, 1982 and 1990 (1960 is not included here because of data constraints). In a second subsection I turn to consider transfers together with taxes (as a negative tax), to make an approximation to the joint distributive effect of the fiscal system. Finally, the changes undergone in taxation during the 1960s are analysed, allowing some conclusions about the evolution of progressivity during the decade.
20All indices have been calculated in Stata, using the ‘progres’ module available online (Peichl and Van Kerm, 2007). 21Making a sequential analysis might be misleading, since the order of the calculations has an impact on the results (we
would not get the same indices for indirect taxes if we compared the tax payments with incomes net of direct taxation). Many taxes are simultaneously paid, so it would be an arbitrary choice. This point is made by Onrubia et al. (2013).
4.1
The tax system between 1970 and 1990
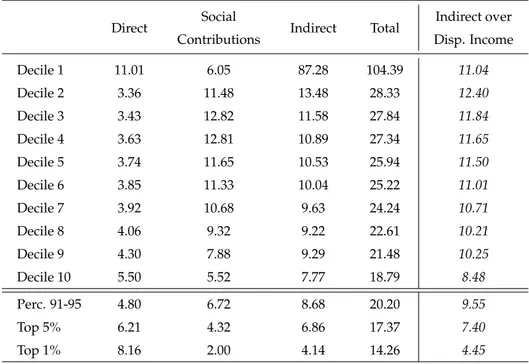
Average Effective Tax Rates by deciles of equivalent income are shown in tables 2, 3 and 4. The top decile is further disaggregated, in its two halves and also distinguishing the top 1% of households, because it presents a huge dispersion in incomes which makes the rates vary considerably inside it. This allows observing a continuity in the progressivity of direct taxation and the regressivity of the other components, which are driving the total. Focusing on the top is also important because these taxpayers concentrate a significant portion of total income, and of tax payments.
Table 2: Average Effective Tax Rates in 1970
Direct Social Indirect Total Indirect over Contributions Disp. Income Decile 1 11.01 6.05 87.28 104.39 11.04 Decile 2 3.36 11.48 13.48 28.33 12.40 Decile 3 3.43 12.82 11.58 27.84 11.84 Decile 4 3.63 12.81 10.89 27.34 11.65 Decile 5 3.74 11.65 10.53 25.94 11.50 Decile 6 3.85 11.33 10.04 25.22 11.01 Decile 7 3.92 10.68 9.63 24.24 10.71 Decile 8 4.06 9.32 9.22 22.61 10.21 Decile 9 4.30 7.88 9.29 21.48 10.25 Decile 10 5.50 5.52 7.77 18.79 8.48 Perc. 91-95 4.80 6.72 8.68 20.20 9.55 Top 5% 6.21 4.32 6.86 17.37 7.40 Top 1% 8.16 2.00 4.14 14.26 4.45
Source: Author’s calculations.
Deciles of individuals by Equivalent Pre-Tax income. The rates are calculated dividing household tax payments by total pre-tax income, except in the last column, where the denominator for indirect taxes is household dis-posable income. This might be more intuitive since it is the flow they are paid out of, and can serve to make comparisons with specific works about indirect taxation.
’Direct’ includes all taxes paid on income and wealth by households and corporations (of which the main are the Corporate Income Tax and the Payroll Tax), ’Social Contributions’ includes those of employers, workers (including the unemployed), civil servants and the self-employed. ’Indirect’ means all taxes incurred in the consumption of goods and services (the main being Tariffs, the Luxury Tax and the General Sales Tax). For a complete list, see table A.1.
The first feature in the tables is that total tax rates faced by families are bigger in the first deciles that in the upper ones. The rates estimated for the lower levels of income are very high, even above 100% in some cases, because such households are basically consuming out of public or private transfers and have very scarce or null market income. But even leaving the first decile aside, this downward slope in rates happens all over the period: taking as reference the second and tenth deciles, in 1970 the AETRs go from 28.33% to 18.79%, in 1982 from 45.29% to 32.32% and in 1990 from 67.37% to 43.85%. The tax system was regressive all along, placing more burden on low-income classes. This conclusion is even clearer if we turn to the greater disaggregation of
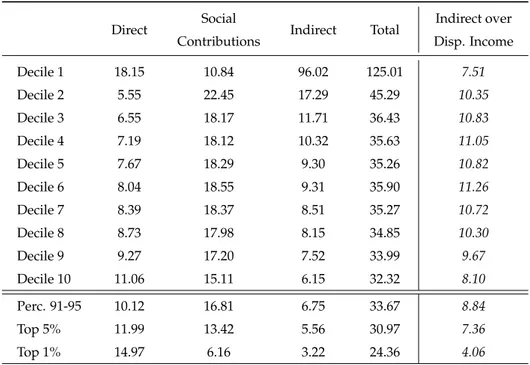
Table 3: Average Effective Tax Rates in 1982
Direct Social Indirect Total Indirect over Contributions Disp. Income Decile 1 18.15 10.84 96.02 125.01 7.51 Decile 2 5.55 22.45 17.29 45.29 10.35 Decile 3 6.55 18.17 11.71 36.43 10.83 Decile 4 7.19 18.12 10.32 35.63 11.05 Decile 5 7.67 18.29 9.30 35.26 10.82 Decile 6 8.04 18.55 9.31 35.90 11.26 Decile 7 8.39 18.37 8.51 35.27 10.72 Decile 8 8.73 17.98 8.15 34.85 10.30 Decile 9 9.27 17.20 7.52 33.99 9.67 Decile 10 11.06 15.11 6.15 32.32 8.10 Perc. 91-95 10.12 16.81 6.75 33.67 8.84 Top 5% 11.99 13.42 5.56 30.97 7.36 Top 1% 14.97 6.16 3.22 24.36 4.06
Source: Author’s calculations.
Deciles of individuals by Equivalent Pre-Tax income. The rates are calculated dividing household tax payments by total pre-tax income, except in the last column, where the denominator for indirect taxes is household dis-posable income.
’Direct’ includes all taxes paid on income and wealth by households and corporations (of which the main are the Personal Income Tax and the Corporate Income Tax), ’Social Contributions’ includes those of employers, workers (including the unemployed), civil servants and the self-employed. ’Indirect’ means all taxes incurred in the consumption of goods and services (the main being the General Sales Tax, Excises and Tariffs). For a complete list, see table A.1.
the tail of the distribution: the top 1% paid 14.26% of their pre-tax income in taxes in 1970, 24.36% in 1982 and 37.86% in 1990 – i.e., their rates where near half of those faced by the second decile of taxpayers.
Regressivity was the combined effect of very different taxes, driven by social contributions and consumption taxes. The latter fell overwhelmingly on the poor in spite of mitigating aspects in legislation such as the Luxury tax or the different tax rates in VAT.22 This feature is an un-surprising effect of consumption being less unequally distributed in society than pre-tax income. Since disposable income is less concentrated, tax rates in the last column of each table appear less markedly decreasing, but they are still so because of the different propensities to save and consume.
Something similar happens with social contributions, which are considered here to fall on labour (alternative estimation in Appendix C.2). The burden of this tax is largely determined by
22When it was first introduced in 1986 they were: 6% for foodstuff and other favourably treated goods, 12% for general
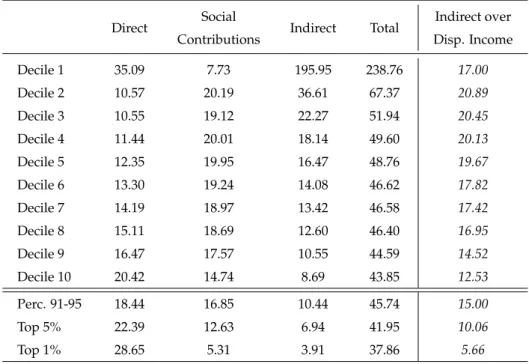
Table 4: Average Effective Tax Rates in 1990
Direct Social Indirect Total Indirect over Contributions Disp. Income Decile 1 35.09 7.73 195.95 238.76 17.00 Decile 2 10.57 20.19 36.61 67.37 20.89 Decile 3 10.55 19.12 22.27 51.94 20.45 Decile 4 11.44 20.01 18.14 49.60 20.13 Decile 5 12.35 19.95 16.47 48.76 19.67 Decile 6 13.30 19.24 14.08 46.62 17.82 Decile 7 14.19 18.97 13.42 46.58 17.42 Decile 8 15.11 18.69 12.60 46.40 16.95 Decile 9 16.47 17.57 10.55 44.59 14.52 Decile 10 20.42 14.74 8.69 43.85 12.53 Perc. 91-95 18.44 16.85 10.44 45.74 15.00 Top 5% 22.39 12.63 6.94 41.95 10.06 Top 1% 28.65 5.31 3.91 37.86 5.66
Source: Author’s calculations.
Deciles of individuals by Equivalent Pre-Tax income. The rates are calculated dividing household tax payments by total pre-tax income, except in the last column, where the denominator for indirect taxes is household dis-posable income.
’Direct’ includes all taxes paid on income and wealth by households and corporations (of which the main are the Personal Income Tax and the Corporate Income Tax), ’Social Contributions’ includes those of employers, workers (including the unemployed), civil servants and the self-employed. ’Indirect’ means all taxes incurred in the consumption of goods and services (the main being the Value Added Tax and Excises). For a complete list, see table A.1.
the distribution of salary income. But it was not proportional to it, since the amount to be paid was not assessed on wages. Up to 1972, the social contributions payable were calculated upon a base (Base Tarifada) which was equal for everyone in the workforce of the same category (there were ten of these categories for industry and services workers, something which obviously did not correctly reflect differences in pay). During the seventies the system was reformed so that the base grew closer to real salaries, but the implementation of this idea took a long transitional period and was never really completed. Since 1977, the taxable base is the salary (but not all of its components), with both a lower and an upper cap for each category, which still distort proportionality for the lower and the better paid workers.23
Direct taxes had the opposite behaviour: they imposed a greater percentage burden on richer individuals. The first decile is an exception, though: here, the high burden is a result of very low pre-tax incomes combined with the shifting of Real Estate and Corporate taxes on the prices of housing and consumption goods. But from the second decile on, direct tax rates are increasing.
This was already true in 1970, albeit slightly (the tax rate faced by the top decile was 5.50% while for almost all the rest of the distribution it was between 3% and 4.3%). In 1982 the upward trend across deciles was much more visible, and even more so in 1990 (top decile tax rates had gone up to 11.06% and 20.42%, while those in the second decile were 5.55% in 1982 and 10.57% in 1990). This component of the Spanish tax system was indeed progressive, specially after the reform in direct taxation undertaken during the political transition was consolidated. Several works have found so for the Personal Income tax (Argim ´on and Mar´ın, 1989; Casta ˜ner, 1991; Onrubia et al., 2007).24
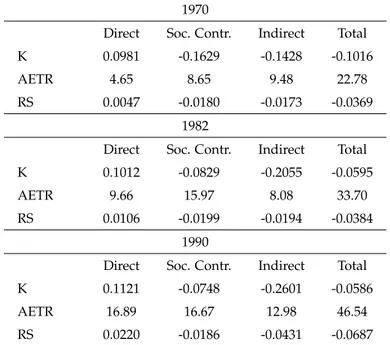
Progressivity and redistribution indices in table 5 confirm and clarify these observations. The tax system became less regressive between 1970 and 1990 (the Kakwani index is negative in all years, but its absolute value becomes smaller over time). This was mainly due to the 1977-78 reform in direct taxation and also to the above-mentioned changes in the Social Security contribu-tory system. On the other hand, indirect taxes became more regressive, even during the seventies in the absence of significant reform. This result can thus be attributed to some extent to changes in the underlying structure of consumption: more households started consuming items that were taxed under the Luxury tax, and specially a reduction in overall expenditure inequality (favoured by the development of Welfare State transfers in the second sub-period) paradoxically had the same effect.25 Tax regressivity was mitigated but persisted, being more intense at both ends of the income distribution.
Average Effective Tax Rates for each category are displayed in the second row to show how direct taxation was powerless to impact positively on the income distribution, when compared to the weight of the other components. Social contributions grew a lot, specially during the sev-enties, and consumption taxes were reinforced in 1979 and 1986 (introduction of VAT). The re-gressive elements outdid the prore-gressive ones. All in all, this means that taxation effected an inverse redistribution not only in 1970 but also in 1982 and 1990, in the first years of the new par-liamentary regime and after it was consolidated. The Reynolds-Smolensky index became larger in absolute value over time, because of the increase in the tax burden: in 1970 taxation increased the Gini index in around 3.7 points, 3.8 in 1982, and 6.9 in 1990. This is a very significant impact.26 Table 6 displays inequality along the previously defined income phases. The difference
be-24This tax, however, was affected during the eighties by significant fiscal drag, which made it less progressive (by
bringing up mostly the rates of taxpayers at the bottom), but also more redistributive (because of the increase in the average tax rate and therefore in the quantities involved). See e.g. Gonz´alez-P´aramo (1988) and Salas (1997).
25The Gini index for total consumption among individuals was 35.09 in 1970 and had gone down to 33.13 by 1982 and
32.06 by 1990. Increasing regressivity in indirect taxation was already observed by Argim ´on et al. (1987) when comparing their results for 1980 with those of Perona (1972) for 1965. A similar observation on increasing negative impact of indirect taxation was made for the case of the UK in the 1980s and 1990s by Glennerster (2006).
26I have also calculated the progressivity indices excluding from the sample those households with very small ratio
Pre-Tax Income / Total Expenditure (those who have rates well over 100%), to make sure their high AETRs are not driving the results. Choosing 0.05 as the cutting point means excluding 3-5% of the households for each year and does not change the conclusions of the analysis.
Table 5: Progressivity and redistribution over the period
1970
Direct Soc. Contr. Indirect Total K 0.0981 -0.1629 -0.1428 -0.1016 AETR 4.65 8.65 9.48 22.78 RS 0.0047 -0.0180 -0.0173 -0.0369
1982
Direct Soc. Contr. Indirect Total K 0.1012 -0.0829 -0.2055 -0.0595 AETR 9.66 15.97 8.08 33.70 RS 0.0106 -0.0199 -0.0194 -0.0384
1990
Direct Soc. Contr. Indirect Total K 0.1121 -0.0748 -0.2601 -0.0586 AETR 16.89 16.67 12.98 46.54 RS 0.0220 -0.0186 -0.0431 -0.0687
Source: Author’s calculations. Using Pre-Tax Equivalent incomes, and weight-ing by family size (thus reflectweight-ing the distribution over individuals). K: Kakwani index; AETR: Average Effective Tax Rate; RS: Reynolds-Smolensky index.
tween Pre-tax and Post-tax income Gini indices equals the RS index shown above. Both in 1970 and 1982, the first two differences (between columns 1 and 2, and between column 2 and 3) are negative: inequality increases. This is related to the scarce distributive impact of direct taxes, which are mostly accounted for in the difference between the first two columns.27 In 1990, how-ever, the story seems to have changed in this respect: Net Factor income is now less unequal than Pre-tax income, reflecting the increase in the redistributive effect of direct factor taxation (driven by the growth in the AET R). The general impact on Post-tax incomes, nevertheless, is still nega-tive. So it can be said that what the tax system did in one phase, it undid in the following.
Table 6: Taxation and income inequality
PRE-TAX NET F.I. POST-TAX DISP.I. P-TRANS 1970 39.20 40.39 42.89 36.02 37.69 1982 44.59 45.13 48.43 36.28 38.08 1990 44.54 43.06 51.41 35.01 39.59
Source: Author’s calculations. The table displays Gini indices for the dif-ferent (equivalent) income concepts, weighted by individuals. ’P-TRANS’ stands for Post-Tax-and-Transfer income.
27It is not possible to disentangle here direct taxes falling on factor income from social contributions, since they are
Of course, this does not mean that the overall effect of the public sector towards the lower classes was extractive. Welfare State development was the other side of the coin to this augmented taxing power. Benefits were extended and public education and health systems were funded, so the expenditure side of the budget allowed for improvements in income distribution and towards equality of opportunity. I turn to this now.
4.2
Considering the effect of benefits
According to table 6 the distribution of disposable income did not change much in the period, as was obtained in Torregrosa (2013). The change in the Gini index from net factor incomes is only partly an effect of State benefits, since it arises from adding both public and private transfers (they are not disaggregated in HBSs until 1990, so ‘transfers’ can include e.g. remittances sent by emigrants). As a whole, these flows caused a decrease in inequality among individuals of around 4 Gini points in 1970, 10 in 1982 and 8 in 1990 (difference between columns 2 and 4 in table 6). So, what the fiscal system did in one phase, it undid in the following?28
Post-tax-and-transfer income is the net result of all these flows, the inequality finally exist-ing in the country (in terms of consumption capacity). The total tax-and-transfer system had an equalizing effect; but, interestingly, this was higher in 1982 (6.51 Gini points) than in 1990 (4.95) – and 1970 (1.51) –, in part attributable to the increase in regressivity of indirect taxation. This “final” income has grown more unevenly distributed over the decades under study, but less than market incomes (1.90 vs. 5.34 Gini points).
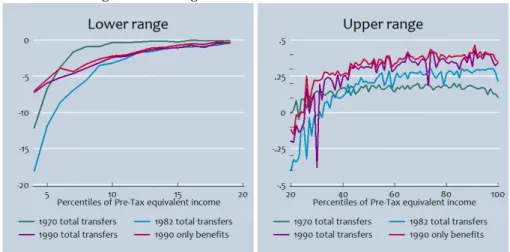
Figure 4 tries to cast some further light on the issue. It plots tax rates computed including transfers as a negative tax. Working with the public-private aggregate means that progressivity is underestimated, since the distribution of total transfers is less concentrated on the lower classes than that of benefits. For the year 1990, I include two calculations, one with the total (comparable to those of the previous years) and one considering only public benefits (a better representation of the tax-and-transfer system in place at the time).
Here, the percentiles with positive rates are net contributors: approximately the upper 75-70% of individuals. The ones with rates under zero, on the contrary, received more money than they paid in taxes. These rates –contrary to the tax rates– are growing with income, entailing that the fiscal system did provide redistribution (as was shown by the Gini indices above). But we still can see a final negative-slope stretch in 1970 and also in the more recent years (although now circumscribed to the very top percentiles).
The fiscal system in 1970 was clearly less progressive than in later years, since the profile is flatter and the line crosses 0 earlier in the income distribution (which means that households
28In 1990, public benefits were a very significant part of total transfers received by households: 89.5% according to the
HBSs. It is however possible that for the earlier years this percentage was lower (given the development of the Welfare State after the political transition). This entails that the “redistribution” shown by the different Gini indices is likely to be an upper bound, higher than that caused solely by public funds, and that the bias is probably decreasing over time.
Figure 4: Average Effective Tax-and-Transfer Rates
Source: Author’s calculations.
The lowest percentiles are not included because their extreme values would make the first graph unreadable.
being net contributors back then were poorer than their counterparts in the following decades, both in relative and in absolute terms). We can also see that among net-recipient households the rates were clearly lower in 1982 than in 1990. This presumably is not so much the result of a loss of generosity in the welfare system, as of the increase in tax rates for the poorer households which followed the introduction of VAT. Thus reinforcing the convenience of analysing both aspects together: the distribution of tax payments as much as what they are financing.29
In-kind benefits, which are mostly considered as inequality-reducing, are not included in any of these calculations. Thorough approaches to the incidence of total social public expenditure can be found e.g. in Bandr´es (1993), Estruch (1996) or Calero (2001). Following those authors, we know that expenditures on Health are highly progressive, those on Education are so to a lesser extent; and Social services are very concentrated on the lower deciles, but their scarce budget limits redistributive potential. According to Bandr´es (1993), in-kind social expenditure would have reduced the Gini index in 3.61 points in the year 1980; the decrease would have been 0.74 in 1990 and 3.99 in 1994 (Estruch, 1996 and Calero, 2001 respectively). These impacts are in any case smaller than those of monetary benefits, which stand between 6 and 15 Gini points in the same studies.30
29In fact, and quite surprisingly, if we compare the mean of post-tax-and-transfer incomes by deciles between 1982 and
1990 (in real terms) we can see that the poorest households actually lost net purchasing power during the decade. This does not seem so when looking at disposable income figures, but it comes through once taking into account the impact of indirect taxation.
30The cited works make an imputation of monetary public transfers that goes far beyond my simple exercise above using
the data in the survey. Regrettably, their results cannot be readily integrated with mine because of a different procedure of adjustment of the original income data and other methodological choices. For an analysis on monetary benefits that takes into account the difference between contributory and non-contributory items, see Gimeno (1996).
It can therefore be said that the public sector as a whole impeded the increase in market-given inequality to be completely translated onto Post-tax-and-transfer incomes. But it certainly does not seem to have done so by means of the tax system, and did not manage to counteract the trend of rising inequality.
4.3
Some insights into the 1960s
What can be said about the evolution in the decade preceding my first estimation? We can get an impression by examining tax revenue data: probably, regressivity increased during this decade, due to two concurrent changes. On the one hand, a growth of indirect relative to direct taxation: the balance between direct and indirect revenue went from 68.9% to 53.3% (in the period 1960-70).31 This change had already culminated by the middle of the decade, so it cannot be attributed to the 1964 tax reform: it could more likely be due to a loss of direct taxation efficiency, related to evasion and the “freezing” of tax bases resulting from estimation procedures.
Another composition effect arises from the Social Security Law and the consequent increase in social contributions, which caused a major transformation in the tax structure of the country (see figure 1). Because these taxes were borne by labour to a great extent, they had an undoubt-edly negative impact on the distribution of net incomes (notwithstanding their being the basis to finance more generous pensions in the decades to come). However, as was said back in section 2, some of the apparent change is an effect of deficiencies in the data previous to the 1967 reform, which implied unified accounting of different insurance systems, so the real change in this sense might not be as intense as it seems.
The inner progressivity of the components of the tax system is difficult to evaluate without more detailed data (specially, on the distribution of income). In any case, a comparison with the work by Perona (1972) for the year 1965 allows getting a little closer to the question. In figure 5 I plot tax rates by income ranges for 1965 and 1970. The latter have been obtained replicating Perona’s methodology, so they are not directly comparable to those in table B.1. I have left aside non-central taxes, established the household as the unit of analysis (as opposed to equivalization of incomes and individual weighting in my own estimations), grouped them based on disposable income (as opposed to pre-tax) keeping the same percentage of households in each range,32and used as denominator for the tax rates “wide” pre-tax income (which includes non-monetary items
31In real terms, indirect tax revenue multiplied by a factor of 2.3, while direct taxation did by 1.8. This resulted in a
slight loss of direct tax pressure relative to GDP (from 4.85 to 4%), whereas the opposite happened on the indirect side (7.03 to 7.48%).
32These are not deciles. Perona’s work divided households by income ranges of around 30.000-60.000 ptas.
Approxi-mately, range 1 corresponds to the first decile, range 2 to deciles 2 and 3, range 3 to deciles 4 to 7, range 4 to deciles 8 and 9, and the three upper ranges to the top decile.
and all public and private transfers).33 Some differences in the procedures remain, however.34 Figure 5: Average Effective Tax Rates over the 1960s
Source: for 1965, Perona (1972); for 1970, author’s calculations.
Households are ranked by disposable income, but the denominator for the tax rates is wide income (defined as total pre-tax income plus all transfers).
If we accept Perona’s results as a good approximation to tax rates in 1965, we can see a lack of change in direct taxes (neither in their profile nor in the average tax burden imposed), while indirect tax rates grew over all ranges. Social contributions also experienced a very significant increase (with the average tax burden going from 4% to around 8%), specially affecting the lower income classes. In terms of total tax rates, what looked somewhat proportional in 1965 gave way to a regressive profile in 1970.35 We can therefore conclude that there was an increase in regressivity during the decade, caused by the changing composition of the tax system.
5
How different was Spain from other countries?
Comparing my results to those of similar studies is the natural next step. How does the partic-ular case of Spain compare with its geographical and cultural neighbours, the countries it has economic relations with, and the ones it took as a model at the time of the tax reform? These were countries with different levels of inequality, and contrasting political systems and histories. Not only inter-temporal, but also international comparisons, are essential tools for trying to under-stand socio-economic development.
The European countries are the first candidate for this, because they were taken as a model
33This “wide” income definition is the same used in the alternative estimation in appendix C.5. 34Concerning incidence hypotheses and the details of the imputation procedure.
35Recall that this is over “wide” income: over pre-tax incomes, the system in 1965 would also be regressive, since
transfers represent a bigger percentage of income for the lower ranges (i.e., their pre-tax incomes are smaller than their “wide” incomes by a bigger amount, bringing up their effective tax rates).