Software-De
Jammers f
Antonio Di Fonzo, Mauro Leona
Galati
Tor Vergata University - Electronic E Department
Via del politecnico, 1 - 00133 Ro difonzoantonio.87@tiscali. [email protected];gaspare.galati
Abstract— It is well know that jamming i
cost attack method against GNSS-based appli years these types of attacks have increased s the availability of GPS jammers that can be example, on the internet and due to the consta GNSS-based applications . Usually a jamming in-car jammer, is a quite simple electronic de single frequency tone or some type of chirp sig signal can be considered as an instantaneous can be mitigated with very simple processin Time Fourier Transform. These considera development of an equipment able to reduce harmful signals over a generic GNSS receiver t Defined Radio (SDR) equipment. In thi introduction to the problem is presented and mitigation technique is shown along with some in-car jammers.
Keywords—GNSS, GPS, SDR, Jamming, ST
I. INTRODUCTION In 2009 a satellite-based positioning aircraft landing at Newark airport suffered breaks. After two months of investigation Aviation Authority it was discovered that a tr the nearby highway every day had a ch onboard causing a serious integrity threat GNSS-based infrastructure.
In 2010 the Guardian wrote: "Criminal using GPS jammers imported from China t expensive cars and lorries carrying valuable l fears that terrorists could use more powerful air traffic…”.
Obviously the use of jammers is illegal but these devices are gaining popularity to a increase in insurance costs, as well as any tra based monitoring.
efined-Radio technique
for in car GNSS naviga
ardi, Gaspare
Engineering me Italy it; [email protected]Paola Mado
Tecnologie ne TRS spa Via della Bupaola.madonna@
is an easy and low ications. In the last significantly due to e easily found, for ant growth of in-car g device, also called evice which emits a gnal. These types of s narrow band and ng, based on Short ations lead to the the effect of these through a Software is paper a brief d a time-frequency e results for a set of
TFT.
infrastructure for d from brief daily
ns by the Federal ruck passing by on eap GPS jammer t to such critical
gangs have begun to help them steal loads and there are
versions to disrupt
in most countries avoid road tolling, acking and location
Detection and mitigation o by these devices could be o demanding activities in the inc research.
Most of low cost in-car hardware and produce simple aim of this work is to analyze mitigation techniques for thes idea is to put a software de antenna and a GNSS receive interferences.
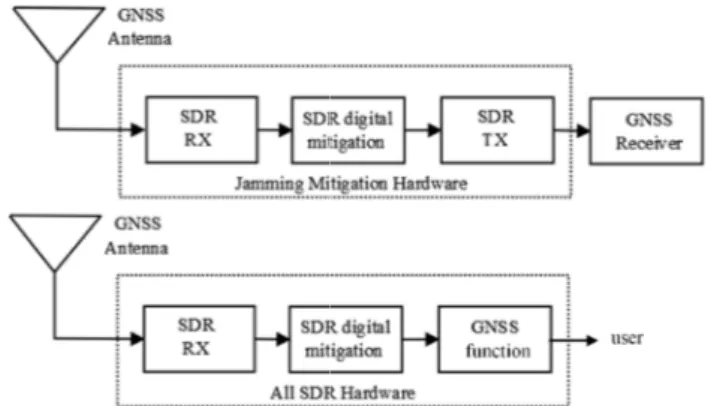
In Figure 1 two possible im jamming mitigation are shown version that can be put into receiver chain. The seco implementation of a self-conta the GNSS receiver is a SW i itself.
Fig. 1. Possible HW implementat
es against
ation
onna,
Luca Sfarzo
elle Reti e nei Sistemiufalotta, 378 - 00139 Roma @trs.it; [email protected]
of interference signals produced one the most challenging and coming years of GNSS applied
jammers have a very simple e but still harmful signals. The
the use of an SDR HW to test e intentional interferences. The efined radio between a GNSS er to detect and mitigate these
mplementation schemes for SDR n. The first one is a "retrofit" o an already existing antenna-ond scheme represents the
ained SDR equipment in which implementation inside the SDR
II. JAMMERS ANALYSY Before introducing the HW and SW mit an analysis of jammer and signal types is ne deals with some existing in-car jammers; divided in two parts: the first refers characterized in [1] and the second refers available in the TRS (Tecnologie nelle Re S.p.A. laboratories.
Among the jammers analyzed and clas paper focuses on the following three main cla
• Class I: Continuous Wave Signal • Class II: Chirp signal with one saw-• Class III: Chirp signal with
functions.
Their characteristic parameters are shown are: sweep time, center frequency, bandwidt power. Sweep time is the time to accom change of frequency (for class II and III frequency is the frequency band center.
TABLEI.PARAMETERS OF THE CONSIDERED IN-CA
N Class Center Frequency fo [GHz] Bandwidth 1 I 1.5747594 0.92 KHz 2 I 1.5744400 0.92 KHz 3 II 1.57507 11.82 MHz T 4 II 1.57194 10.72 MHz T 5 III 1.57130 10.02 MHz Ts T
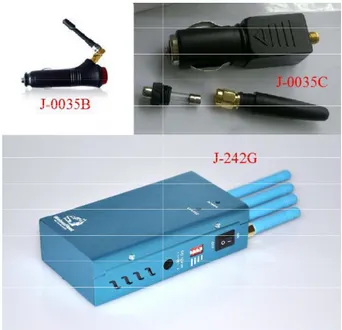
The in-car jammers available in TRS S.p 2, were analyzed in the frequency/time dom oscilloscope (LeCroy WaveRunner 204 Bandwidth, 4 Input Channels, 10GS/s Max and an RF attenuator to attenuate the in measuring instrument.
S
igation techniques eeded. This section in particular it is
to the jammers s to the jammers eti e nei Sistemi)
ssified in [1], this asses:
-tooth function multi saw-tooth
n in Table I. They th and output peak mplish a complete jammers); center AR JAMMERS Sweep Time [µsec] Pt [dBm] - -12.1 - -25.6 Tsw=11.71 -14.4 Tsw =8.62 -30.8 w1=8.7 Tsw2=34.8 -19.3
p.A., shown in Fig. main with a digital 4MXi-A 2 GHz
x Sampling Rate) nput signal to the
Fig. 2. In-car ja
In Figure 2, each jammer model as on the producer’s we belonging to the category of na
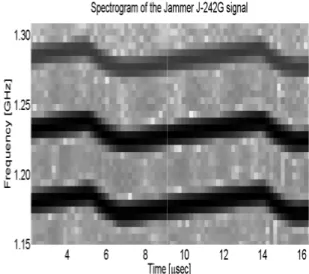
The first jammer (J-0035B signal in the L1 band, as shown tooth function which describe The bandwidth of this signal i time is about 40 µsec with 37 time. The spectrogram, as sho by recording the signal sampl and processing them with spectrogram was computed length 2048 samples and an windows of 100 samples on a s 5 GHz.
Fig. 3. Spectrogram
ammers analyzed
has an ID which indicates the eb site; they all produce signals arrowband interference.
B) transmits bidirectional chirp n in Figure 3, with a multi saw-es the instantaneous frequency.
is about 25 MHz and its sweep 7 µsec rise time and 3 µsec fall wn in Figure 3, was performed es with the digital oscilloscope Matlab. In more detail, a with a Hamming window of n overlap factor between the signal sampled at a frequency of
The second jammer (J-0035C) transmits the L1 band, with a 12 MHz signal bandw unidirectional chirp with a sweep time of the bidirectional chirp transmitted by the analyzed. The spectrogram is shown in Figur
Fig. 4. Spectrogram of jammer J-003
Unlike the single frequency jammers 0035C, as shown previously) the last jamme 242G, is a multi-frequency jammer. It has fo control switch which enables (or not) antenna. It transmits bidirectional chirp L1/L2/L3/L4/L5 bands with a multi saw-to fourth antenna is of particular interest bec three chirp signals in the L2, L4 and L5 band spectrogram of Figure 5. The procedur spectrogram is the same as the previous case frequency is 10 GHz. The sweep time is the chirp signals (about 9 µsec).
s a chirp signal on width; this is an 20 µsec versus of jammer J-0035C re 4. 35C (0035B and er analyzed, the J-ur antennas with a each transmitting p signals in the ooth function. The
cause it transmits ds as shown in the re to obtain the e, but the sampling
same for the three
Fig. 5. Spectrogra
In Table II the measured pa reported.
TABLE II.PARAMETERS OF THE IN-CAR
Name Class Antenna
J-0035B III 1 J-0035C II 1 J-242G III 1 2 3 4 III. SDRHW The proposed experimenta National Instruments USRP 29 in the L1 band for the C/A co has both RX and TX chann frequency range between 5 sampling frequency up to 100 implement both architectures p the TX channel). The only add antenna, a power supply for th an "in-cable amplifier".
The selected antenna is the amplifer, with a gain of 33 dB A11 that has a gain of 30 dB
am of jammer J-242
arameters for these jammers are
R JAMMERS ANALYZED IN TRS SPA
f0 [MHz] Band width [MHz] Sweep-time [µsec] 1581.86 25 40 1576.38 12 20 1573.74 15 9 1202.03 15 1277.42 15 1227.5 15 1279.5 15 1176 15 W DESCRIPTION al SDR HW is based on the 920 and is intended to work only
ode. This programmable device nels capable of working in a 0 MHz and 2.2 GHz with a 0 MSps [2]. This HW allows to
proposed in Figure 1 (thanks to itional HW required is an active he antenna and (recommended)
e L1A-GPS that has a low-noise [3]; the selected amplifer is the B [4]; the amplifier is equipped
with an internal bias-tee that provides the power to the antenna. Within the USPR the signal can be downconverted to an intermediate frequency and sampled. The sampled signal is transferred to the host computer that can be programmed with the desidered algorithms, then the signal can be:
- upconverted to the L1 frequency and transmitted with the USRP TX or
- sent directly to the GNSS receiver algorithms (for example the algorithms proposed by Borre in [5]) to perform the signals acquisition, tracking and PVT estimation.
Knowing the Maximum Input Power (MIP) for USRP-2920, that is 0 dBm [2], and the power trasmitted from the various jammers (Table 1) it is possible to calculate the minimum distance that produces an USRP saturation (DSAT).
When the USRP is in saturation it is impossible to implement any mitigation tecnique due to the distortion of the incoming signals. This is the bottom limit under which the jammer cannot be mitigated.
It is also important to define and find the maximum distance (DMAX) at which the jammer still produces a harmful
interference on the receiver. In this paper DMAX is the distance
at wich the jammer produces 5 over 100 missed acquisition. An acquisition is missed if the peak-to-sidelobe ratio (PSLR) of the correlation function at the receiver is less than 2.5.
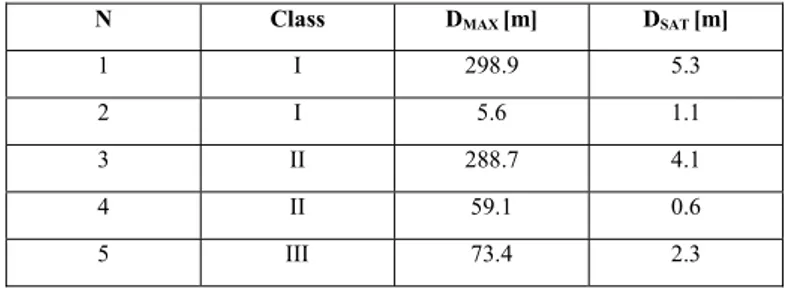
In Table III, the effect of the jammers of TABLE I,on the receiver chain in terms of DSAT and DMAX is shown.
TABLE III.MAXIMUM DISTANCE TO DISRUPT ACQUISITION PROCESS (DMAX),
AND MINIMUM DISTANCE FOR RECEIVER SATURATION(DSAT)
N Class DMAX [m] DSAT [m]
1 I 298.9 5.3
2 I 5.6 1.1
3 II 288.7 4.1
4 II 59.1 0.6
5 III 73.4 2.3
The aim of the mitigation algorithms to be implemented in the mitigation block is to reduce DMAX as much as possible, up
to the limit DMAX=DSAT.
IV. MITIGATION TECHNIQUES AND RESULTS
Mitigation of narrow band interfering signals can be, in principle, easily done using Short Time Fourier Transform (STFT), by blanking the portion of spectrum in which the interference is located. In particular when the presence of an interfering signal is detected on a part of the signal in the time domain, a blanking of the intefering signal in the STFT domain is applied and then the IFFT is applied to come back to time domain. The performance of this simple approach
depends on different parameters such as the frequency resolution of the method used, the time resolution (i.e. sampling time) of the incoming signal, the STFT window length and the blanking logic. In literature some works based on the concept of time-frequency analysis exist: in [6] a mitigation algorithm based on STFT and FrFT (Fractional Fourier Transform) is shown and in [7] this algorithm is examined in depth.
In this work the USRP-2920 is exploited at a sampling frequency of 100 MHz, and a down-conversion to an intermediate frequency of 10 MHz.
The mitigation block performs two preliminary operations: • Band Pass Filtering with 2 MHz bandwidth
• Undersampling to 25 MSample/sec.
After these operations the Detection Process works and, if neeeded, the Mitigation Process is applied on the acquired signal.
A simulated GPS signal has been produced with a received power level of -158.5 dBm [7], and a noise power level derived by a Band Pass Filter filter of 2 MHz.
The detection technique is based on the detection of a signal with power that exceeds a threshold in the time domain. In particular the Marcum theory is adopted and the detection threshold is determined by fixing the probability of false alarm (to 10-6)and the probability of missed detection to 0.9. In this
case the detection of an interference on a GPS signal needs a Jammer-to-Noise-Ratio (JNR) greather than 13.2 dB.. The described detection procedure is implemented on the simulated signal samples; in particular, a sliding window is used to select 32 samples and on these samples the incoming signal power is estimated: if the power is greater than the detection threshold then the presence of a jamming signal is declared.
If no jamming signal is detected then the sliding window is shifted of one sample, and the procedure is repeated.
A window length of 32 samples has been chosen due to the sampling frequency adopted in the algorithm. With a 25 MHz sampling frequency the time window length is 1.28 µs: the sweep time for class II-III jammers is of the order of tens of µsec and it is mandatory to have more than one window on a sweep time, to distinguish the frequency sweep of the jammer.
When a jamming signal is detected, the mitigation process is executed and so a STFT is performed. Initially, a portion of the signal is selected by multiplying the incoming signal with an Hanning window, then the FFT is done and, , the sample with the maximum amplitude is found. The blanking process consists zeroing both the frequency bins where the maximum amplitude has been found and its adjacent frequency bins. So, exploiting an IFFT it is possible to come back to time domain and finally interleaving the examined samples with the samples produced in the previous step; at this point the sliding window is shifted of one sample and the procedure is repeated.
This implementation corresponds with a Sh Transform exploiting Hanning windows factor of 1 sample, between windows of 32 s 6, a block diagram of the developed algorithm
Fig. 6. Algortihm block diagram
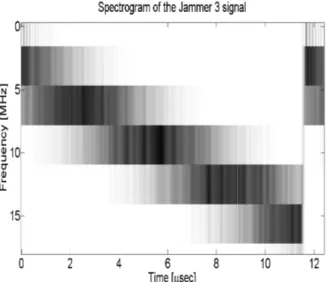
In Figure 7 an example is shown of the GPS jammed signal; in this case the jamm by the jammer number 3 of Table I: this jam unidirectional chirp signal with one saw-to has a sweep time of 11.71 µsec, with a ban MHz. The signal is centered on IF (10 MHz is between 9 MHz and 11 MHz, due to filte of the filter is a hint of mitigation, because jammer is out of band, it does not disturb signal. In this figure, the GPS signal is not power level is much lower than the powe signal.
Fig. 7. Spectrogram of the incoming signal (jamm
hort Time Fourier with an overlap samples. In Figure m is shown.
m
e spectrogram of a ming was produced mmer transmits an ooth function that ndwidth of 11.82 z) and GPS signal ering; the presence e when the signal the original GPS t visible, since its er of the jamming
mer number 3 )
In Figure 8 the spectrogra mitigation technique is shown: has been detected and mitigate MHz and 11 MHz is visible.
Fig. 8. Spectrogram of the mitiga
In Figure 9 the Peak to S correlation function is shown PSLR is performed in order to mitigation algorithm. To obtai threshold of PSLR of 2.5 ha obtained perfoming 10 simu mitigation process. As shown that the mitigation algorithm a influence by reducing its cove about 80 m. The vertical line in m).
Fig. 9. Mitigation performance. P acquisition th
am after the aforementioned : in particular the jammer signal
d and the GPS signal between 9
ated signal (jammer number 3 case)
Side Lobe Ratio (PSLR) of the (without and with mitigation). evaluate the performance of the in a good satellite acquisition a as been chosen. This figure is ulations of the detection and
in Figure 9 it is worth nothing applied has limited the jammer erage area from about 300 m to n the figure represents DSAT (4.1
PSLR of the correlation function for an hreshold of 2.5
Table IV shows a summary of the performance improvement for various types of jammer, using this mitigation method, is shown .
The maximum distances within which the jammer disrupts the acquisition process are significantly reduced and the improvements are shown in terms of distance percentage change.
TABLE IV.PARAMETERS OF THE IN-CAR JAMMERS ANALYZED IN THE PAPER AND RESULTS
N Class PT [dBm] D[m] SAT DMAX with no mitigation [m] DMAX with mitigation [m] Improve ment [%] 1 I -12.1 5.3 298.9 3.5 98.82 2 I -25.6 1.1 5.6 1 82.23 3 II -14.4 4.1 288.7 80 72.29 4 II -30.8 0.6 59.1 26 56 5 III -19.3 2.3 73.4 14 80.91 V. CONCLUSIONS
A possible detection and mitigation strategy for in-car jamming has been presented. The technique is based on time-frequency analysis through the STFT transformation; the developed algorithm has been applied to signal produced by in-car jammers (transmitting both CW and chirp-signal depending on the specific jammer class).
For jammer number 1 and jammer number 2 (Table IV), that are CW jammers, the problem of missed acquisition vanish after mitigation because the maximum distance for
acquisition disrupt (Dmax) becomes smaller than the maximum distance for the receiver saturation (Dsat).
For class II jammers (jammer number 3 and jammer number 4 (Table IV)) and for class III jammer (jammer number 5 (Table IV)), the maximum distance is significantly decreased.
REFERENCES
[1] T. Kraus, R. Bauernfeind, B. Eissfeller, “Survey of In-car jammers-Analysis and modeling of the RF signals and IF samples (suitable for active signal cancellation)”, In Proceedings of the 24th International Technical Meeting of The Satellite Division of the Institute of Navigation (ION GNSS 2011) September 20 - 23, 2011, pp. 430-435 Oregon Convention Center, Portland, Oregon Portland, OR.
[2] Data Sheet NI USRP-2920, www.ni.com/manuals, February 2014.
[3] Data Sheet L1A, www.gpssource.com/files/ , February 2014.
[4] Data Sheet A11, www.gpssource.com/files/, February 2014.
[5] K. Borre, D. M. Akos, N. Bertelsen, P. Rinder, S. H. Jensen, A software defined GPS and Galileo Receiver – A single frequency approach, Birkhauser ed, 2007.
[6] R. Bouernfeind, T. Kraus, A. Sicromoz Ayaz, D. Dotterbock, B. Eissfeller, “Analysis, Detection and mitigation of in car jammer interference in intelligent transport system”, German Air and Space Congress 2012, Document ID 281260.
[7] L. Shen, Q. Yin, M. Lu, Q. Zhang, L. Guo, T. Shen, G. Zhao, S. Ning, Linear FM signal parameter estimation using STFT and FRFT, Chinese Journal Of Electronics, April 2013.
[8] Global Navigation Satellite System Manual, second edition, doc 9849 AN457, ICAO, 2012.