1
Monitoring and assessing drug policies: scoring poly-drug use in the segments of the teenage population as a tool for cross country comparisons and economic evaluations. Preprint
Francesco Fabi
Illicit Drug Market Institute, Via Fidene 19, 00183 Rome, Italy: [email protected]
Roberto Ricci
Illicit Drug Market Institute, Via Fidene 19, 00183 Rome, Italy: [email protected]
Carla Rossi
Centro Interdipartimentale di Biostatistica e Bioinformatica, Università di Roma “Tor Vergata”, Via Montpellier 1, 00133 Rome, Italy: [email protected], tel/fax 00390672596100 (corresponding author)
2
Monitoring and assessing drug policies: scoring poly-drug use in the segments of the teenage population as a tool for cross country comparisons and economic evaluations.
Abstract.
Background. New trends in drug consumption show higher and higher proportions of poly-use. Epidemiological indicators used to monitor and evaluate drug policies are mostly based on the prevalence of users of the “main” substances (incidence would be the proper indicator) and the ranking of the harm of the substances is based on a single substance analysis (Nutt D. et al., 2007 and 2010, van Amsterdam J. et al., 2010).
Methods. The following points are dealt with in the present contribution: - the segmentation of the consumer population;
- the scoring of the harm of poly-use;
- the application of the various indicators to respondents to various surveys;
- the use of the prevalence of the teenage population as a proxy of incidence for cross country comparisons and a possible correction for estimating incidence;
The segmentation is based on the frequency of use in the last 30 days declared by respondents of School Population Surveys. Poly-drug use is taken into account by adding up the mid frequency of the classes of the different substances used in the last 30 days.
Scoring is based on van Amsterdam and others (2010). Principal component analysis is applied to reduce dimensionality.
Results. Any user is characterized by the two scores: frequency of use and poly-use score. The two systems of scores allows for cross country comparisons. Prevalence and incidence of teenage population are estimated and used for monitoring and comparisons.
Conclusions. The indicators based on the analysis of teenage drug users are very valuable due to the wide availability of reliable data on this populations coming from the School Population Surveys implemented with similar methodologies and questionnaires in several countries.
Key words: teenage drug users, segmentation of drug user population, poly-drug use scores, prevalence, incidence.
Introduction and background.
New trends in drug consumption put out new challenges for monitoring and assessing the demand for drugs, the size of the drug market and the lifestyles of users. Drug consumption shows higher and higher proportions of poly-use, in particular among teenagers. Epidemiological indicators used to monitor and evaluate drug policies are mostly based on the prevalence of users of the “main” substances, whereas incidence would be the proper indicator, and the ranking of the harm of substances is based on a single substance analysis (Nutt D. et al., 2007 and 2010; van Amsterdam J. et al., 2010). New comprehensive indicators are thus needed to overcome the limits of the presently used methods, which were mostly
3
developed in the nineties when poly-drug use was basically unknown and the number of psychoactive substances in the market was very low. Presently poly-drug use represents “normality” among frequent and regular users, with the exception of “pure” cannabis users, and more and more psychoactive substances appear in the market every year.
In the present contribution new epidemiological indicators are introduced to weight the consumption of psychoactive substances. The indicators take into account both the frequency of use and the various substances used. The indicators provide a possible operational definition of “problem drug use” and a tool to evaluate policies and demand reduction interventions. The application of the methodology to the evaluation of consumption and harm among teenagers and “heavy” drug users residents in therapeutic communities or clients of low threshold services is then shown.
In particular the following points are considered:
- the segmentation of the consumer population based on the intensity of use (Ricci R., 2010; Fabi F. et al., 2011);
- the scoring of the harm of poly-use on the basis of statistical analyses of the ranking proposed by van Amsterdam and others (2010);
- the application of the various indicators to data from School Population Surveys (SPS) conducted in Italy in 2010 and in 2011 and to data from the survey among the residents in therapeutic communities and the clients of low threshold services (2010);
- the use of the prevalence of the teenage population as a proxy of incidence with a correction to properly estimate the incidence among teenagers;
- guidelines for cross country comparisons.
In Section 1 the data available for the analyses and some preliminary descriptions are presented. In Section 2 the segmentation of the consumers is presented. In Section 3 the approach to the evaluation of the global harm of poly-use is presented. In Section 4 the methodology is applied to the classification of teenagers interviewed in the School Population Surveys. In Section 5 the comparison with data from the survey on therapeutic communities and low threshold services is reported in order to better calibrate the scoring system. In Section 6 prevalence and incidence indicators for assessing drug policies are presented and discussed. In Section 7 conclusions are drawn and further developments are outlined.
1. Data and preliminary analyses and estimates.
The data available for estimating the population of teenagers who use drugs comes from the two data bases of the School Population Surveys SPS 2010 and SPS 2011, conducted in Italy by the Anti-Drug Department of the Presidency of the Council of Ministers with the scientific and technical assistance of the University of Rome “Tor Vergata”.
An online questionnaire was utilized in 2010 and in 2011 and 38,176 questionnaires were collected in 2010 (about 34,000 valid records). In 2011 about 33,000 valid records were registered. The data sets include information regarding substances used, frequency of use, poly-use, pricing, funding and other variables providing a significant amount of data to analyze the lifestyle of teenagers in their first encounter with licit and illicit drugs.
4
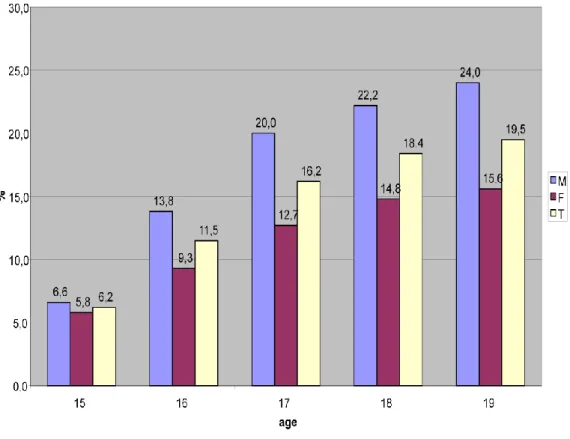
In Figure 1, the last month prevalence (any drug) by gender and age is reported for SPS 2010 (similar shapes are obtained for 2011). As expected, the prevalence increases with age and female prevalence is lower than the prevalence of males of the same age.
Figure 1. Last month prevalence (any drug) by gender and age. Source SPS 2010.
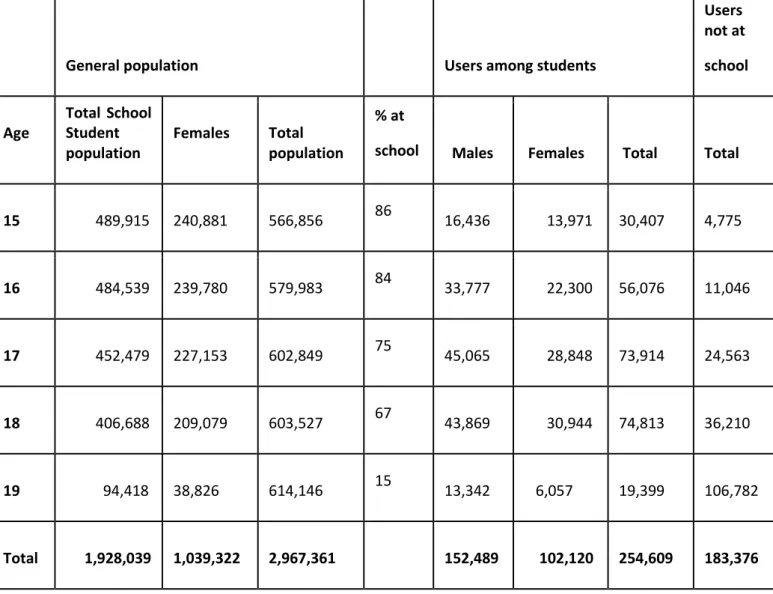
In order to estimate the absolute last month prevalence of teenagers who use any drug in the Italian population, it is necessary to assume that the teenagers who are not in the school system consume the same as the school students. This is a conservative assumption, as school failure is associated with higher drug use (Di Censi et al. in Rey G.A., Rossi C. and Zuliani A., 2011). However, on the basis of the assumption, the results presented in Table 1 are obtained. The estimates are possibly lower bounds. The estimated number of drug users, in the age class 15-19, is 437,985, about 15% of the reference population. In order to better understand the phenomenon, it is necessary to analyze some further characteristics of drug use among teenagers such as frequency of use and harm caused by the substances used.
5
Table 1. Prevalence of users among teenagers by gender and age. Source SPS 2010.
General population Users among students
Users not at school Age Total School Student population Females Total population % at
school Males Females Total Total
15 489,915 240,881 566,856 86 16,436 13,971 30,407 4,775 16 484,539 239,780 579,983 84 33,777 22,300 56,076 11,046 17 452,479 227,153 602,849 75 45,065 28,848 73,914 24,563 18 406,688 209,079 603,527 67 43,869 30,944 74,813 36,210 19 94,418 38,826 614,146 15 13,342 6,057 19,399 106,782 Total 1,928,039 1,039,322 2,967,361 152,489 102,120 254,609 183,376
2. The segmentation of the consumer population with respect to the frequency of use in the last thirty days.
The SPS questionnaire collects data about frequency of use in the last 30 days (also lifetime prevalence and last year prevalence are recorded). Five classes of frequency are considered (measured in days of consumption): 1-2, 3-5, 6-9, 10-19, >19.
In some previous contributions (Fabi et al., 2011; Fabi et al. in Rey G.A., Rossi C. and Zuliani A., 2011), the population of drug users was segmented into three classes characterized by different frequencies of use in the last thirty days, on the basis of the classes in the questionnaire. In particular:
a) the first and second class correspond to occasional users, b) the third and fourth to regular users,
6
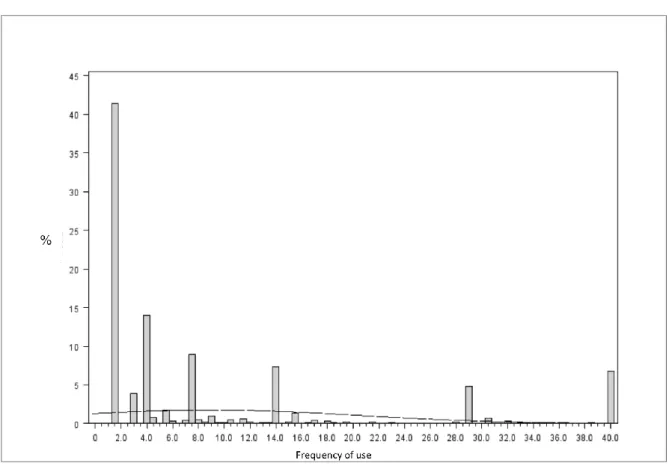
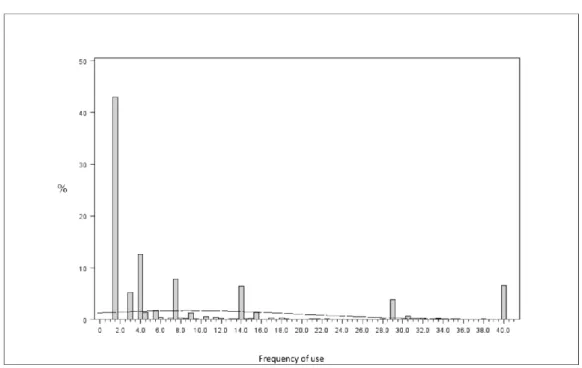
A problem for calculating the frequency of use arises for poly-users. In fact, most consumers (with the exception of occasional users and pure cannabis users) report the use of various substances. The proposed approach consists in including the frequencies of use and the substances in a table to classify and weight any poly-user (Rossi C., 2011). As an example, if a student declares to having consumed in the last thirty days: cannabis in the second class of frequency of use (3-5) and cocaine in the first one (1-2), it is possible to evaluate an overall frequency of use in the last thirty days by taking the medians of the classes and totalling them up. The student has then an overall frequency of use given by 5.5 and is classified in the second segment: the regular users. Figure 2 reports the percentage distribution of the overall frequency of use for SPS 2010 data and Figure 3 the same distribution for SPS 2011 data, obtained using this methodology. The value 25 is attributed to the last class of the questionnaire and all the frequencies of use above 40 are concentrated at 40.
The similarity of the shape of the two distributions is quite impressive and shows a “typical” segmentation with respect to the frequency of use. Considering the different peaks of distributions, it can be estimated, for both years, that about 60% of users in the last thirty days are occasional users, about 21% are regular users and about 19% are intensive users. The peaks suggest that the typical frequency of use is daily or more than daily (more doses of substances per day) for the intensive users and is about twice or four times a week, or more doses fewer times, for the regular ones.
Further analyses are needed to understand whether the harm of the substances used increases when the frequency of use increases.
7
Figure 3. Percentage distribution of the overall frequency of use for SPS 2011 data.
3. Scoring the harm of use and poly-use.
The proposed approach for scoring the harm of use and poly-use is based on the scores reported in Table 1 of van Amsterdam and others (2010). The analysis takes into account the physical harm and dependence scores only, because the social harm depends on the prevalence of use of the substances that is different in different countries. These aspects will be considered in a next paper when up-dated estimates of the prevalence, taking into account poly-use, will be available for Italy and for other countries.
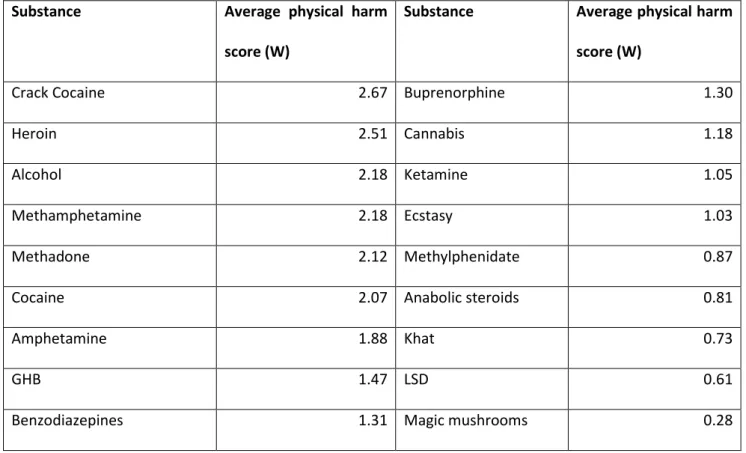
Van Amsterdam proposes using the means of the various scores as synthetic indices. In the present contribution a preliminary explorative analysis, using principal components, allows to propose a weighted mean as the unique global index to score the physical harm of the substances used by poly-users (tobacco has been excluded from the analysis). The index provides an ordering of the substances that is used to evaluate the physical harm for poly-drug users.
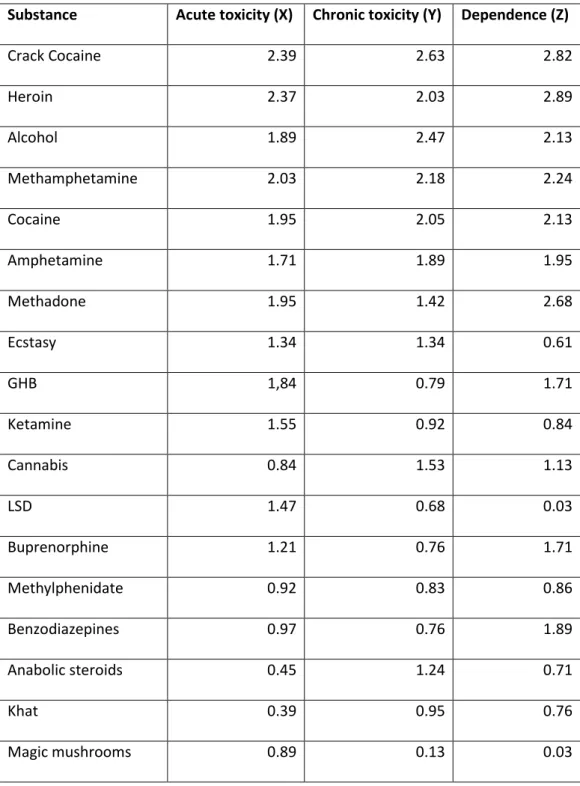
In Table 2 the basic three variables of van Amsterdam and others (2010) are reported. Principal component analysis is applied to the three vectors X, Y and Z. The variances explained by the three principal components are respectively: 77%, 14%, 9%.
Each substance can be scored by using the weighted mean of X, Y and Z according to the first principal component. The new variable W allows ranking of substances. The values of W for the different substances are reported in Table 3.
It is necessary to propose a rule to combine the weights of the different substances used by any user in the last thirty days with the aim of evaluating the global degree of physical harm. In the present approach, for any user the poly-use score, measuring the global degree of physical harm, is obtained by adding up the score W for the most dangerous substance used, plus 0.5 of the second most dangerous one, plus 0.25 of the third one and so on.
8
Table 2. Variables used for the principal component analysis. Source van Amsterdam and others (2010). Substance Acute toxicity (X) Chronic toxicity (Y) Dependence (Z)
Crack Cocaine 2.39 2.63 2.82 Heroin 2.37 2.03 2.89 Alcohol 1.89 2.47 2.13 Methamphetamine 2.03 2.18 2.24 Cocaine 1.95 2.05 2.13 Amphetamine 1.71 1.89 1.95 Methadone 1.95 1.42 2.68 Ecstasy 1.34 1.34 0.61 GHB 1,84 0.79 1.71 Ketamine 1.55 0.92 0.84 Cannabis 0.84 1.53 1.13 LSD 1.47 0.68 0.03 Buprenorphine 1.21 0.76 1.71 Methylphenidate 0.92 0.83 0.86 Benzodiazepines 0.97 0.76 1.89 Anabolic steroids 0.45 1.24 0.71 Khat 0.39 0.95 0.76 Magic mushrooms 0.89 0.13 0.03
The rationale of this approach is that the highest harm is due to the most dangerous substance used, then an additional harm must be considered for the second most dangerous substance used, but this is lower than the harm that the substance would cause if used alone or together with less dangerous substances. In simple words, the idea is to weight the substances used by any poly-drug user according to the coefficients obtained by a geometric series with ratio of 0.5. It is possible to propose different weighting rules, though for cross country comparisons is crucial that the different countries adopt the same system.
According to this approach and taking into account the frequency of use, any user is characterized by the two scores frequency of use and poly-use score. The two systems of scores allow cross country comparisons based on School Population Surveys, available in many countries and conducted in a way that
9
allows for comparison. The scores can be also applied to other surveys, such as General Population Surveys (GPS) where available, though reliability and comparability of the results of these surveys are questionable. Table 3. Average physical harm score (W) of the different substances obtained by the first principal component.
Substance Average physical harm
score (W)
Substance Average physical harm score (W)
Crack Cocaine 2.67 Buprenorphine 1.30
Heroin 2.51 Cannabis 1.18
Alcohol 2.18 Ketamine 1.05
Methamphetamine 2.18 Ecstasy 1.03
Methadone 2.12 Methylphenidate 0.87
Cocaine 2.07 Anabolic steroids 0.81
Amphetamine 1.88 Khat 0.73
GHB 1.47 LSD 0.61
Benzodiazepines 1.31 Magic mushrooms 0.28
4. Application of the indicators to the data from the School Population Surveys in Italy (SPS 2010 and SPS 2011).
In this preliminary analysis the use of alcohol is not included due to widespread safe consumption linked to cultural family habits in Italy (Rehem J., 2011). Problem alcohol consumption will be considered in a next paper where comparisons with data from other countries will be presented.
The substances used by teenagers in school in Italy are: heroin, cocaine, GHB, benzodiazepines (tranquillizers), cannabis, ketamine, ecstasy, LSD and magic mushrooms, though the most popular ones are cannabis, cocaine and tranquillizers (Table 4).
Similar percentages are obtained for 2011.
Applying the scoring method to the three segments of the school population, the results reported in Table 5 are obtained.
A score 0 means lower than 1 (negligible prevalence). Score 0 is also the score given to “pure cannabis use” for convention. A score “i” for i=1,2…. means a score between i and i+1 (second extreme not included).
10
score 3 or higher implies the use of at least two substances, a score higher than 4 the use of 3 or 4 substances or more and so on.
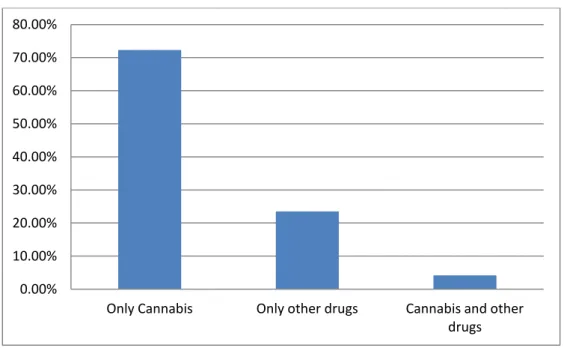
Poly-drug use is not so frequent among occasional users in 2010 as well as in 2011 (Figure 4) counting for about 4%, it is higher (over 13%) among regular users (Figure 5) and even higher (over 25%) among intensive users (Figure 6).
Table 4. Last month prevalence (%) for the most popular substances (SPS 2010).
Table 5. Poly-use scores for the three segments of users in the School Population in the age class 15-19 (SPS 2010).
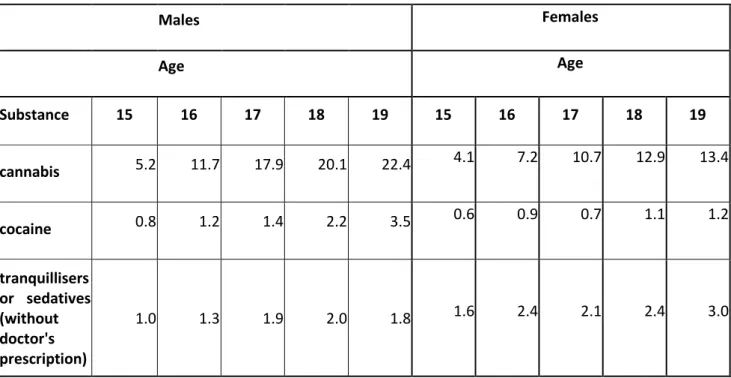
A comparison with the results of the survey conducted in Italy among residents in therapeutic communities and clients of low threshold services is very valuable to evaluate the possible “careers” of drug users in terms of scores. Males Females Age Age Substance 15 16 17 18 19 15 16 17 18 19 cannabis 5.2 11.7 17.9 20.1 22.4 4.1 7.2 10.7 12.9 13.4 cocaine 0.8 1.2 1.4 2.2 3.5 0.6 0.9 0.7 1.1 1.2 tranquillisers or sedatives (without doctor's prescription) 1.0 1.3 1.9 2.0 1.8 1.6 2.4 2.1 2.4 3.0 Frequencies Percentages Score Occasional users Regular users Intensive users Occasional users Regular users Intensive users 0 2666 906 681 79.20 71.68 61.63 1 42 8 9 1.25 0.63 0.81 2 543 169 121 16.13 13.37 10.95 3 80 105 170 2.38 8.31 15.38 4 34 53 64 1.01 4.19 5.79 5 1 23 60 0.03 1.82 5.43 Total 3366 1264 1105 100.00 100.00 100.00
11 Figure 4. Substances used by occasional users SPS 2011.
Figure 5. Substances used by regular users SPS 2011. 0.00% 10.00% 20.00% 30.00% 40.00% 50.00% 60.00% 70.00% 80.00%
Only Cannabis Only other drugs Cannabis and other drugs 0.00% 10.00% 20.00% 30.00% 40.00% 50.00% 60.00% 70.00% 80.00%
12 Figure 6. Substances used by intensive users SPS 2011.
5. The scoring system applied to data from the survey on therapeutic communities and low threshold services.
In 2010 a survey was conducted in Italy by the Anti-Drug Department of the Presidency of the Council of Ministers with the scientific and technical assistance of the University of Rome “Tor Vergata”. About 1500 residents in therapeutic communities or clients of low threshold services filled a questionnaire with several questions about:
- Social and demographic characteristics;
- drugs used, age of first use, heavy use of drugs;
- drug correlated behaviour (reasons, places, prices, route of administration of drugs).
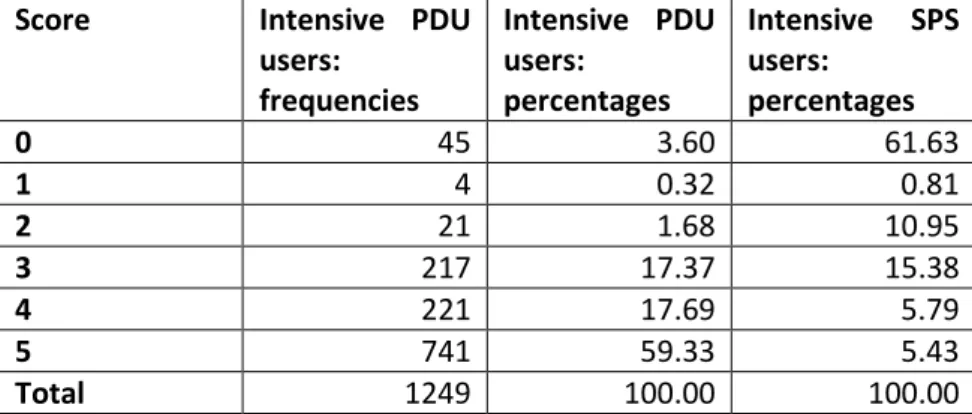
In Table 6 the poly-drug use scores are reported for intensive users from the survey among residents in therapeutic communities and clients of low threshold services (PDU) together with the scores of intensive users from the SPS 2011 survey. Figure 7 reports the comparison of the percentage distributions of the drugs used by PDU and by SPS populations (intensive users).
About 95% of the PDU population presents a poly-drug use score of 3 or higher. The median classes are: 5 for PDU and 1 for SPS and the third quartile is 5 for PDU and 3 for SPS. This effect can be attributed in part to the 0 score of pure cannabis users who are the majority of teenagers and a small minority of the others. It must be also taken into account that the PDU population is much older than the SPS population (Figure 8) and that both poly-use and frequency of use increase with age. The first quartile for PDUs aged between 15 and 19 is 1 instead of 4, whereas the median and the third quartile are the same. Unfortunately the sample size is very low and does not allow for further analyses. The difference among the score of SPS and PUD is also due to the different substances used generally by the two populations as shown in Figure 7.
0.00% 10.00% 20.00% 30.00% 40.00% 50.00% 60.00% 70.00%
13
Unfortunately General Population Surveys, that would provide information about what happens between the SPS and the PDU populations, are not reliable due to the very low response rates in recent years in Italy (less than 15% in 2010).
However, as a by-product of all the analyses reported above a possible operational definition of “problem drug use” can be suggested as “intensive use with poly-drug use score 2 or higher”. This definition comprises the intensive use of a single substance such as crack cocaine, heroin, methamphetamine, methadone and cocaine and the poly-use of these as well as of less harmful substances. The prevalence of problem drug users among the teenage population, according to this definition, can be a very valuable epidemiologic indicator for cross country comparisons.
Table 6. Poly-drug use scores for intensive users from the survey among residents in therapeutic communities and clients of low threshold services and scores of intensive users of SPS 2011 survey.
Score Intensive PDU
users: frequencies Intensive PDU users: percentages Intensive SPS users: percentages 0 45 3.60 61.63 1 4 0.32 0.81 2 21 1.68 10.95 3 217 17.37 15.38 4 221 17.69 5.79 5 741 59.33 5.43 Total 1249 100.00 100.00
Figure 7. Substances used by intensive users PDU and SPS 2011.
0.00% 10.00% 20.00% 30.00% 40.00% 50.00% 60.00% 70.00% SPS PDU
14
Figure 8. Age distributions of residents in therapeutic communities and of clients of low threshold services (histograms and kernel estimates by gender).
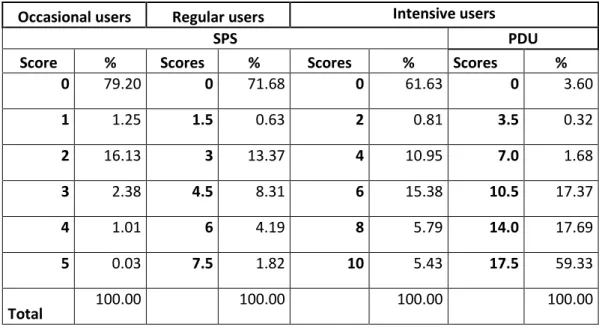
A further refinement of the scoring analysis is based on the average dose of the segments. From the analyses reported in Fabi et al. in Rey, Rossi and Zuliani (2011), it results that when the frequency of use increases also the average dose increases. Both increases with age. Including doses in the analysis is thus very important to evaluate the lifestyles and the consequences and to make economic evaluation of the market as shown in (Fabi F. et al., 2011). This can be done introducing the concept of coefficient of consumption (Ricci R., 2010; Rossi C., 2011; Fabi F. et al. in Rey, Rossi and Zuliani, 2011).
If we fix at 1 the coefficient of consumption of occasional users, this exercise provides the coefficient of consumption for the other sub-groups. Using all the available data: 1.5 is the coefficient of consumption for regular users and 2 for intensive users from SPS, 3.5 can be assumed conservatively for PDU on the basis of the results of the survey in communities and low threshold services. It is possible to summarize the poly-drug scores and the coefficient of consumption in a global poly-poly-drug score obtained as the product of the two (Table 7).
Table 7. Global poly-drug scores for the segments (percentage distributions). Occasional users Regular users Intensive users
SPS PDU
Score % Scores % Scores % Scores %
0 79.20 0 71.68 0 61.63 0 3.60 1 1.25 1.5 0.63 2 0.81 3.5 0.32 2 16.13 3 13.37 4 10.95 7.0 1.68 3 2.38 4.5 8.31 6 15.38 10.5 17.37 4 1.01 6 4.19 8 5.79 14.0 17.69 5 0.03 7.5 1.82 10 5.43 17.5 59.33 Total 100.00 100.00 100.00 100.00
15
These scores can be utilized to better weight the harm of using drugs and to make economic evaluation of the market from demand side (Ricci R., 2010, Fabi F. et al., 2011). It must be underlined that the amount of the turnover of the market is another valuable indicator for cross country comparisons.
6. Prevalence and incidence indicators of the teenage population to evaluate and compare drug policies. Estimates of the prevalence of the populations of drug users are essential for calibrating and assessing drug policies and this is now of growing interest at European level. Apart from the special case of “problem drug use”, few studies on other sub-populations of drug users have been carried out in Europe (Mascioli F. and Rossi C., 2008). The population of teenagers is strategic for policy evaluation, as these ages represent the period of onset of drug use. The analysis and evaluation based on the population of teenagers provide very powerful tools for cross country comparisons due to the availability of data from the various school population surveys. These data sets are much more comparable with respect to administrative data used for indirect estimation of drug users. The latter, in fact, strongly depend on legislation and on the policies adopted in various countries. The data from school population surveys also allows reliable prevalence estimates because the response rate is generally high enough and does not show the same bias problems as the general population surveys.
In order to better evaluate the added value of the prevalence estimates of drug users among teenagers, the distribution of the age at first use of any drug is crucial. This information can be derived from the survey on therapeutic communities and low threshold services and an example is reported in Figure 9 (Mammone A., 2010).
16
The distribution of age at first use of cannabis, that is the first substance of use for most users (more than 80%) is fairly concentrated between 10 and 20 years with the mode around 15 years. This implies that cannabis use starts mainly before the end of the high school period. The prevalence of cannabis users can thus be taken as a proxy of incidence for teenagers and can be very useful for evaluating policies and interventions. As a matter of fact, incidence is the most valuable indicator for evaluation as it synthesizes the dynamic aspects of the phenomenon. A variation can be timely attributed to possible interventions either from the policy makers or from the traffickers. Prevalence, on the other hand, is affected by the so called “inertia” and shows the possible effects of policies and interventions only with some delay and in a smoothed shape (Caulkins J. P., 2008).
A possible correction of the prevalence of cannabis users among teenagers, that can be applied to any other substance if information is available on the distribution of age at first use, provides exactly the incidence in a given year (Mascioli F. and Rossi C., 2008; Mammone A., 2010).
The incidence, in fact, can be derived from prevalence using the distribution of age at first use. The incidence of cannabis use among teenagers is particularly valuable, as cannabis is the first illegal substance for most users.
Denote by g(a) the density function and G(a) the (cumulative) distribution function of the age at first use of cannabis (Figure 9). Denote by P(a,t) the prevalence of cannabis users aged a at time t. The expected number of subjects of the population P(a,t) who started using cannabis at time t can be denoted by I(a,t) and is estimated by:
The global incidence of teenagers at time t I(t) is obtained by adding up I(a,t) for a=15,16,...19. In Table 8 the prevalence P(a,t), G(a), g(a) and the incidence I(a,t) are reported.
The cannabis users aged 15-19 who started their use in 2010 (estimated incidence) account for about 15.6% of the prevalent cases. The result has been compared with the observed incidence of cannabis from the sample SPS 2011. It resulted that actually 17% of the prevalent cases were incident cases, confirming the reliability of the estimation procedure proposed above. The calibration method proposed for estimating prevalence from incidence is particularly important for two main reasons: first, the age at first use is not always available in survey data and secondly because the accuracy of this information is questionable due to the actual question which asks only integer ages, so that difference of 0 or 1 year between present age and age at first use declared by the respondents may be both attributed to onset in the last year, but it is not sure.
Table 8. Prevalence, G(a), g(a) and incidence of cannabis use among teenagers in 2010.
Age g(a) G(a) Prevalence of cannabis use Incidence of cannabis use
15 0.164 0.382 25,509 10,939 16 0.149 0.542 52,198 14,355 17 0.115 0.675 84,399 14,386 18 0.084 0.774 99,582 10,810 19 0.056 0.844 107,476 7,128 Total 369,163 57,619
)
(
)
(
)
,
(
)
,
(
a
G
a
g
t
a
P
t
a
I
17
In Figure 10 the prevalence (%) of cannabis use for SPS 2010 is reported and in Figure 11 the same distribution for SPS 2011. This latter shows a quite similar shape of the previous one though with slightly higher prevalence.
Figure 10. Last 30 days prevalence of cannabis (%) by age and gender (SPS 2010).
Figure 11. Last 30 days prevalence of cannabis (%) by age and gender (SPS 2011). 0.0% 5.0% 10.0% 15.0% 20.0% 25.0% 15 16 17 18 19 Males Females Total p e r c e n t a g e Age 0.0% 5.0% 10.0% 15.0% 20.0% 25.0% 15 16 17 18 19 Males Females Total Age
18
But what about the age at first use for cocaine and heroin? The proportion of users who have started their use with heroin or cocaine is not high. Generally these substances are used after a period of use of other drugs, mainly cannabis or pills. This time lag can be called gateway time. In Figure 12 the distribution of the gateway time by gender is reported (Mammone, 2011).
The mean of the gateway time is 2.5±2.8 years. This explains the shape and the position of the distributions of age at onset for cocaine and heroin in Figure 9. In Figure 13 the example of typical time distributions for heroin users is shown. Similar shapes are obtained for cocaine.
Figure 12. Distribution of the gateway time by gender (histogram an kernel estimates by gender).
19 7. Conclusions and outlines for further development.
The scoring system proposed can be easily applied to similar situations in various countries on the basis of survey data and allows for comparisons restricting the analysis to the teenage population.
Teenage incidence of drug use and, in particular, of cannabis use is also a very powerful indicator for cross country comparisons.
Cannabis is usually the first illicit drug used by teenagers (http://www.espad.org/) and the indicators based on cannabis use incidence allow for a timely evidence of modifications induced by any kind of interventions. As a matter of fact cannabis incidence among teenagers can be easily estimated and compared on the basis of School Surveys widely and regularly available in many countries.
In some countries School Population Surveys only collect data on 15 and 16 year old. However, due to the typical age distribution at onset for cannabis users, the incidence can be calculated from prevalence in this case too allowing for significant cross country comparisons and time series analyses providing evidence for policy makers.
The analyses that include doses can be used to make evaluations of the turnover of the illicit drug market. The SPS questionnaire used in Italy comprises also questions on prices. A very interesting result is that teenagers who have used drugs provide information on prices very close to those provided by residents in therapeutic communities and low threshold services. These are very close to those provided by the Anti-Drug Authority. Thus, school students are well informed about the market and constitute a very reliable source of information for evaluation and economic analyses. On the basis of this information and considering the doses of the various segments, with some conservative hypotheses about the general population based on the various GPS available in Italy and abroad, the turnover of the illicit drug market in Italy has been estimated to account for about 24 billion euro in 2010 (Fabi et al. in Rey, Rossi and Zuliani, 2011) The estimate of the turnover is a valuable indicator that allows for cross country comparisons to provide evidence of the efficacy of anti-drug policies and interventions and, in particular, of intervention from the supply side.
In order to improve the cross country comparability, the evaluation of the turnover can be restricted to the sub-populations of school students and clients of low threshold services who are still using drugs, avoiding the slippery estimates coming from GPS that suffer from different methodological approaches and questionnaires in different countries and low response rates. A next paper will be devoted to present these kind of economic analyses (Fabi et al. in preparation, 2012).
Acknowledgements.
Work developed within the framework of the EU project JUST/2010/DPIP/AG/1410: New methodological tools for policy and programme evaluation.
This publication has been produced with the financial support of the Prevention and Information Programme of the European Commission. The contents of this publication are the sole responsibility of the authors and can in no way be taken to reflect the views of the European Commission. The work was also partially supported by the Open Society Institute.
20 References.
Caulkins, J.P. (2008). Implications of Inertia for Assessing Drug Control Policy: Why Upstream Interventions May not Receive Due Credit. Contemporary Drug Problems, 35(2-3), 347-369.
Di Censi, L. Esposito, N. & Fabi, F. (2011), L’uso di sostanze psicotrope nella popolazione scolastica. In Rey, G.A. Rossi, C. & Zuliani, A. (Eds), Il mercato delle droghe: dimensione, protagonisti, politiche, (pp 112-159), Venezia, Italy: Marsilio editori.
Fabi, F. Ricci, R. & Rossi, C. (2011). Evaluation of the drug market and its segments: the case of Italy, retrieved May 2011 from http://drugpolicyevaluation.eu/web/.
Fabi, F. Ricci, R. & Rossi, C. (2012). Evaluation of the drug market and its segments: the case of Italy, in preparation.
Fabi, F. Ricci, R. & Rossi, C. (2011). Segmentazione e valutazione del mercato dal lato della domanda. In Rey, G.A. Rossi, C. & Zuliani, A. (Eds), Il mercato delle droghe: dimensione, protagonisti, politiche, (pp 190-215), Venezia, Italy: Marsilio editori.
Nutt, D. J. King, L.A. Saulsbury, W. & Blakemore C. (2007). Development of a rational scale to assess the harm of drugs of potential misuse. the Lancet, 369, 1047–1053.
Nutt, D. J. King, L.A. Phillips, L.D. on behalf of the Independent Scientific Committee on Drugs. Drug harms in the UK: a multicriteria decision analysis, retrieved November 1 2010 from www.thelancet.com.
Mammone, A. (2010). Evidence from surveys among PDUs: age and latency distribution and incidence estimates. retrieved December 2010 from http://projects.emcdda.europa.eu/alias.cfm/areaPDU.
Mammone, A. (2011). Data sets for estimating the sub-populations involved in drug use retrieved October 2011 from http://projects.emcdda.europa.eu/alias.cfm/areaPDU.
Mascioli, F. & Rossi, C. (2008). Capture-recapture methods to estimate prevalence indicators for evaluating drug policies. UN Bulletin on Narcotics, volume LX,5-25.
Rehem, J. (2011). Monitoring of alcohol consumption and harm–lessons learnt. Retrieved October 2011 from http://projects.emcdda.europa.eu/alias.cfm/areaPDU.
Rey, G.M. Rossi, C. & Zuliani A. (2011). Il mercato elle droghe: dimensione, protagonisti, politiche. Venezia, Italy: Marsilio Editori.
Ricci, R. (2010). Illicit drug industry in the National Accounts. Some extension of the supply and demand side approach. Retrieved March 2010 from
http://www.illicitdrugmarket.net/upload/files/20100328172647-Drug_industry_in_the_National_Accounts.pdf.
Rossi, C. (2011), The segmentation of the population of drug users and estimates of “frequent” or “intensive” users. Retrieved October 2011 from http://projects.emcdda.europa.eu/alias.cfm/areaPDU. Van Amsterdam, J. Opperhuizen, A. Koeter, M. & van den Brink, W. (2010). Ranking the Harm of Alcohol, Tobacco and Illicit Drugs for the Individual and the Population. European Addiction Research, 16, 202-207.