DOTTORATO DI RICERCA IN
Scienze ambientali: tutela e gestione delle risorse naturali
Ciclo XXII
settore scientifico: CHIM/12
TITOLO TESI
Chemical characterization of atmospheric secondary organic aerosol
of biogenic and anthropogenic origin
Presentata da : Dott.ssa EMANUELA FINESSI
Coordinatore dottorato:
Prof.ssa ELENA FABBRI
Tutore:
Prof. EMILIO TAGLIAVINI
Relatore:
Dott.ssa MARIA CRISTINA FACCHINI
Correlatore:
Dott. STEFANO DECESARI
This doctoral thesis is based on the experimental work carried out at the Institute of Atmospheric Sciences and Climate of the National Research Council (ISAC-CNR) in Bologna, within the Atmospheric Chemistry group headed by Dr. Sandro Fuzzi. I would like to express my appreciation to him for having had the opportunity of this invaluable experience.
I gratefully acknowledge financial supports from the University of Bologna, ISAC-CNR, the Atmospheric Composition Change European Network of Excellence (ACCENT) and the European projects EUCAARI, MAP and PolySOA.
I am most grateful to Dr. Maria Cristina Facchini and Dr. Stefano Decesari for supervision and support during the preparation of this thesis. My work would not have been successful without their help and patience. I would like to thank them for always believing in me and encouraging me to push the limits.
I am very grateful to Prof. Emilio Tagliavini for believing in me from the beginning and for the helpful suggestions.
I warmly thanks present and past fellow colleagues which all contributed substantially to this work and in creating a cheerful atmosphere. My special thanks to Lara Giulianelli, Lorenza Emblico, Valeriana Mancinelli, Claudio Carbone, Fabio Moretti, Marco Paglione and Matteo Rinaldi.
I very much appreciate the unfailing help of Francesca Pollini and Francescopiero Calzolari.
I would like also to acknowledge all the people I worked with during the various field campaigns.
Abstract ...1
List of original publications ...3
Introduction...5
Objectives of the study...8
1 Literature review...10
1.1 Aerosol particles ...10
1.1.1 Size distribution ...11
1.1.2 Chemical composition...13
1.2 Secondary organic aerosol ...15
1.2.1 Organic aerosol source apportionment ...17
1.2.2 Gas-to-particle partitioning and volatility basis set ...18
1.2.3 Heterogeneous reactions ...20
2 Experimental ...21
2.1 Laboratory experiments ...21
2.1.1 Laboratory-biogenic SOA production ...24
2.1.2 Laboratory-anthropogenic SOA production ...27
2.1.3 Organics loading in the chamber experiments...29
2.2 Field data...30
2.2.1 Mace Head ...31
2.2.2 Hyytiälä...31
2.2.3 K-Puszta...32
2.2.4 Cabauw...32
2.2.5 San Pietro Capofiume ...33
2.2.6 Melpitz ...33
2.3 Samples handling and analysis ...35
2.3.1 Sampling methods...35
2.3.2 Analytical methods ...36
3 Results...42
3.1 Terrestrial biogenic SOA ...42
3.1.1 Alpha-pinene SOA...42
3.1.2 Low-concentration experiments...47
3.2 Anthropogenic SOA...56
3.2.1 SOA formed by 1,3,5-trimethylbenzene...56
3.2.2 Comparison with TMB-SOA composition as predicted by models ...61
3.2.3 Oligomerization reactions with methyl glyoxal...63
3.3 Comparison between ambient organic aerosol and laboratory-SOA...65
3.3.1 Ambient organic aerosol ...65
3.3.2 Clusters analysis applied to 1H-NMR spectra of ambient organic aerosol ...68
3.3.3 Relationship between functional group distribution and WSOC sources...72
3.3.4 Identification of biogenic SOA based on NMR spectral signatures observed in chamber experiments and at pristine forest sites ...76
3.3.5 Ambient organic aerosol vs anthropogenic laboratory-SOA...81
3.3.6 Chemical classes of WSOCs...88
4 Conclusions...91
4.1 Terrestrial biogenic SOA ...91
4.2 Anthropogenic SOA...92
Bibliography...94
Abstract
Atmospheric aerosols play a key role in many environmental processes at local and global scale affecting human health, visibility, air quality and the climate system. Worldwide, a major component of the total particulate mass is constituted by organic compounds. Primary organic aerosols are directly emitted in the atmosphere by combustion sources (e.g. fossil fuel combustion, biomass burning) or by wind-driven processes such as re-suspension of soil particles and sea-spray. Conversely, secondary organic aerosols (SOA) form by chemical reactions occurring in the atmosphere, including the oxidation of volatile organic compounds (VOCs) leading to less volatiles species which can condense onto pre-existing particles or form new particles, and as well by the chemical transformations of primary components in the particulate phase (ageing).
State-of-the-art global models estimate that SOA account for a significant fraction of atmospheric aerosol nevertheless these data remain extremely uncertain due to the lack of observations capable to discern natural and anthropogenic SOA from other aged organic aerosol types. A major limitation is given by the complex chemical composition, encompassing myriads of individual compounds, of atmospheric particulate organic matter.
In the present study, nuclear magnetic resonance (NMR) spectroscopy and liquid chromatographic methods were employed to investigate the chemical composition of SOA produced in simulation chambers by photo-oxidation and ozonolysis of atmospherically relevant biogenic and anthropogenic VOCs. The resulting spectroscopic and chromatographic data were then used to interpret the composition of ambient samples of atmospheric fine particulate matter collected at several sites in Europe, in order to determine the fraction of ambient aerosol organic mass accounted for by biogenic and anthropogenic SOA.
Laboratory biogenic SOA analyzed in this thesis were generated from terpene mixtures, including α/β-pinene, limonene, ∆3-carene, ocimene, β-caryophyllene and α-farnesene, as representative for VOCs emitted by conifer tree species, whereas one aromatic hydrocarbon having a high SOA formation yield (1,3,5-trymethylbenzene) was used as model anthropogenic SOA precursor.
Ambient samples containing SOA were collected in both unperturbed environments (Finnish boreal forest, Atlantic coast of Ireland) and polluted rural areas (Po Valley, Hungarian plain, Netherlands, Saxony)..
Among the employed analytical techniques, NMR spectroscopy provided “spectral fingerprints” for biogenic and anthropogenic SOA, which accounted for by the variability of the complex fraction of
the samples of SOA generated in the reaction chambers, and were then compared to spectral types characterizing the ambient samples. The great variability of the ambient sample NMR composition was processed using multivariate statistical methods such as clusters analyses, positive matrix factorization (PMF) and non-negative matrix factorization (NMF), allowing to extract few spectral types (profiles). Based on the comparison with the fingerprints of SOA provided by the lab experiments, on the occurrence of tracer compounds and on ancillary informations, the spectral profiles extracted from the ambient samples were tentatively assigned to SOA and to other oxidized organic aerosol types, such as biomass burning products.
PMF analysis applied to a collection of NMR spectra of aerosol samples from the boreal forest provided one factor fitting unambiguously the NMR fingerprint obtained for biogenic SOA during reaction chamber experiments. Therefore the contribution of biogenic SOA to total organic particulate matter could be estimated for this environment.
By contrast, the comparison of the spectral profiles characteristic of polluted continental areas with the fingerprints of anthropogenic SOA obtained in lab experiments proved to be less successful, indicating that the reaction chamber experiments in this case were not fully representative of the atmospheric system.
These results suggest that NMR spectroscopy combined to statistical multivariate analysis can be profitably employed in source apportionment studies of atmospheric particulate organic matter into its source contributions.
List of original publications
2010 > Primary and secondary organic marine aerosol and oceanic biological activity:
recent results and new perspectives for future studies. Rinaldi, M., S. Decesari, E.
Finessi, L. Giulianelli, C. Carbone, S. Fuzzi, C. D. O’Dowd, D. Ceburnis and M.C. Facchini.
Submitted to Advances in Meteorology.
2009 > Chemical composition of PM10 and PM1 at the high-altitude Himalayan station
Nepal Climate Observatory - Pyramid (NCO-P) (5079 m a.s.l.). Decesari, S., M. C.
Facchini, C. Carbone, L. Giulianelli, M. Rinaldi, E. Finessi, S. Fuzzi, A. Marinoni, P. Cristofanelli, R. Duchi, P. Bonasoni, E. Vuillermoz, J. Cozic, J. L. Jaffrezo and P. Laj. Accepted for publication on Atmospheric Chemistry & Physics Discussions.
> On the representativeness of coastal aerosol studies to open ocean studies: Mace
Head – a case study. Rinaldi, M., M. C. Facchini, S. Decesari, C. Carbone, E. Finessi,
M. Mircea, S. Fuzzi, D. Ceburnis, M. Ehn, M. Kulmala, G. de Leeuw and C. D. O’Dowd. Atmospheric Chemistry & Physics, 9, 9635-96-46, 2009.
> Significant variations of trace gas composition and aerosol properties at Mt. Cimone
during air mass transport from North Africa - contributions from wildfire emissions and mineral dust. Cristofanelli, P., A. Marinoni, J. Arduini, U. Bonafè, F. Calzolari, T.
Colombo, S. Decesari, R. Duchi, M. C. Facchini, F. Fierli, E. Finessi, M. Maione, M. Chiari, G. Calzolai, P. Messina, E. Orlandi, F. Roccato, and P. Bonasoni.
Atmospheric Chemstry & Physics, 9, 4603-4619, 2009.
2008 > Coastal and open ocean aerosol characteristics: investigating the representativeness
of coastal aerosol sampling over the North-East Atlantic Ocean. Rinaldi, M., M. C.
Facchini, S. Decesari, C. Carbone, E. Finessi, M. Mircea, S. Fuzzi, D. Ceburnis, M. Ehn, M. Kulmala, G. de Leeuw and C. D. O’Dowd.
Atmospheric Chemistry &. Physics. Discussions, 8, 19035-19062, 2008.
> An important source of marine secondary organic aerosol from biogenic amines. Facchini, M. C., S. Decesari, M. Rinaldi, C. Carbone, E. Finessi, M. Mircea, S. Fuzzi, F. Moretti, E. Tagliavini, D. Ceburnis and C. D. O’Dowd.
Environmental Science & Technology, 42, 24,9116-9121, 2008.
> Primary submicron marine aerosol dominated by insoluble organic colloids and
aggregates. Facchini, M. C., M. Rinaldi, S. Decesari, C. Carbone, E. Finessi, M. Mircea,
S. Fuzzi, D. Ceburnis, R. Flanagan, E. D. Nilsson, G. de Leeuw, M. Martino, J. woeltjen and C. D. O’Dowd.
Geophysical Research Letters, 35, L17814, doi:10.1029/2008GL034210, 2008.
> Combined Determination of the Chemical Composition and of Health Effects of
Secondary Organic Aerosols: The POLYSOA Project. Baltensperger, U., J. Dommen,
M.R. Alfarra, J. Duplissy, K. Gaeggeler, A. Metzger, M.C. Facchini, S. Decesari, E. Finessi, C. Reinnig, M. Schott, J. Warnke, T. Hoffmann, B. Klatzer, H. Puxbaum, M.
Journal of Aerosol Medicine and Pulmonary Drug Delivery, 21, 1, 145-154, 2008.
2007 > An anion-exchange high-performance liquid chromatography method coupled to
total organic carbon determination for the analysis of water-soluble organic aerosols. Mancinelli, V., M. Rinaldi, E. Finessi, L. Emblico, M. Mircea, S. Fuzzi, M. C.
Facchini, S. Decesari.
Introduction
Atmospheric aerosol particles play a significant role in a variety of environmental issues at both regional and global scales, influencing health, air quality and climate. Aerosols scatter and absorb solar and terrestrial radiation, and influence cloud formation thus affecting the radiative balance in Earth’s atmosphere (IPCC, 2007; Ravishankara, 2005). Moreover it is now well established that the exposure to submicron aerosol particles is associated to damaging effects on respiratory and cardiovasculatory systems (Pope and Dockery, 2006, Davidson et al., 2005).
Worldwide organic compounds are a major component of atmospheric submicron particulate matter, accounting for up to 90% of aerosol mass (Kanakidou et al., 2005). Despite much efforts dedicated in the last two decades, only a minor fraction of the organic aerosol mass has been identified at molecular level due to its extreme chemical complexity. Consequently the effects of organic particulate matter remain highly uncertain as highlighted by several reviews (Poschl, 2005; Fuzzi et al., 2006; Goldstein and Galbally, 2007; Rudich et al., 2007).
Organic aerosols are either emitted directly into the atmosphere as primary organic aerosol (POA) or form in the atmosphere as secondary organic aerosol (SOA) due to the photochemical conversion of gaseous precursors (Pankow, 1994; Kroll and Seinfield, 2008). SOA have recently gained much attention because current models estimate that they account for a dominant fraction of the total organic particulate mass (Baltensperger et al., 2005; Lanz et al., 2007). Nevertheless current estimates of global SOA production remain extremely approximate due to the lack of observations capable to discern between the various SOA sources.
SOA is formed in the atmosphere by transformations of gaseous precursors emitted from both biogenic and anthropogenic activities. On a worldwide basis volatile organic compounds (VOCs) emitted from biogenic sources exceed up to ten times those from anthropogenic sources, however in urban areas anthropogenic VOCs often dominate (Calvert, 2002; Atkinson and Arey, 2003). Alkanes, alkenes, aromatic hydrocarbons and oxygenated compounds are the major classes of the non-methane VOCs typically released from vehicle exhausts, industrial scale combustion, solvents usage, refineries and petrochemical facilities (Lewis et al., 2000). In polluted urban environments anthropogenic emissions include up to 40% of aromatic hydrocarbons (Smith et al., 1999; Molina et al., 2007). Thus the photochemical processing of primary aromatic hydrocarbons can contribute significantly to the production of secondary pollutants in these areas, most notably tropospheric ozone and SOA (Derwent et al., 2003; Derwent et al., 2007a).
Although major efforts have been made in identifying key biogenic and anthropogenic SOA precursors, significant gaps still remain in understanding the formation mechanisms, composition and properties of SOA (Hallquist et al., 2009).
Recent combined experimental and modelling studies have investigated the formation of SOA from the photo-oxidation of several simple aromatic hydrocarbons (e.g. alkyl benzenes such as toluene, xylenes, trimethylbenzenes and their analogues) and of terpenoids (e.g. isoprene, α/β-pinene, limonene, etc.), obtaining a considerable amount of new data (Cao et al., 2007; Cao et al., 2008; Johnson et al., 2004; Ng et al., 2007; Song et al., 2007; Metzger et al., 2008; Rickard et al., 2009). Moreover, the aromatic degradation as represented in the Master Chemical Mechanism (MCM) was recently updated to better fit against smog chamber data (Bloss et al., 2005; EXACT project and references therein). Although the research has been quite active so far significant deficiencies still remain. It was shown for example that models strongly under-estimate the observed production of SOA unless to increase the absorptive partitioning coefficients and these observations were generally interpreted in terms of significant occurrence of condensed-phase association reactions (Johnson et al., 2005). Conclusions from such works have inferred an important role for addition processes involving reactive aldehydes (e.g. formation of peroxyhemiacetals from the reaction of aldehydes with organic hydroperoxides). Few years before Jang (2002) had presented the first evidence that small volatile organic compounds increase the mass of acidic particles by forming low-volatility condensation products and after that several authors showed that high-molecular-weight compounds (with masses up to 1000 Da) are present in laboratory SOA generated from both biogenic as well anthropogenic precursors (Kalberer et al., 2004; Gross et al., 2006; Surratt et al., 2006; Tolocka et al., 2004; Iinuma et al., 2004; Gao et al., 2004; Reinhart et al., 2007). On the basis of the proposed formation pathways (i.e. heterogeneous hydration and polymerisation of low-molecular-weight aldehydes following their transfer from the gas phase) oligomeric structures have been hypothesized for these high-molecular-weight compounds. Kalberer et al.(2004) found that up to 50% of the total SOA mass formed during the photooxidation of 1,3,5-trimethylbenzene can be attributed to oligomers.
In ambient aerosol samples macromolecular substances with spectral characteristics similar to those of humic and fulvic acids (and thus named HULIS, humic-like substances) were first detected by Havers (1998). Hulis were found to be the major contributors (20-50%) to the water-soluble organic aerosol at urban and rural sites in Europe (Facchini et al., 1999a; Zappoli et al., 1999; Krivácsy et
compare with those of oligomers found in laboratory-generated particles.
Elucidation of SOA chemical composition challenges in many way the analytical techniques currently adopted and a number of reviews has been published in recent years (McMurry, 2000; Rudich et al., 2007; Hoffmann and Warnke, 2007).
Attempts to clarify SOA composition at molecular level (with GC-MS analysis often providing the foundation) supplied no more than 15-30% of the total SOA mass (Forstner et al., 1997; Cocker III et al., 2001; Hamilton et al., 2003; Edney et al., 2005; Surratt et al., 2006). Moreover, with much research geared to evaluate how different experimental conditions affect the physical properties of the laboratory-generated aerosol (e.g. yields, hygroscopicity, etc.), to date few studies have reported the corresponding aerosol chemical composition (Cocker III et al., 2001; Kleindienst et al., 2003; Sax et al., 2005).
Spectroscopic techniques such as aerosol mass spectrometry (AMS), nuclear magnetic resonance (NMR) spectroscopy and Fourier transform infrared (FT-IR) spectroscopy, bypass the constraints of molecular speciation looking to the integral chemical features of the unresolved mixtures of myriads of oxidized compounds which characterise processed aerosol particles.
Nuclear magnetic resonance (NMR) spectroscopy techniques has been profitably used to gain information on the average functional distribution of SOA (Decesari et al., 2001; Fuzzi et al., 2001; Tagliavini et al., 2006; Moretti et al., 2008). This technique has been used in numerous studies, including source apportionment (Decesari et al., 2007), having the potential to separate biomass burning from marine and secondary organic aerosol.
Aerosol mass spectrometry is now widely used for on-line measurements of the aerosol chemical composition and data are generally reported as sulfate, nitrate, ammonium, chloride and organic contents (Allan et al., 2003; Jimenez et al., 2003). Moreover statistical multivariate techniques combined to AMS data can be used to identify components in the total OA spectra (Zhang et al., 2005a, b; Lanz et al., 2007, 2008, Jimenez et al., 2009).
Objectives of the study
In this work has been investigated the chemical composition of SOA produced in smog chambers by photo-oxidation and ozonolysis of atmospherically relevant biogenic and anthropogenic volatile organic compounds (VOCs). Ambient samples containing SOA and collected in both pristine forested and polluted environments were also analyzed with the aim of comparison with the smog chamber data. Ambient sampling sites were mainly selected on the basis of their different environmental typology in order to possibly use them as surrogates for different sources of carbonaceous aerosol present in polluted and natural background in Europe.
Laboratory-SOA analyzed within this thesis were generated from terpene mixtures, including α/β-pinene, limonene, ∆3-carene, ocimene, β-caryophyllene and α-farnesene, as representative for VOCs emitted by conifer tree species, whereas a single aromatic hydrocarbon (1,3,5-trymethylbenzene) was used as model of anthropogenic gaseous pollutants. Laboratory-SOA composition was investigated in different ranges of precursor concentration and in different photochemical conditions. Moreover in order to investigate the laboratory-SOA chemical composition in parallel with their photochemical aging, two samplings were generally performed in subsequent moments of each chamber experiment.
A suite of spectroscopic and chromatographic methods were employed to chemically characterize the laboratory-SOA and the ambient organic aerosol samples.
The analytical methods included determination of Total Carbon (TC) and Water-Soluble Organic Carbon (WSOC), the speciation of WSOC into main chemical classes on the basis of their acidic properties and characterization of WSOC by Proton Nuclear Magnetic Resonance (1H-NMR)
spectroscopy for functional group analysis.
A recently set up anion exchange HPLC method was employed for quantitatively resolving WSOC into the following main chemical classes: neutral compounds (N), mono- and di-acids (MDA) and polyacids (PA), the latter including HULIS.
1H-NMR spectroscopy in D
2O solution was exploited for functional group characterization of the
water soluble organics. The resulting series of 1H-NMR spectra was further processed by a variety of multivariate statistical methods such as clusters analyses, positive matrix factorization (PMF) and
1 Literature review
This section provides a survey of the sources and nature of tropospheric aerosols with a focus on secondary organic aerosols. Primary sources of organic aerosols are described first, followed by an overview of atmospheric processes responsible for the formation and transformation of secondary organic aerosols starting from gaseous compounds.
1.1 Aerosol particles
Aerosols are defined as colloidal systems of liquid or solid particles suspended in gas phase, with particles diameters in the range of 10-9-10-4 m. The lower size limit is represented by molecules or clusters of molecules, while the upper limit corresponds to particles or droplets with a high settling rate (Seinfield and Pandis, 1998). In atmospheric sciences, the term aerosol refers usually to solid particles whereas cloud droplets are considered a distinct system.
Aerosol particles are made of a large number of chemical compounds originating from both natural and anthropogenic sources. which consequently determine their chemical composition, size and shape characteristics (fig. 1). Natural sources include wind-driven processes such as re-suspension of soil particles and sea-spray, combustion processes such as forest fires, volcanic eruptions and finally emissions from vegetation. Several human activities, such as, e.g., combustion of fossil fuels, domestic heating, traffic-related suspension of road-dust, represent significant sources of atmospheric particulate matter.
1.1.1 Size distribution
The atmosphere, either in urban or in remote areas, contains significant amount of aerosol particles, with concentrations sometimes as high as 107-108 cm-3. The diameters of these aerosol particles spans from few nanometers to tens of micrometers. Nevertheless, particles having aerodynamic diameters smaller than 10 µm dominate the size spectrum, accounting for most of the total aerosol particles (on either number and mass basis).
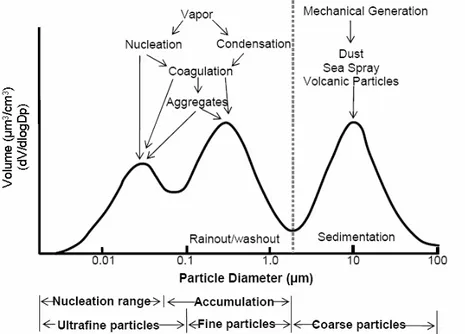
As a result of particle formation and removal processes, the atmospheric aerosol size distribution is characterized by a number of modes, i.e. different populations of particles (Fig. 2).
Figure 2. Schematic representation of tropospheric aerosol size distribution on number concentration basis. (adapted from Seinfield and Pandis, 2006)
These modes are approximated to log normal distributions and are generally found in to the following size ranges (Whitby, 1978):
Nucleation mode (D < 0.01µm); Aitken mode (0.01 < D < 0.1µm); Accumulation mode (0.1 < D < 1µm); Coarse mode (D> 1µm).
Nucleation and Aitken particles are also referred as ultrafine particles. Even if the ultrafine aerosols dominate the number concentration, they contribute to a small fraction of total particle mass concentration.
Most of the mass of fine particles, defined as aerosols with aerodynamic diameter lower than 2.5 µm, is accounted for by the accumulation mode. Coarse particles are defined as those having aerodynamic diameter larger than 1 µm and most of their mass is generally measured below 10 µm. Fine and coarse particles differ in respect to production mechanisms and sinks.
Coarse particles are the result of mechanical processes such as erosion or re-suspension of mineral dust, and of biological material, such as plant debris, pollen, spores, etc.. Other sources of coarse aerosols include traffic emissions, resuspension of road dust, and the natural production of seasalt particles due to sea.spray over oceanic regions. Coarse aerosols are removed from the atmosphere essentially by sedimentation.
Conversely, fine particles are mainly produced by secondary processes such as gas-to-particle conversion mechanisms and by primary combustion sources. The nucleation mode is the result of nucleation of new particles from rapid gas condensation. This occurs during the rapid cooling of an exhaust upon dilution in the background air, but may happen also at ambient temperature through photochemical reactions. The Aitken mode results from condensation of vapors onto nucleation mode particles and from their coagulation, as well as from primary combustion emissions. In turns, the accumulation mode typically results from prolonged condensation of vapors on Aitken particles and from the formation of particle mass by chemical reactions in non-precipitating cloud droplets. Since sedimentation is not effective for fine aerosols and coagulation is too slow for aerosol > 0.1 µm, particles in the accumulation mode tend to accumulate in the atmosphere.
Since this thesis deals with organic aerosols of secondary origin, the chemical analyses have been focussed on fine particles.
Tropospheric aerosol chemical composition is characterized by a great spatial and temporal variability, reflecting the variety of sources and transformation processes. In general, aerosol particles consist of complex mixtures of inorganic and carbonaceous species, the most important classes being inorganic water-soluble salts such as sulfates, nitrates, ammonium salts and sea salt, soluble and insoluble carbonaceous material, and insoluble inorganic compounds from soil particles and combustion ash..
Carbonaceous particles are found in the troposphere as elemental (black) carbon (EC), organic carbon (OC) and carbonate carbon, the latter being negligible in the submicron size range. Produced solely by combustion processes, elemental carbon is a typical primary aerosol component. EC strongly absorbs light and has been associated with poor visibility (Bond and Bergstrom, 2006). Organic carbon is formed by both primary sources and gas-to-particle conversion (Castro et al., 1999).
Aerosol compounds derived from combustion or from gas-to-particle conversion, such as sulphate, ammonium, elemental and organic carbon, are found predominantly in fine particles whereas coarse particles are generally associated with sea salt and crustal species emitted by mechanical processes at the Hearth surface. However, heterogeneous chemical reactions at particle surface may lead some compounds, like nitrate, to condense on both fine and coarse modes. An overview of the average chemical composition of European tropospheric aerosols in the different size ranges has been published by Putaud and co-workers (2003) and more recent studies have provided detailed phenomenologies of the aerosol chemical composition for many specific European sites.
Organic compounds are widespread in all areas and represent a large, sometimes even dominant, fraction of atmospheric fine particles accounting for 20-90% of aerosol mass in the lower troposphere (Kanakidou et al., 2005; Zhang et al., 2005; Jimenez, 2009).
Although a substantial amount of new data on organic aerosol has been provided in the last decade, the current understanding of OA chemical composition, sources and formation mechanisms remains very limited (Fuzzi et al., 2006).
Organics in the fine fraction can result either from primary emissions due to combustion processes at high temperature or from VOC oxidation and gas to particle conversion mechanisms (Kroll and Seinfeld, 2008; Zhang et al., 2007), while in the coarse fraction it can originate also from biological debris (Jacobson et al., 2000; Jaenicke et al., 2005). Spray of organic-rich liquid surfaces may inject primary organic particles also in the submicron mode. Such mechanism can contribute to the
formation of fine organic particles over high-biologically productive oceanic waters (O’Dowd et al., 2004).
1.2 Secondary organic aerosol
Ambient organic aerosols (OA) comprise either primary organic aerosol (POA, particle mass directly emitted into the atmosphere from the sources) and secondary organic aerosol (SOA, particle mass formed in the atmosphere due to the photochemical conversion of gaseous precursors) (Pankow, 1994; Seinfield and Pankow, 2003; Kroll and Seinfield, 2008).
SOA mass is generated in the atmosphere in various ways:a) low-volatility compounds can be formed in the gas phase and condense onto pre-existing particles or lead to the formation of new particles; b) it can also be formed by chemical transformation of primary components in the condensed phase; and c) as well chemical aging (transformation) of atmospheric aerosols can lead to the formation of multiple generations of secondary chemical components.
Organic aerosol originate from a wide range of both natural and anthropogenic sources including combustion of fossil fuels, direct injection of un-burnt fuel and lubricants, industrial emissions, plant matter, biomass burning, and biogenic emissions (Jacobson et al., 2000).
Current models estimate that secondary organic aerosol account for a dominant fraction of the total organic particulate mass (Baltensperger et al., 2005; Lanz et al., 2007; Robinson et al., 2007). Recent estimations of primary and secondary, biogenic and anthropogenic emissions are reported in the table below (tab. 1). Nevertheless the relative contribution of POA and SOA to the overall OA budget remains controversial due to the persistent discrepancies between measured OA concentrations and predictions of atmospheric chemistry models.
In particular, the chemical and physical processes associated with SOA formation and evolution are complex.
Table 1. Particles emission/production burdens estimated for the year 2000 (taken from Andreae and Rosenfeld, 2008)
1.2.1 Organic aerosol source apportionment
The organic source apportionment problem has been approached by numerous techniques.
A frequently adopted method to estimate primary and secondary OA has been to use the ratio between elemental and organic carbon (EC/OC) measured on aerosol filter samples (Turpin and Huntzicker, 1991).
An other widely adopted approach to apportion OA is the use of molecular markers, e. g. detected by GC-MS, with a chemical mass balance (Schauer et al., 1996). Several sources with unique markers can be identified, but source profiles must be known a priori and in generally only primary OA sources are accounted for by this method.
Recently have received much attention techniques based on carbon isotopic ratios (14C/12C) but they have very low time resolution (many hours to several days to collect enough material for the analyses) and overall can identify only few categories of sources (Szidat et al., 2006).
The last years have seen the development of a new generation of real-time aerosol chemical instrumentation based on mass spectrometry or ion chromatography, noticeably aerosol mass spectrometers(AMS) and particle in to liquid sampler (PILS) (Sullivan et al., 2004; DeCarlo et al., 2006; Canagaratna et al., 2007; Murphy et al., 2007). AMS produce ensemble average spectra for organic species and several methods (PCA, PMF) have been applied to deconvolve them into their principal components. The resulting main factors were commonly identified as hydrocarbon-like organic aerosol (HOA) and oxygenated organic aerosol (OOA) and were strongly linked to primary and secondary organic aerosol (POA and SOA). More advanced source apportionment methods further separate OOA in different types.
Other spectroscopic techniques such as nuclear magnetic resonance and infrared spectroscopies (NMR and FTIR) have been used aiming to OA source apportionment. In particular NMR spectroscopy allowed to separate biomass burning from marine and secondary organic aerosol (Decesari et al., 2007)
1.2.2 Gas-to-particle partitioning and volatility basis set
The most commonly studied mechanism of SOA formation is the oxidation of volatile organic compounds (VOCs), forming products with lower volatility that subsequently partition onto the condensed phase. Nevertheless temperature reduction, as well as reactive uptake via heterogeneous reactions and adsorption of chemical species, also shift species from the gas to particle phase.
A fundamental concept underlying the current SOA modelling concerns the treatment of the volatility of its components, including those present entirely in the condensed phase (non-volatile organics), as well as those that may be present in both the gas and the particle phase (semi-volatiles organics). The adopted definition of semi-volatile organic is quite broad involving saturation vapour pressures spanning seven orders of magnitude (Donahue et al., 2006).
Basically, SOA is though as composed predominantly by semi-volatile organics and consequently SOA formation can be described by gas-particle partitioning. The theoretical foundations on partitioning have been developed by Pankow in the 1990s (Pankow , 1994a, 1994b). In the Pankow’s partitioning theory each compounds is described by an equilibrium partitioning coefficient Kp,i (m3/µg), or equivalently by its inverse, the saturation vapour concentration Ci*(
µg/m3):
in which Cpi is the mass concentration of the semi-volatile species in the gas phase, Cgi is the mass
concentration of the semi-volatile species in the particle phase, and COA is the mass concentration of
the total absorbing particle phase. Odum et al . (1996) extended for the first time this model to SOA formation, showing that SOA yield (the mass of aerosol formed per mass of hydrocarbon reacted) can be expressed in terms of the formation of a collection of semi-volatile compounds:
In principle SOA formation can be calculated by carrying out the summation over all the semi-volatile compounds formed within a given reaction but such degree of details is unfeasible due to the large number of unknown compounds. Instead two surrogate products (i=2) have been
Figure 3. Schematic representation of the two-product model of SOA formation (taken by Odum et al., 1996) Recently Donahue and co-workers has proposed the use of a volatility basis set (VBS) to address this issue. The VBS approach is similar , though with a larger number of lumped semi-volatiles which span a wider range of prescribed vapour pressures (fig.4) (Donahue et al., 2006; Presto and Donahue, 2006; Pathak et al., 2007).
Figure 4. Representation of gas–particle partitioning for a complex mixture of semi-volatiles using (a–b) the two-product model, in which the semivolatiles are represented by two model compounds with experimentally determined vapor pressures, and (c–d) the volatility basis set, which employs a larger number of lumped compounds with prescribed vapor pressures. Partitioning at two mass loadings of organic aerosol is shown for each (figure taken from Kroll and Seinfield, 2008)
1.2.3 Heterogeneous reactions
The occurrence of polymeric material has been observed in SOA generated by aromatic compounds such as trimethylbenzene (Karlberer et al., 2004). Furthermore measurements performed on TMB-SOA by laser desorption ionization-mass spectrometry (LDI-MS) have shown that a substantial fraction of TMB-SOA mass is composed of polymers (fig. 5).
Figure 5. Figure taken from Karlberer et al., 2004. LDI-mass spectrum of TMB-SOA. In the inset is a detail from 480<m/z<625 where the regular repetitive structure typical of polymers is visible.
In that study an acetal polymerization mechanism with methylglyoxal as the main monomer unit has been proposed to explain the formation of these high molecular mass compounds in the particle phase (fig. 6).
2 Experimental
2.1 Laboratory experiments
Laboratory experiments are performed to study the chemistry and the physical properties of model systems representative of atmospheric aerosols. Most of the studies about SOA formation from VOCs oxidation are conducted in simulation chambers (i. e. static reactors or smog chambers), ranging in volume from 1 up to 300 m3 and designed to mimic atmospheric conditions as closely as possible. In order to generate SOA in controlled experimental conditions, the chambers are equipped with various instruments monitoring fundamental parameters such as gaseous precursors concentration, overall oxidant levels, temperature, relative humidity, light intensity and wavelength, etc.
Laboratory SOA characterized within the present work were produced in two different facilities, namely in the SAPHIR and PSI smog chambers. Technical data and instrumentations of the SAPHIR and PSI chambers are described in detail by Bohn and Paulsen papers respectively (Bohn et al., 2005 and Paulsen et al., 2005). A basic technical description of them follows in the table below.
chamber
SAPHIR PSI
institute ICG-Jülich Forschungzentrum,
Jülich, Germany
LAC-Paul Scherrer Institut , Villigen (Switzerland)
volume (m3) 270 27
wall material Teflon-FEP, double wall Teflon-FEP
lighting sun xenon arc lamps
temperature range (°C) outside temperature 15-30
The SAPHIR facility is a very large outdoor chamber which uses the sun as natural light source (see picture SAPHIR). The wall material is chemically inert and UV transparent (80% of the outside actinic flux (290–420 nm) is generally available inside the chamber. It is also equipped with a louvre system which permits to modulate the radiation reaching the chamber up to dark conditions. In the indoor PSI facility, four xenon arc lamps mimic the sun’s UV radiation supplying the energy required for the chemical reactions taking place in the chamber (see picture PSI chamber).
Synthetic SOA particles are generated in the chambers oxidizing a variety of organic gases by species such as the hydroxyl radical (OH), ozone (O3) and nitrate radical (NO3). OH is a universal
oxidizing agent in the troposphere, being capable to react with all volatile organic compounds. Photolytical OH radical sources typically used in chambers are listed below:
O3 + H2O+ hν→ 2OH (O3 photo-dissociation)
HONO + hν→ OH + NO (nitrous acid photo-dissociation) Laboratory-SOA characterized within the present work were mostly produced in NOx
photo-oxidation experiments, nevertheless few nitrous acid photo-photo-oxidation and ozonolysis experiments were also performed.
Terpenes and aromatic hydrocarbons are respectively regarded as the main biogenic and anthropogenic compounds contributing to SOA mass, thus volatile precursors for the laboratory experiments were chosen among these chemical classes.
The outdoor chamber SAPHIR in Jülich, Germany.
2.1.1 Laboratory-biogenic SOA production
The contribution of a given volatile compound to produce SOA in the atmosphere depends concurrently on its emission rate (atmospheric abundance), its chemical reactivity and on the volatility of its oxidation products. Among the hydrocarbons emitted by terrestrial vegetation, isoprene, monoterpenes (MT) and sesquiterpenes (SQT) are estimated to be the major source of secondary organic particulate matter on the basis of the three above-mentioned features (Kanakidou et al., 2005; Goldstein and Galbally, 2007).
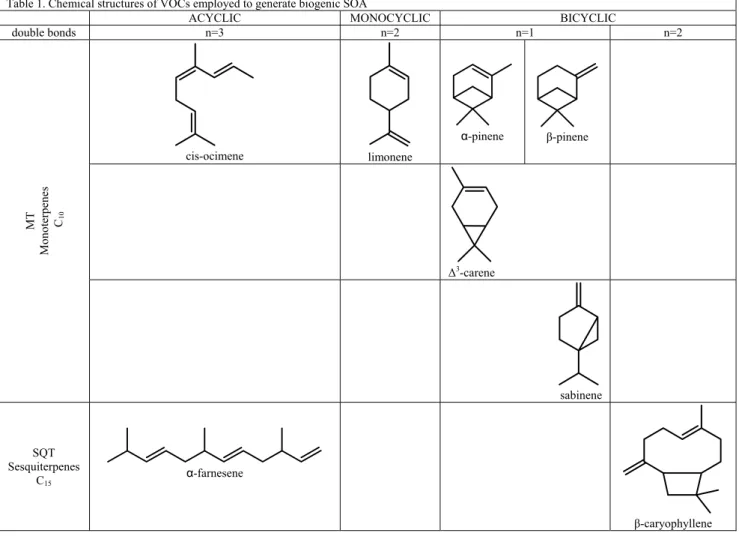
Biogenic SOA analyzed in the present study were produced by photo-oxidation of α-pinene (α-pin), mixtures of monoterpenes, and mixtures of monoterpenes and sesquiterpenes. The laboratory experiments were performed at the PSI and SAPHIR facilities in the framework of the PolySOA and EUCAARI projects. The mixtures employed to generate biogenic SOA are representative for VOCs emitted typically by European boreal forests where conifers such as pine and spruce are the most dominant tree species with few contributes from broadleaf deciduous trees such as birch and larch (table 1). Biogenic SOA were mostly produced in NOx photo-oxidation experiments,
Table 1. Chemical structures of VOCs employed to generate biogenic SOA
ACYCLIC MONOCYCLIC BICYCLIC
double bonds n=3 n=2 n=1 n=2 cis-ocimene limonene α-pinene β-pinene ∆3-carene MT M onoter penes C10 sabinene SQT Sesquiterpenes C15 α-farnesene β-caryophyllene
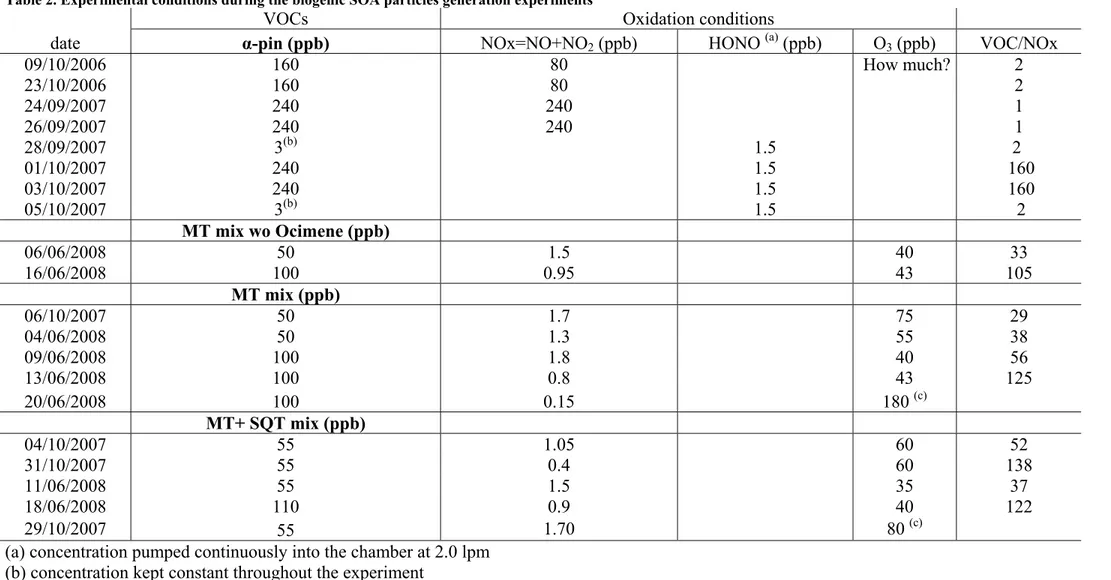
Table 2. Experimental conditions during the biogenic SOA particles generation experiments
VOCs Oxidation conditions
date α-pin (ppb) NOx=NO+NO2 (ppb) HONO (a) (ppb) O3 (ppb) VOC/NOx
09/10/2006 160 80 How much? 2 23/10/2006 160 80 2 24/09/2007 240 240 1 26/09/2007 240 240 1 28/09/2007 3(b) 1.5 2 01/10/2007 240 1.5 160 03/10/2007 240 1.5 160 05/10/2007 3(b) 1.5 2 MT mix wo Ocimene (ppb) 06/06/2008 50 1.5 40 33 16/06/2008 100 0.95 43 105 MT mix (ppb) 06/10/2007 50 1.7 75 29 04/06/2008 50 1.3 55 38 09/06/2008 100 1.8 40 56 13/06/2008 100 0.8 43 125 20/06/2008 100 0.15 180(c) MT+ SQT mix (ppb) 04/10/2007 55 1.05 60 52 31/10/2007 55 0.4 60 138 11/06/2008 55 1.5 35 37 18/06/2008 110 0.9 40 122 29/10/2007 55 1.70 80(c)
(a) concentration pumped continuously into the chamber at 2.0 lpm (b) concentration kept constant throughout the experiment
2.1.2 Laboratory-anthropogenic SOA production
1,3,5-trimethylbenzene (TMB) was employed in laboratory experiments as single gaseous precursor representative for aromatic VOCs emitted by anthropogenic sources.
1,3,5-trimethylbenzene (TMB)
All the experiments performed to produce anthropogenic SOA were carried out at the PSI smog chamber in the frame of the EU-funded project PolySOA (web reference). In a typical photo-oxidation experiment, the humidification of the chamber to the desired humidity value (~50% relative humidity, RH) was achieved before the injection of the other components and after that, they were let to diffuse and mix for at least 30 min before the experiment was started by turning on the lights. The initial TMB concentration was almost always pretty high (1200 ppb) as well the NOx
level (600 ppb), except for few experiments where TMB initial level was 600 ppb and NOx was 300
ppb. Hence most of the photo-oxidation experiments were carried out under high NOx conditions
with an initial VOC/NOx ratio of 2 (table 3). The temperature in the smog chamber was kept
Table 3. Experimental conditions during the anthropogenic SOA particles formation experiments.
mean aerosol mass conc.a (µg/m3)
exp. date (dd/mm/yy) TMB (ppb) NOx (ppb) SO2 (ppb)
initial stage final stage 1 04/10/06 600 300 0.4 54 2 06/10/06 1200 600 0.8 128 3 11/10/06 1200 600 2 135 155 4 13/10/06 1200 600 2 162 159 5 18/10/06 1200 600 2 142 135 6 20/10/06 1200 600 2 160 160 7 19/10/07 1200 300 2 103 101 8 21/10/07 1200 300 2 108 101 a
Aerosol mass concentration from SMPS data assuming a density of 1 g cm-3 and spherical particles. Two averaged values are respectively given for the initial and final stages of the aerosol growth, corresponding to the filter sampling times in each experiment.
2.1.3 Organics loading in the chamber experiments
Over the last two decades, several laboratory experiments have been conducted to study the formation of SOA, constituting the basis to parameterize SOA formation and evolution in the real atmosphere. Laboratory studies must mimic the ambient conditions with specific attention to key parameters. For instance, the organics loading, i.e., the concentration of SOA inside the chamber, has been proved to be very important. In fact, it has been shown that laboratory loadings higher than those present in atmosphere favour the partitioning of slightly oxidized species which would otherwise remain in gas phase under atmospheric conditions (Duplissy et al., 2008). At the same time, the limited volume of the reaction chambers imply a minimum concentration of SOA inside to guarantee a sufficient amount of sample for the chemical analyses.
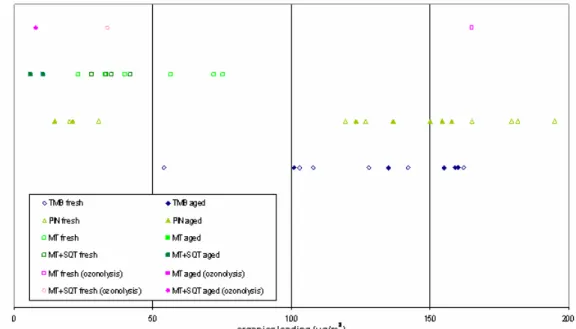
The organics loadings reached during the laboratory experiments considered in this thesis are shown in the graphic below. Different lines in the graph refer to distinct VOCs. Starting from the bottom are encountered values for TMB, α-pin, MT and SQT photo-oxidation experiments respectively. The three values in the upper line belong to the ozonolysis experiments. The organics loadings observed in ambient exceed very rarely 25 µg/m3 as reported by worldwide AMS data (Jimenez et al., 2009).
Figure 5. Mean aerosol mass concentrations calculated from SMPS data (assuming a density of 1 g cm-3 and
spherical particles) and averaged upon the filter sampling times. The values are lumped in different lines depending on the precursors employed: starting from the bottom are listed TMB, α-PIN, MT and SQT photo-oxidation experiments. In the upper line are those of ozonolysis experiments. Empty and filled symbols stand respectively for the organics loading present in the initial and final part of each experiment.
2.2 Field data
Ambient aerosol samples analyzed within this thesis were mostly collected during various intensive field experiments set up in the frame of the EU-funded EUCAARI project. The joint-measurements campaigns were carried out at six European sites selected on the basis of their different typology of aerosol emission patterns and pollution levels. Referring to the criteria used by Van Dingenen and coworkers for Europe (Van Dingenen et al., 2004), e.g. the distance from pollution sources, the sites can be classified into: marine background, natural continental background, rural background, near-city background or urban background (table 4).
ID site position altitude
(m asl) typology operated by MHD Mace Head, Ireland 53° 19’ N, 9° 53’W 5 marine background National University of Ireland, Galway HYY Hyytiälä, Finland 61º 51’ N, 24º 17’ E 181 natural continental
background University of Helsinki
KPO K-Puszta, Hungary 46° 58’ N, 19° 33’ E 125 rural background
Hungarian Meteorological Service and ACUV CBW Cabauw, Netherlands 51° 18’ N,
04° 55’ E 60 rural background KNMI
SPC San Pietro Capofiume, Italy 44º 39’ N, 11º 37’ E 11 near-city background ISAC-CNR and regional environmental protection agency MPZ Melpitz, Germany 51° 32’N, 12° 54’ E 87 near-city background
Leibniz Institute for Tropospheric Research Table 4. Synthetic description of the sites.
Intensive observing periods (IOP) of the field measurement campaigns are reported in the table 2 along with number and type of the collected samples.
IOP samples n° aerosol type
site (year)
start exp. date stop exp. date
HYY (2007) 29/03/2007 18/04/2007 22 PM1 SPC (2008) 31/03/2008 20/04/2008 34 PM1 and PM1-10 CBW (2008) 08/05/2008 26/05/2008 30 PM1 and PM1-10 MPZ (2008) 01/05/2008 31/05/2008 15 PM2.5-PM2.5-10 MHD (2008) 17/05/2008 10/06/2008 7 PM1.5-PM1.5-10 KPO (2008) 26/05/2008 14/08/2008 10 PM
2.2.1 Mace Head
The atmospheric research station of Mace Head is located on the west cost of Ireland, offering a westerly exposure to the North Atlantic ocean. The climate is prevalently dominated by maritime air masses: on average over 60% of air masses arrive to the site from a clean sector (180° through west to 300°). In fact, it has been shown that this site can be representative of clean background marine air (Rinaldi et al., 2009). By contrast, when easterly air masses reach the station, aerosols characteristic of the European pollution background are observed. More details on the station are available on the official web site (http://macehead.nuigalway.ie/ ).
Figure 2. Mace Head Atmospheric Research Station. Department of Experimental Physics National University of Ireland, Galway.
2.2.2 Hyytiälä
The Finnish Station for Measuring Forest Ecosystem-Atmosphere Relations (SMEAR II) is located in Hyytiälä, Finland. This forestry station is situated in the middle of a more than 40-years old Scots pine stand (Pinus Sylvetrsis L.) which surrounds homogeneously the site for about 200 m in all directions and it extends up to 1.2 km towards the North. Tampere is the largest city nearby and it is situated more than 60 km S-SW far. In fact, it has been shown that this site can be representative of the boreal coniferous forest. More details on the station are available on the official web site (http://www.mm.helsinki.fi/hyytiala/english/eng_index.htm ).
Figure 3. Landscape surrounding the Hyytiälä forestry field station (SMEAR II). Faculty of Agriculture and Forestry, Helsinki University.
2.2.3 K-Puszta
K-Puszta is a central European site located in the middle of the Hungarian plain. The station is surrounded by coniferous forests spaced out with clearings. The station resides at 80 km south-east far from Budapest. The largest nearby town (Kecskemét, 110,000 inhabitants) is 15 km far from the station, S-E direction. Thus the site can be representative of the European rural background as well as more polluted air masses depending on the meteorological conditions.
2.2.4 Cabauw
The Cabauw Experimental Site for Atmospheric Research (CESAR) is located in flat rural area in the western part of The Netherlands. The North Sea is more than 50 km away from the site in the N-W direction. The region nearby the site is predominantly agricultural although the station is not very far from large cities such as Amsterdam and Utrecht. Hence the site offers the opportunity to study a variety of air masses from clean maritime to continental polluted ones. More details on the station are available on the official web site (http://www.cesar-database.nl/About.do ).
Figure 4. Landscape surrounding the CESAR observatory. The Royal Netherlands Meteorological Institute.
2.2.5 San Pietro Capofiume
The Italian field station is located at San Pietro Capofiume in a flat rural area in the river Po Valley region. The Adriatic Sea is more than 60 km away from the site in the east direction. The closest large cities are Bologna and Ferrara which are each roughly 40 km far from the site. This region is overall characterized by a high population density and by intensive agricultural as well industrial activities. Moreover major highways cross this area. Hence according to EMEP (European Monitoring and Evaluation Programme under the Convention on Long-range Transboundary Air Pollution) conventions this site can be representative even for urban background air.
Figure 5. Atmospheric research station “G. Fea”, San Pietro Capofiume. ISAC-CNR.
2.2.6 Melpitz
The IFT-Melpitz ground-based research station is located in the river Elbe Valley in Germany. Melpitz is a small village surrounded by agricultural land interspersed by edges of forest and it is far from the city of Leipzig about 40 km in the southwest direction. Nevertheless major highways cross the region at a minimum distance of 1.5 km. Moreover during high pressure conditions dry air masses are transported from the north-east area where coal heated power plants and old industries
predominantly from the south-west direction after crossing part of western Europe. Hence Melpitz can be described as a rural polluted continental site.
2.3 Samples handling and analysis
2.3.1 Sampling methods
Within this work aerosol samples have been prevalently collected on quartz micro fiber filters (QMA grade purchased by Whatman or Pall), except for few chamber experiments where Teflon substrates have been used, and then analyzed off-line. The quartz fiber filters were washed with Milli-Q water and fired for 1h at 800 °C before sampling in order to reduce their blank values. The Teflon substrates were as well cleaned with Milli-Q water but left to dry in a clean room for 24 h before sampling.
Atmospheric aerosols have been sampled by various high volume samplers depending on the instrument available on the site. During the intensive observing periods held in the SPC and CBW stations was employed a Dichotomous high volume sampler from MSP Corporation (Universal Air Sampler, model 310) working at a constant nominal air flow rate of 300 L/min. The Dichotomous sampler allowed to collect atmospheric aerosols in their PM1 and PM1-10 fractions. A Sierra
Andersen high volume sampler, segregating PM1.5 and PM1.5-10 particles, was used in the MHD
station. PM2.5 and PM2.5-10 fractions of atmospheric aerosol were obtained in the MPZ station using
a Digitel high volume sampler. In the HYY and KPO stations were employed two high volume samplers working at 600 and 850 L/min and configured to remove particles with aerodynamic diameter larger than 1 and 2.5 µm respectively.
Synthetic SOA particles formed in the chamber experiments were simply pumped to the filters sucking up the air inside the chamber at a flow rate of 10 or 20 L/min. Sampling times lasted typically two hours. Denuders (charcoal or XAD resins) upstream the filter holders were employed to remove gaseous organic compounds from the sampled air stream to prevent positive artefacts. A sampling tandem configuration consisting in the use two piled filters, one front (F) and one back up (BU) filter, in separate filter holders, was adopted when possible in order to assess negative sampling artefacts.
In order to investigate the laboratory-SOA chemical composition in parallel with their photochemical aging, two filters sets were generally collected in subsequent moments of each chamber experiments. Thus obtaining fresh SOA from the initial part and aged SOA from the final
with α-pinene and 1,3,5-trimethylbenzene as gaseous precursors) lasted typically 8 hours: fresh SOA was roughly collected between the 4th and the 6th hour while aged SOA between the 6th and the 8th hour. In the case of SOA formed in the SAPHIR simulation chamber, typical aging experiments ran up to about 30 hours. A two-hours sampling was performed in the first day of the experiment, during the particles generation, while a second sampling was performed in the day after. In this way the aged SOA particles were actually subjected to a long time OH-radical exposure.
After sampling the aerosol samples were stored in a fridge at 4 ° C until the analyses.
2.3.2 Analytical methods
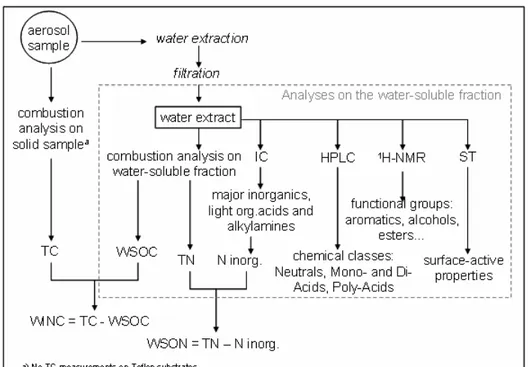
A scheme of the analytical protocol deployed to characterize the aerosol samples collected on quartz fiber filters (or in few cases on Teflon substrates) is reported below (fig.1). Overall a small portion of the samples was directly subjected to high temperature combustion analysis in order to measure their Total Carbon (TC) content, except for samples collected on Teflon substrates on which TC analysis is not feasible. The leftover filter portions underwent extraction with ultrapure mQ water (Millipore, 18.2 mOhm cm water resistivity): about 1 mL of mQ water per filter’s cm2 has been generally employed. The extraction procedure was performed using a ultrasonic bath on quartz fiber filters and by stirring on Teflon substrates: 60 minutes for the former and 30 minutes for the latter. After sonication, water extracts were filtered on PTFE membranes (pore size 0.45 µm) in order to remove suspended particles. After filtration the water extract was split into aliquots devoted to the various analyses on the dissolved water soluble organic matter as schematically reported in figure 7. Additional analytical details will be reported in the following sections.
Figure 7. Scheme of the analytical protocol deployed to characterize aerosol samples.
2.3.2.1 Total Carbon (TC) analysis
Total carbon content was directly measured on a small portion of the quartz fiber filters (about 1 cm2) by evolved gas analysis. Measurements were performed by a Multi N/C 2100 elemental analyser (Analytik Jena, Germany) equipped with a furnace suited for solid samples. Inside the furnace samples were exposed to increasing temperature (up to 950 °C) in a pure oxygen carrier gas. Under these conditions all carbonaceous matter (Organic Carbon, Carbonate Carbon and Elemental Carbon) is converted in CO2 (Gelencser et al., 2000). TC is measured as total evolved
CO2 by a non-dispersive infrared (NDIR) analyser. The instrumental detection limit was 0.2 µgC
and the accuracy resulted better than 5% for 1 µgC.
2.3.2.2 Water Soluble Organic Carbon (WSOC) analysis
WSOC content was measured by the liquid module of the above-mentioned Multi N/C 2100 total organic carbon analyser. For each aqueous sample parallel measurements of carbonate carbon (CC) and total soluble carbon (TSC) were carried out. The measure of the TSC is performed by catalytic high temperature combustion in a pure oxygen carrier gas (up to 800 ° C in presence of Pt as catalyst) and a NDIR detector. The measure of the CC content is provided by the acidification of the sample before its combustion. The difference between the measured total soluble carbon and
showed a reproducibility within 5% for both TSC and carbonate carbon at the concentrations typically employed for samples extracts (i.e. between 0.5 and 5 ppmC).
2.3.2.3 Ion Chromatography (IC)
The inorganic water soluble fraction of the ambient aerosol samples has been characterized by means of Ion Chromatography (IC). Inorganic ions (NH4+, Na+, K+, Mg2+, Ca2+, Cl-, NO2-, NO3-,
SO42- ) were identified along with light organic acids ions such as acetate (Ace), formate (For),
oxalate (Oxa) and methanesulfonate (MSA). Even light alkyl ammonium ions were identified such as mono-, di- and tri-methyl ammonium ions (MMA+, DMA+, TMA+), and mono-, di- and tri-ethyl ammonium ions (MEA+, DEA+, TEA+).
A Dionex instrument (ICS-2000) equipped with a conductivity detector, a gradient pump and a self –regenerating suppressor has been used to separate and quantify the above-listed ions. Anions were specifically analyzed by the ion chromatograph, equipped with IonPac AG11 2x50mm Dionex guard column, IonPac AS11 2x250mm Dionex separation column and ASRS ULTRA II self-regenerating suppressor. A solution of KOH was used as eluent. Its concentration increased from 0.1 mM to 38 mM, in a 25 minutes long run (0.1 mM for 8 min, 5 mM reached at 12 min, 10 mM at 17 min and 38 mM at 25 min). The flow rate was 0.25 mL/min. Cations were analyzed with the same ion chromatograph, equipped with IonPac CG16 3x50 mm Dionex guard column, IonPac CS16 3x250mm Dionex separation column and CSRS ULTRA II self-regenerating suppressor. The analysis were performed isocratically with a 30 mM solution of MSA as eluent held for 35 min. The flow rate was 0.36 mL/min.
The detection limit for the analysed inorganic ions corresponds to an average air concentration of 4 ng/m3, except for sodium, nitrite and calcium for which it is 45 ng/m3.
2.3.2.4 Water Solubile Organic Nitrogen (WSON)
The above-mentioned Multi N/C elemental analyser has been even employed to measure also the Total Soluble Nitrogen (TSN) content of the water-soluble fraction of the aerosol. The instrument’s module for nitrogen analysis is equipped with a chemiluminescence detector to measure the NOx
lower concentrations (8% at 300 ppbN).
Once determined the TSN, the Water Soluble Organic Nitrogen (WSON) content was calculated subtracting the inorganic nitrogen content derived by ion chromatography (i.e. the sum of nitrate, nitrite and ammonium).
2.3.2.5 WSOC separation by High Performance Liquid Chromatography (HPLC)
A new liquid chromatography method has been applied to simplify the initial complex mixture of water soluble organics into few main chemical classes according to their neutral/acidic character (Mancinelli et al., 2007). An anion exchange HPLC method coupled to WSOC analysis was specifically exploited to quantitatively resolving water soluble organics into: neutral compounds (N), mono- and di-acids (MA and DA), and poly-acids (PA, i.e. compounds carrying more than two carboxylic groups).
The analyses were performed on a HPLC instrument from Agilent (Model 1100), equipped with a TSK-GEL® DEAE-5PW column (7.5mm i.d. × 7.5 cm length, Tosoh Bioscience), an autosampler, UV detector and a fractions collector. The selected injection volume, flow rate and wavelength were respectively 1 mL, 0.7 mL/min and 260 nm. The mobile phase consisted of A) mQ water and B) a ClO4-/PO43- buffer solution at pH 7 (NaClO4 0.5 M, KH2PO4 0.05 M, NaOH 0.044 M) whose
composition changed towards an increasing ionic strength within the eluition program . The mobile phase composition changed as follows: A 100 % isocratically from 0 to 8 min; first gradient from 8 to 15 min reaching B 10 %; B 10 % isocratically from 15 to 21 min; second gradient from 21 to 26 min reaching B 100 %; final gradient back to A from 26 to 31 min. N, MA, DA and PA compounds were subsequently eluted and collected on the bases of time intervals chosen depending on the minima between the UV peaks in the chromatogram (7-20 min for N, 20-23 min for MA, 23-30 min for DA and 30-37 min for PA). Avoiding organic additives, the mobile phase does not interfere with the measure of the dissolved organic carbon in the HPLC collected fractions thus allowing the direct WSOC analyses after the collection (before the elemental analysis PA fractions were acidified with 50 µL HCl conc. and purged with CO2 free-air to remove the carbonates due to the
mobile phase).
The instrumental detection limits of the NB, MA, DA and PA fractions were 2.2, 1.0, 1.3 and 3.2 µgC, respectively.
2.3.2.6 WSOC characterization by proton-Nuclear Magnetic Resonance (
1H-NMR)
spectroscopy
1H-NMR spectroscopy in deuterum oxide (D
2O) solution was exploited to functional group
characterization of water soluble organics. Aliquots of water extracts were dried under vacuum and re-dissolved in 650 µL D2O. Sodium 3-trimethylsilyl-(2,2,3,3-d4) propionate (TSP-d4) was
prevalently used as referred internal standard adding 50 µL of a TSP-d4 0.05 % (w/w) solution in
D2O (1.455 µmol H belonging to the standard in the probe) following the protocol already tested by
Decesari (Decesari et al., 2000; Tagliavini et al., 2006). In some cases methanol (MeOH) was used as alternative internal standard (0.5 µmol H belonging to the standard in the probe). The 1H-NMR spectra were acquired with a Varian spectrometer working at 400 MHz (Mercury 400) in 5 mm probes. Mono-deuterated water (HDO) signal’s pre-saturation was always performed nevertheless residuals were still appearing in few spectra in the region between 4.5-5.5 ppm.
At least 80 µg of carbon content has to be in the sample aliquot destined to 1H-NMR experiments in order to achieve a good signal to noise ratio. Due to its limited sensitivity, 1HNMR spectroscopy has been rarely applied to the analysis of atmospheric aerosols, nevertheless this technique offers several advantages with respect to other techniques such as GC/MS, LC/MS or AMS.
In principle, 1H-NMR spectroscopy can detect any protons belonging to the organic molecules, but it is mainly sensitive to protons attached to carbon atoms (i.e. H-C bonds) because, in aqueous solutions, the hydrogen atoms attached to oxygen and nitrogen atoms (e.g. H-O of carboxylic acids, alcohols and the H-N bonds of amines) are exchanged with the solvent and cannot be detected. Then, sensitivity is higher for functional groups carrying more hydrogen atoms, i.e., it is higher for methyls than for methylenes or methynes, and it is higher for aliphatic than for aromatic compounds.
1H-NMR spectroscopy thus provides information about both the main structural units as well it is
able to identify individual compounds. Moreover, it is not affected by the interference of inorganic compounds.
An important advantage of 1H-NMR spectroscopy is that quantitative analysis is straightforward:
the integrals of the peaks in 1H-NMR spectra are proportional to the molar concentrations of hydrogen atoms within 15%. Then, a simple a-specific internal standard can be used for calibration
hydrogen atoms associated with the various functional groups. To derive the molar concentrations of the functional groups, their stoichiometry is required, i.e., the H:C ratios.
Most of the signal in spectra of aerosol samples is accounted for unresolved bands rather than narrow peaks attributable to single compounds. On the basis of the range of frequency shifts (the so-called chemical shift, ppm) in which these bands occur, they can be attributed to different functional groups. Since there are a lot of overlaps between the characteristic chemical shifts of the various functional groups, the functionality that can be resolved unambiguously are limited to: H-(C=O)R ( > 9 ppm): aldehydic protons;
H-Ar (6.5-8.5 ppm): aromatic moieties;
H-C= (4.5-6.5 ppm): vinylic or (hemi)acetalic protons;
H-C-O (3.3-4.5 ppm): protons bound to oxygenated aliphatic carbon atoms such as alcohols and ethers;
H-C-C= (1.9-3.3 ppm): aliphatic groups adjacent to unsaturated carbon atoms such as carbonyls and carboxyls or benzylic protons;
3 Results
3.1 Terrestrial biogenic SOA
3.1.1 Alpha-pinene SOA
Here are present data on chemical characterization of biogenic SOA formed in photo-oxidation experiments with α-pinene. A complete list of the collected samples is reported in the table below.
VOC oxidants sample ID exp. date (ppb) α-pin (ppb) NOx HONO (ppb)
front back up SOA mass. conc. (µg/m3) sampling volume (m3) PIN_091006_F PIN_091006_BU 195 1.6 09/10/2006 160 80 PIN_231006_1F_teflon PIN_231006_1BU 165 0.65 23/10/2006 160 80 PIN_231006_2F_teflon PIN_231006_2BU 150 0.90 PIN_240907_1F PIN_240907_1BU 182 0.87 24/09/2007 240 240 PIN_240907_2F PIN_240907_2BU 158 0.87 PIN_260907_1F_teflon PIN_260907_1BU 179 0.86 26/09/2007 240 240 PIN_260907_2F_teflon PIN_260907_2BU 154 0.85 PIN_011007_1F_teflon PIN_011007_1BU 119 0.80 01/10/2007 240 1.5 PIN_011007_2F_teflon PIN_011007_2BU 123 0.79 PIN_031007_1F PIN_031007_1BU 127 0.84 03/10/2007 240 1.5 PIN_031007_2F PIN_031007_2BU 137 1.0 PIN_280907_1F PIN_280907_1BU 20 4.0 28/09/2007 3 1.5 PIN_280907_2F PIN_280907_2BU 15 6.6 PIN_051007_1F PIN_051007_1BU 30 4.8 05/10/2007 3 1.5 PIN_051007_2F PIN_051007_2BU 21 6.3
Table 6. List of SOA samples collected during experiments employing α-pinene as precursor VOC. Two filters sets were sampled each experiment: numbers 1 or 2 in the sample ID stand for sets sampled in the initial or in the final part of the experiment respectively. Only one sampling was done in the first experiment. The sample ID reports as well when Teflon was used as alternative substrate. Grey colour is used for back up filters. The mean aerosol mass concentrations are calculated from SMPS data and averaged upon the filters sampling times. The experiments lasted roughly 8 hours and two filters sets were typically sampled in subsequent moments in order to obtain fresh SOA from the initial part and aged SOA from the final part of each experiment: fresh SOA was roughly collected between the 4th and the 6th hours while aged SOA between the 6th and the 8th hours (fig. 1).
Figure 1. Typical time-resolved number-weighted size distribution from a photo-oxidation experiment. The measured total and water-soluble organic carbon contents are reported in the table 2.
front back up
sample ID TC (µg C /m3) WSOC (µg C /m3) TC (µg C /m3) WSOC (µg C /m3)
PIN_091006 138 95 25.96 16.99 PIN_231006_1_teflon n.a. 71 64 41 PIN_231006_2_teflon n.a. 34 86 35 PIN_240907_1 150 71 7.5 1.6 PIN_240907_2 103 79 7.5 5.3 PIN_260907_1_teflon n.a. 73 34 1.7 PIN_260907_2_teflon n.a. 81 44 5.4 PIN_011007_1_teflon n.a. 20 44 36 PIN_011007_2_teflon n.a. 16 38 33 PIN_031007_1 135 58 12 4.0 PIN_031007_2 96 78 16 12 PIN_280907_1 20 11 2.9 1.2 PIN_280907_2 11 8.5 2.3 1.5 PIN_051007_1 27 13 6.4 3.4 PIN_051007_2 18 9.9 3.9 2.5
Table 2. Total and water-soluble organic contents of α-pin-SOA. TC analyses are not feasible for Teflon substrates.
The aerosol mass concentrations obtained by off-line measurements on quartz filter samples resulted to fit nicely with those calculated from SMPS data, particularly with values corresponding to experiments conducted at low VOC level (fig. 2). On the contrary, samples collected on Teflon substrates resulted affected by negative artefacts. Since the carbon loadings of such substrates were found systematically in defect with respect to those expected from SMPS data, the hereinafter comments will concern only quartz filter samples.