2020-12-02T14:58:53Z
Acceptance in OA@INAF
ATCA observations of the MACS-Planck Radio Halo Cluster Project. II. Radio
observations of an intermediate redshift cluster sample
Title
Martinez Aviles, G.; Johnston-Hollitt, M.; Ferrari, C.; VENTURI, Tiziana; Democles,
J.; et al.
Authors
10.1051/0004-6361/201731521
DOI
http://hdl.handle.net/20.500.12386/28631
Handle
ASTRONOMY & ASTROPHYSICS
Journal
611
Number
Astronomy
&
Astrophysics
https://doi.org/10.1051/0004-6361/201731521© ESO 2018
ATCA observations of the MACS-Planck Radio Halo Cluster Project
II. Radio observations of an intermediate redshift cluster sample
?
G. Martinez Aviles
1, M. Johnston-Hollitt
2,3, C. Ferrari
1, T. Venturi
4, J. Democles
5, D. Dallacasa
6,4, R. Cassano
4,
G. Brunetti
4, S. Giacintucci
7, G. W. Pratt
5, M. Arnaud
5, N. Aghanim
8, S. Brown
9, M. Douspis
8, J. Hurier
8,
H. T. Intema
10, M. Langer
8, G. Macario
1, and E. Pointecouteau
11,121 Université Côte d’Azur, Observatoire de la Côte d’Azur, CNRS, Laboratoire Lagrange, Bd de l’Observatoire, CS 34229,
06304 Nice cedex 4, France
e-mail: [email protected]
2 School of Chemical & Physical Sciences, Victoria University of Wellington, PO Box 600, Wellington 6140, New Zealand 3 Peripety Scientific Ltd., PO Box 11355 Manners Street, Wellington 6142, New Zealand
4 INAF- Istituto di Radioastronomia, via P. Gobetti 101, 40129 Bologna, Italy
5 Laboratoire AIM, IRFU/Département d’Astrophysique – CEA/DRF – CNRS – Université Paris Diderot, Bât. 709, CEA-Saclay,
91191 Gif-sur-Yvette Cedex, France
6 Department of Physics and Astronomy, UniBO, Via Gobetti 93/2, 40129 Bologna, Italy
7 Naval Research Laboratory, 4555 Overlook Avenue SW, Code 7213, Washington, DC 20375, USA
8 Institut d’Astrophysique Spatiale, CNRS, Univ. Paris-Sud, Université Paris-Saclay, Bât. 121, 91405 Orsay cedex, France 9 Department of Physics & Astronomy, University of Iowa, Iowa City, IA 52245, USA
10Leiden Observatory, Leiden University, Niels Bohrweg 2, 2333CA Leiden, The Netherlands 11CNRS, IRAP, 9 avenue Colonel Roche, BP 44346, 31028 Toulouse cedex 4, France 12Université de Toulouse, UPS-OMP, IRAP, Toulouse, France
Received 6 July 2017 / Accepted 6 September 2017
ABSTRACT
Aims. A fraction of galaxy clusters host diffuse radio sources whose origins are investigated through multi-wavelength studies of cluster samples. We investigate the presence of diffuse radio emission in a sample of seven galaxy clusters in the largely unexplored intermediate redshift range (0.3 < z < 0.44).
Methods. In search of diffuse emission, deep radio imaging of the clusters are presented from wide band (1.1–3.1 GHz), full resolution (⇠5 arcsec) observations with the Australia Telescope Compact Array (ATCA). The visibilities were also imaged at lower resolution after point source modelling and subtraction and after a taper was applied to achieve better sensitivity to low surface brightness diffuse radio emission. In case of non-detection of diffuse sources, we set upper limits for the radio power of injected diffuse radio sources in the field of our observations. Furthermore, we discuss the dynamical state of the observed clusters based on an X-ray morphological analysis with XMM-Newton.
Results. We detect a giant radio halo in PSZ2 G284.97-23.69 (z = 0.39) and a possible diffuse source in the nearly relaxed cluster PSZ2 G262.73-40.92 (z = 0.421). Our sample contains three highly disturbed massive clusters without clear traces of diffuse emission at the observed frequencies. We were able to inject modelled radio haloes with low values of total flux density to set upper detection limits; however, with our high-frequency observations we cannot exclude the presence of RH in these systems because of the sensitivity of our observations in combination with the high z of the observed clusters.
Key words. galaxies: clusters: general – galaxies: clusters: intracluster medium – radiation mechanisms: non-thermal – radio continuum: galaxies
1. Introduction
Observations of diffuse synchrotron radio emission in clus-ters of galaxies provide evidence of the interactions between ultra-relativistic particles and magnetic fields in the intraclus-ter medium (ICM). At present, there are three main classes of large-scale diffuse radio emission in clusters: relics, haloes, and mini-haloes.
?The reduced images are only available at the CDS via
anonymous ftp to cdsarc.u-strasbg.fr (130.79.128.5) or via
http://cdsarc.u-strasbg.fr/viz-bin/qcat?J/A+A/611/A94
Radio relics are large (⇠1 Mpc) polarized diffuse sources generally elongated in shape that are present in the peripheral regions surrounding galaxy clusters. The mechanism responsible for their creation is associated with shocks generated in the ICM caused by a merger (Brunetti & Jones 2014), although recently some relic-radio galaxy association has been discovered (see e.g. van Weeren et al. 2017). Radio mini-haloes are much smaller (⇠100–500 kpc) roundish sources present in cool-core clusters (Giacintucci et al. 2017) that surround a radio-loud active galac-tic nucleus (AGN) present in the brightest cluster galaxy (BCG; Govoni et al. 2009). The origin of mini-haloes is explained by a population of relativistic particles re-accelerated in the
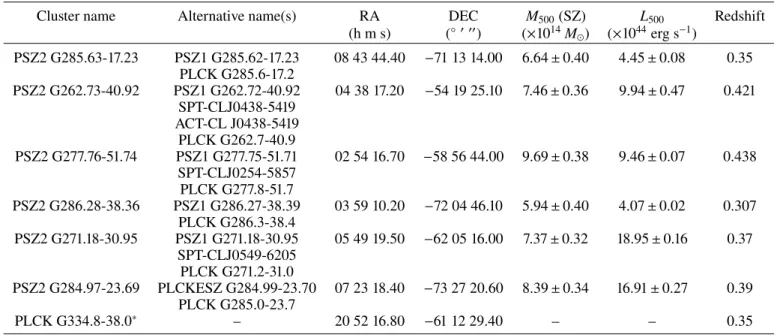
Table 1. Information concerning the clusters of the MACS-Planck RHCP ATCA sample.
Cluster name Alternative name(s) RA DEC M500(SZ) L500 Redshift
(h m s) ( 0 00) (⇥1014M ) (⇥1044erg s 1) PSZ2 G285.63-17.23 PSZ1 G285.62-17.23 08 43 44.40 71 13 14.00 6.64 ± 0.40 4.45 ± 0.08 0.35 PLCK G285.6-17.2 PSZ2 G262.73-40.92 PSZ1 G262.72-40.92 04 38 17.20 54 19 25.10 7.46 ± 0.36 9.94 ± 0.47 0.421 SPT-CLJ0438-5419 ACT-CL J0438-5419 PLCK G262.7-40.9 PSZ2 G277.76-51.74 PSZ1 G277.75-51.71 02 54 16.70 58 56 44.00 9.69 ± 0.38 9.46 ± 0.07 0.438 SPT-CLJ0254-5857 PLCK G277.8-51.7 PSZ2 G286.28-38.36 PSZ1 G286.27-38.39 03 59 10.20 72 04 46.10 5.94 ± 0.40 4.07 ± 0.02 0.307 PLCK G286.3-38.4 PSZ2 G271.18-30.95 PSZ1 G271.18-30.95 05 49 19.50 62 05 16.00 7.37 ± 0.32 18.95 ± 0.16 0.37 SPT-CLJ0549-6205 PLCK G271.2-31.0 PSZ2 G284.97-23.69 PLCKESZ G284.99-23.70 07 23 18.40 73 27 20.60 8.39 ± 0.34 16.91 ± 0.27 0.39 PLCK G285.0-23.7 PLCK G334.8-38.0⇤ – 20 52 16.80 61 12 29.40 – – 0.35
Notes. The names and alternative names of the clusters appear in Cols. 1 and 2. The values RA and DEC correspond to the coordinates for centring the ATCA observations (Cols. 3 and 4). The Planck mass, X-ray luminosity, and redshift (Cols. 5, 6, and 7, respectively) are taken fromPlanck Collaboration(2016).(⇤)See Sect.2for a deeper discussion on PLCK G334.8-38.0.
turbulence generated in the ICM by the mechanically powerful AGN or by gas sloshing in the cluster cool core (Mazzotta & Giacintucci 2008), although these explanations are still debated. Finally, radio haloes (RHs) are Mpc-scale, low-surface brightness radio sources observed to be centred in galaxy clus-ters with similar morphologies as the X-ray emission. Giant RH are the focus of this paper. In recent years, the knowledge of the origin of RHs has moved towards a general consensus. The generally accepted scenario for the mechanism responsible for this kind of diffuse emission is the re-acceleration of relativis-tic electrons by the large-scale turbulence generated in cluster mergers (see e.g.Brunetti et al. 2001;Petrosian 2001; Brunetti & Jones 2014). In agreement with this model, it is known that RHs tend to occur more frequently in massive galaxy clusters (seeCuciti et al. 2015, for a recent discussion), and most of these show evidence of being merging systems. Moreover, a series of scaling relations between the thermal and non-thermal properties of galaxy clusters have also been found; i.e. P1.4–Lx, P1.4–Mass,
P1.4–Y500, where P1.4and Y500are the radio power of haloes at
1.4 GHz and the cluster integrated Sunyaev-Zel’dovich (SZ) sig-nal within R5001 (see e.gBasu 2012;Cassano et al. 2013). The
connection between mergers and the presence of a RH depends on a complex combination of mechanisms and energy budgets. There are a few cases reported in the literature of the presence of RHs in cool-core clusters or of clusters being minor merg-ers (see e.g. Kale & Parekh 2016; Bonafede et al. 2014,2015; Sommer et al. 2017), and there is also evidence of merging clus-ters without detected RHs (Cassano et al. 2010; Russell et al. 2011).
Fundamental questions about the micro-physics of elec-tron acceleration and transport mechanisms still need to be answered to characterize the non-thermal physics of clusters. Statistical studies of RHs and their host systems can shed light on the mechanisms needed to complete the picture of the
1 R500is the radius at which the mean mass density is 500 times the
critical density at the cluster redshift.
physics of RHs and their connection with cluster mergers. Cur-rent knowledge of RHs is mostly based on high mass galaxy cluster samples. An important study on RH occurrence is the Giant Metrewave Radio Telescope (GMRT) Radio Halo Survey (GRHS;Venturi et al. 2007,2008) and the extended sample (E-GRHS; Kale et al. 2013,2015) with the aim of exploring the origin and occurrence of RHs and their connection with the dynamical state of the host systems. The authors picked galaxy clusters with a redshift range z = 0.2–0.4, X-ray luminosities Lx(0.1–2.4 keV) > 5 ⇥ 1044erg s 1and declinations > 31 to
ensure a good uv coverage with the GMRT. This sample is how-ever effectively limited to z < 0.33. Mass-based selections are motivated by the assumption that the selection of high X-ray luminosity merging systems have a greater chance of detecting diffuse radio sources. To start filling this observational gaps, pre-vious works investigated the presence of diffuse radio emission with an unbiased sample on X-ray morphology and in a wide range of masses (Shakouri et al. 2016).
Although a number RHs have been discovered at z > 0.3, a complete statistical sample is missing in this redshift regime (see Feretti et al. 2012). On the other hand, it is expected from mod-els (seeCassano et al. 2004,2006) that a larger number of RH occurrence may appear at z = 0.3–0.4. This is simply because most of the energy budget in the hierarchical growth of clus-ters is dissipated via massive mergers in this redshift range. In this paper, we present the results of a series of radio observa-tions of seven galaxy clusters in this redshift regime performed with the ATCA telescope, together with an X-ray analysis of the dynamical status of the target clusters.
This work is organized in the following way: Sect. 2 describes the criteria for the sample selection. In Sect. 3 we present the observations together with the data reduction and image reconstruction strategy. The analysis of the high reso-lution, tapered, and compact source subtracted radio images appears in Sect.4. In Sect.5we present the X-ray morphological analysis of the cluster sample. The results of the paper appear in Sect.6. Finally, the discussion and conclusions are presented in
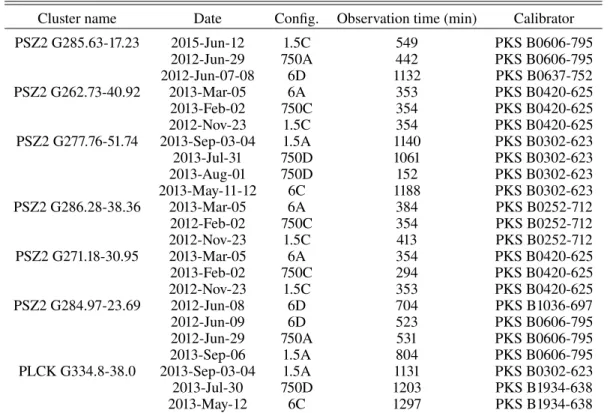
Table 2. Details of the observations towards the clusters selected for observations with ATCA.
Cluster name Date Config. Observation time (min) Calibrator
PSZ2 G285.63-17.23 2015-Jun-12 1.5C 549 PKS B0606-795 2012-Jun-29 750A 442 PKS B0606-795 2012-Jun-07-08 6D 1132 PKS B0637-752 PSZ2 G262.73-40.92 2013-Mar-05 6A 353 PKS B0420-625 2013-Feb-02 750C 354 PKS B0420-625 2012-Nov-23 1.5C 354 PKS B0420-625 PSZ2 G277.76-51.74 2013-Sep-03-04 1.5A 1140 PKS B0302-623 2013-Jul-31 750D 1061 PKS B0302-623 2013-Aug-01 750D 152 PKS B0302-623 2013-May-11-12 6C 1188 PKS B0302-623 PSZ2 G286.28-38.36 2013-Mar-05 6A 384 PKS B0252-712 2012-Feb-02 750C 354 PKS B0252-712 2012-Nov-23 1.5C 413 PKS B0252-712 PSZ2 G271.18-30.95 2013-Mar-05 6A 354 PKS B0420-625 2013-Feb-02 750C 294 PKS B0420-625 2012-Nov-23 1.5C 353 PKS B0420-625 PSZ2 G284.97-23.69 2012-Jun-08 6D 704 PKS B1036-697 2012-Jun-09 6D 523 PKS B0606-795 2012-Jun-29 750A 531 PKS B0606-795 2013-Sep-06 1.5A 804 PKS B0606-795 PLCK G334.8-38.0 2013-Sep-03-04 1.5A 1131 PKS B0302-623 2013-Jul-30 750D 1203 PKS B1934-638 2013-May-12 6C 1297 PKS B1934-638
Notes. Cluster name (Col. 1); dates of observations (Col. 2) with different array configurations (Col. 3); observation time (Col. 4); and phase calibrator (Col. 5). The central frequency is at 2.1 GHz and the total observed bandwidth is 2 GHz.
Sect. 7. Throughout this paper, we adopt the ⇤CDM cosmol-ogy with the values Ho = 70 km s 1 Mpc 1, ⌦M = 0.3, and
⌦⇤=0.7.
2. Sample selection
This paper presents the results of a subsample of the MACS-Planck Radio Halo Cluster Project (RHCP). The project was conceived as a continuation of the E-GRHS project (see Sect.1) by extending the statistics of RHs up to z = 0.45. The MACS-Planck RHCP consists of a total 48 galaxy clusters, all of which were taken from the MACS Brightest Cluster X-ray catalogue (Ebeling et al. 2010) and the list of newly discovered Planck SZ clusters confirmed with the XMM-Newton validation programme (available at the time of the proposal; see Planck Collabora-tion 2011b). For the project, all the clusters from both samples that are located in the range z = 0.3–0.45 were selected. In our sample we have a total of 33 MACS clusters and 15 Planck SZ clusters. The scope of this paper is to publish the analy-sis of the ATCA subsample. Information about the complete sample will appear in a forthcoming paper (Venturi et al., in prep.).
From the total number of selected clusters, 32 were lacking published radio information. The declination range of the sam-ple required observations to be carried out with two different telescopes, depending on the declination of the targets. Based on the visibility of the targets and the uv-coverage constraints to achieve the desired sensitivities to detect diffuse radio emission, a threshold of = 40 was defined. This threshold divided the total sample into two groups:
(a) Those lying in the range of > 40 (25 clusters in total) were observed with the GMRT at ⇠325 MHz, and the results of these observations will appear in a forthcoming paper (Venturi et al., in prep.).
(b) The remaining seven galaxy clusters ATCA observations are centred at 2.1 GHz with a bandwidth of 2000 MHz. Infor-mation about the clusters from the ATCA sample appears in Table1. It is worth mentioning that it was a matter of pure chance that all the clusters observed with the ATCA were Planck clusters.
It is important to mention that the measurements of redshift and mass for PLCK G334.8-38.0 are very challenging because they are a low-mass triple system. Having very poor X-ray statistics we cannot analyse the system by proceeding in the same way we have for the other clusters of the sample. However, the mass of the components, even taken all together (M ⇠ 3.4 ⇥ 1014 M ),
is significantly lower than the typical mass of known radio loud systems.
3. Radio observations and data reduction
Radio observations of the ATCA sample were carried out with three separate array configurations for each observed cluster (Table2) using the Compact Array Broadband Backend (CABB) correlator with a central frequency of 2.1 GHz and spanning 1.1–3.1 GHz (project ID C2679). Observations were carried out in continuum mode with the correlator set to produce 2000 ⇥ 1 MHz channels. Details of the observations can be found in Table2. The primary flux scale was set relative to the unresolved source PKS B1934-638 for which the detailed spec-tral behaviour is well understood. The amplitude gain variations were checked during the calibration of each observation for each sub-band image such that these variations were not higher than ⇠2%2.
Fig. 1.XMM-Newton smoothed images in the [0.3–2] keV band of the ATCA cluster sample overlaid with the 3 ⇥ (1, p2, 2) contours of the high resolution wide band radio maps (see Table3and Figs.A.1andA.2) in red and the same contour levels for the Block 3 low resolution compact source subtracted maps for the two clusters with diffuse radio emission (see Sect.6) in blue. The background of the X-ray images has been subtracted. The X-ray images are corrected from surface brightness dimming with redshift, divided by emissivity in the energy band, taking in account absorption from the Galaxy and the response of the instrument. Finally the images are scaled to a self-similar model. The colours are selected so that the images would look identical when scaled by their mass if they were at the same distance; this gives us a visual hint of the dynamical state of the clusters.
Radio frequency interference (RFI) and bad channels were excised manually from primary and secondary calibrators, as well as the target, using a combination of clipping algorithms and visual inspection via the MIRIAD task PGFLAG (Sault et al. 1995). It was necessary to perform calibration on nar-rower frequency intervals owing to the nature of CABB data. After a number of trials, we determined that four sub-bands of ⇠500 MHz produce the optimal results for these data. Thus, the target, primary, and secondary calibrator data sets were divided into the required sub-bands coined Block 1 (from 2.631 GHz to 3.100 GHz), Block 2 (from 2.131 GHz to 2.630 GHz), Block 3 (from 1.631 GHz to 2.130 GHz), and Block 4 (from 1.130 GHz to 1.630 GHz). Each sub-band was then self-calibrated in MIRIAD via the task SELFCAL. Finally, the self-calibration solutions were saved with the task UVAVER.
4. Radio analysis
4.1. High resolution images
Four images were created, one for each of the four sub-bands, out to the primary beam via the task INVERT, and a Steer CLEAN
(Steer et al. 1984) was applied to all sources within the primary beam. The sub-band images were then convolved to a common size by applying a Gaussian corresponding to the lowest res-olution image and were then added together to create a final wide-band image (see Table3). The noise levels in the sub-band images were very similar for the three highest bands and only differed slightly in the lowest frequency band; it was not nec-essary to weight the images relative to the sensitivities in the mosaicking process.
The radio contours of the central Mpc diameter area from our high resolution images are overlaid on the XMM-Newton X-ray images in Fig.1(yellow contours). In Figs.A.1andA.2 we show the high resolution ATCA radio maps for the wide field and zoomed cluster regions3. The final deep ATCA images root mean squared (rms) noise is measured with AIPS TVSTAT at the field centre in regions inside the primary beam without any trace of point sources or diffuse emission. The information of the images (rms noises and resolutions) is shown in Table3. A visual inspection of the seven high resolution images does not
3 The high resolution images from PSZ2 G284.97-23.69 have been
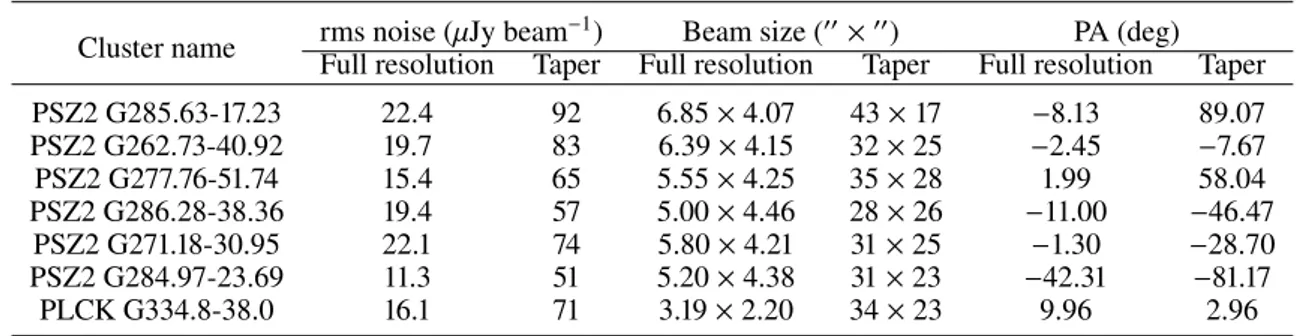
Table 3. Properties of the full resolution and Block 3 compact source subtracted tapered 2000 MHz band-width radio maps centred at 2.1 GHz.
Cluster name rms noise (µJy beamFull resolution Taper1) Full resolutionBeam size (00⇥Taper00) Full resolutionPA (deg) Taper
PSZ2 G285.63-17.23 22.4 92 6.85 ⇥ 4.07 43 ⇥ 17 8.13 89.07 PSZ2 G262.73-40.92 19.7 83 6.39 ⇥ 4.15 32 ⇥ 25 2.45 7.67 PSZ2 G277.76-51.74 15.4 65 5.55 ⇥ 4.25 35 ⇥ 28 1.99 58.04 PSZ2 G286.28-38.36 19.4 57 5.00 ⇥ 4.46 28 ⇥ 26 11.00 46.47 PSZ2 G271.18-30.95 22.1 74 5.80 ⇥ 4.21 31 ⇥ 25 1.30 28.70 PSZ2 G284.97-23.69 11.3 51 5.20 ⇥ 4.38 31 ⇥ 23 42.31 81.17 PLCK G334.8-38.0 16.1 71 3.19 ⇥ 2.20 34 ⇥ 23 9.96 2.96
Notes. The rms noise of the images appears in Col. 2, while the resolutions and position angles are shown in Cols. 3 and 4, respectively.
reveal obvious presence of diffuse radio emission in the central area in which the clusters of the sample lie.
4.2. Tapering and diffuse source search
We proceeded to subtract the compact radio sources from the uv data. Using the self-calibrated data, we imaged the visibilities for the longest baselines (uv range from 3.6 to 40 k , which trans-lates to angular scales from ⇠5 to ⇠57 arcsec) and subtracted the corresponding clean components from the self-calibrated uv data via the MIRAD task UVMODEL. This creates a new, re-imaged, uv data set. Again, none of the seven clusters showed the obvious presence of diffuse emission in the central area in the compact source subtracted high resolution images.
In order to investigate the possible presence of low-surface brightness radio emission in the clusters, the point source sub-tracted visibilities were re-imaged with a robust = 0.5 weighting and by applying a ⇠9 k Gaussian taper. Traditionally, mea-surements of flux densities of RHs are reported at the central frequency of 1.4 GHz. It is worth mentioning that from the typi-cal spectral behaviour of radio haloes (↵ & 1 synchrotron spectral index4), lower luminosities are expected for higher frequencies. Because of its lower central frequency, the Block 4 sub-band would be ideal to do flux density measurements, but it is also strongly affected by RFI (50–60% of the data was flagged). In our images we have comparable rms sensitivities for the fre-quency range running from Block 3 to Block 1. This set of conditions makes Block 3 centred at ⇠1.9 GHz the most suitable sub-band in which to carry out the flux density measurements. In Table3we report the main features for the set of the source subtracted Block 3 tapered images.
In search of residual diffuse emission in the cluster areas we set the classical 3 contours in the compact source subtracted Block 3 tapered images. In some cases, we found contours that correspond to positions of point sources visible in the high res-olution maps due to an imperfect point source subtraction or to the presence of some extended emission candidates (see Sect.6). Radio images that showed no evidence of the presence of dif-fuse sources were used to set detection limits for possible difdif-fuse radio emission, as described below.
4.3. Upper limit determination
To set the detection upper limits for possible diffuse radio emis-sion in our ATCA observations, we took a similar approach to
4 In this paper we use the convention S (⌫) / ⌫ ↵, where S (⌫) is the
radio flux density.
that used in, for example,Venturi et al.(2008). Specifically, our procedure consists of the following steps:
(1) We simulated a diffuse source with the MIRIAD task IMGEN. The model consist of five low surface brightness concentric disks, of which the biggest has a diameter of 1 Mpc in the corresponding redshift of the respective galaxy cluster image. To reproduce the typical profile of a RH, these disks area percentages are from largest to smallest:100%, 60%, 33%, 25%, and 12%. These disks contribute, respec-tively, the following percentage of the total flux of the simulated source: 72%, 20%, 5%, 2%, and 1%.
(2) The simulated source was added into the compact source subtracted uv data of the corresponding observation on the sub-set coined Block 3 (⇠500 MHz wide, see Sect.3) for each galaxy cluster. This step was performed with the MIRIAD task UVMODEL, which generates a new uv data set of the real data plus the simulated source. To perform the injection of the spheric models we picked the 1 Mpc diam-eter circle centred on the cluster coordinates and five 1 Mpc areas inside the primary beam, without any trace of point sources and where there is no appearance of 3 contours due to artefacts on the original image plane.
(3) The model injected uv data were imaged at low resolu-tion applying a taper with the following parameters on the MIRIAD task invert: FWHM = 20, robust = 0.5, and cell = 4; this allowed us to achieve more sensitivity to the kind of emission of the simulated haloes, as in Sect.4.2.
(4) The injected fluxes of the different modelled disks were increased until we noticed that 3 contours appeared uni-formly on the injection areas with a size large enough (⇠500 kpc diameter) to allow us to recognize it as a candidate RH.
We were able to recover from ⇠50% to ⇠70% of the original injected flux by measuring the total flux density in the areas of the image plane where the injections were carried out. In the range of rms noises and resolutions of our images (see Table3), we determined that RH models with a total flux density of 3–5 mJy are the lowest values that can be injected in our images to be considered as upper limits of detection. The radio powers for the detection limits calculated at 1.4 GHz with whole injected flux densities, assuming a spectral index of 1.3, are shown in Table4.
5. X-ray dynamical state of the ATCA clusters
All the clusters of the ATCA sample benefit from X-ray obser-vations from the XMM-Newton space telescope as part of the
validation programme of Planck cluster candidates. The X-ray data processing is detailed inPlanck Collaboration(2011b). The cluster mass, M500, and corresponding R500 are derived
itera-tively using the low scatter M500–YXscaling relation fromPlanck
Collaboration(2011b), where YXis the product of the gas mass
within R500 and the X-ray temperature in the [0.15–0.75] R500
aperture. The density profiles were derived from the surface brightness profile centred on the X-ray emission peak, using the PSF-deconvolution and deprojection method of Croston et al. (2008). From this analysis, we compute two morphological parameters:
(a) The surface brightness concentration parameter C, C = SX(< Rin)
SX(< Rout), (1)
the ratio of the surface brightnesses SXwithin an inner
aper-ture Rin and a global aperture Rout. The value SX is the
PSF-corrected surface brightness, which is derived from the emission measure profile. Introduced inSantos et al.(2008) using Rin = 40 kpc and Rout =400 kpc, this parameter has
been widely used to probe the core properties of clusters up to high redshift (e.g.Santos et al. 2010;Hudson et al. 2010; Pascut & Ponman 2015). Here we choose to use scaled aper-tures since the clusters of our sample cover a wide redshift range, with Rin = 0.1 ⇥ R500, corresponding to the typical
size of the cool core, and Rout = 0.5 ⇥ R500, which is a
characteristic size for the total flux.
(b) The X-ray centroid-shift w, as defined in, for example, Böhringer et al.(2010) within 10 circular apertures from 0.1 to 1 R500excising the first central aperture,
w =" 1 N + 1 X ( i h i)2 #1/2 ⇥R1 500, (2)
where iis the distance between the emission weighted
cen-troid within the ith aperture and the X-ray peak and N is the number of apertures.
The centroid shift is computed on the background-subtracted, exposure-corrected co-added X-ray count images in the 0.3–2 keV energy band after removal and refilling of the point sources as inBöhringer et al.(2010).
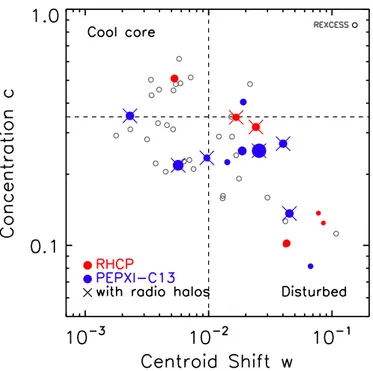
The results are shown in Fig. 2, where we overplot for comparison the positions of objects from the REXCESS (open grey circles; see Böhringer et al. 2010, for the centroid-shift values). Figure2also includes the systems in common between the samples ofCassano et al. (2013) andPlanck Collaboration (2011a) (blue points), for which we computed the concentration parameter and the centroid-shift values as described above for the ATCA sample.
The horizontal and vertical dashed lines of Fig. 2 indi-cate characteristic threshold values of each parameter that are typically used to separate out cool-core and morphologically dis-turbed systems, respectively. Following Pratt et al.(2009), we use a value of w > 0.01 as indicative of a morphologically dis-turbed system. Similarly, we define targets with C > 0.35, which is equivalent to the central density criterion used byPratt et al. (2009), as centrally peaked and thus cool-core systems.
We stress here that the limits indicated with dashed lines in Fig. 2 were obtained for the local REXCESS sample. Also the sample analysed by (Cassano et al. 2013) is mostly com-prised of lower redshift clusters compared to our targets. In addition, instead of using scaled apertures,Cassano et al.(2013) adopted fixed physical sizes for computing the two parameters
Fig. 2.Concentration parameter C vs. centroid shift w for the galaxy clusters of the RHCP sample analysed in this paper (red filled cir-cles). For comparison, we also show the clusters in the sample of
Cassano et al.(2013) that appear in the sub-sample of Planck clusters studied byPlanck Collaboration (2011a) (PEPXI-C13, blue filled cir-cles) for which we applied our algorithm to compute the w values within R500. The size of the circles is proportional to the log(M500), in the range
[14.67–15.3], and clusters with detected radio haloes are indicated with a cross. The characteristic thresholds indicating cool cores and mor-phologically disturbed systems (dashed lines) are from theREXCESS
study (Böhringer et al. 2007). TheREXCESSclusters are shown as open circles.
w (500 kpc) and C (Sx(<100 kpc)/Sx(500 kpc)). Their choice
was based on the theoretical consideration that, for a typical ⇠1 Mpc-size RH, 500 kpc is expected to delimitate the region in which the energy of the merger is dissipated in particle accelera-tion. These factors are however not expected to make our analysis significantly different from the approach ofCassano et al.(2013), since recent works have proven that the adopted morphological parameters neither depend significantly on the size of the central region selected to estimate them (e.g. good agreement between w measured within R500and 0.5 R500) nor are limited by resolution
issues up to z ⇠ 1 clusters (e.g.Bartalucci et al. 2017, Lovisari et al., priv. comm.). Our new estimates of the C and w parameters, however, indicate that one of the radio-loud clusters inCassano et al.(2013) falls in the relaxed part of the plot.
6. Results
6.1. Giant radio halo in PSZ2 G284.97-23.69
InMartinez Aviles et al.(2016) we reported the discovery of a giant radio halo in PSZ2 G284.97-23.69 (named in our previous publication PLCK G285.0-23.7). Because PSZ2 G284.97-23.69 is the only confirmed giant RH discovered in this set of observations, it is important to discuss it in the complete context of the whole ATCA sample. PSZ2 G284.97-23.69 is the second most luminous and massive cluster in the sample (see Table1). Based on its disturbed morphology (w = 0.028 ± 0.001) and concentration parameter (C = 0.317 ± 0.005) it falls in a quadrant of dynamically disturbed systems, albeit
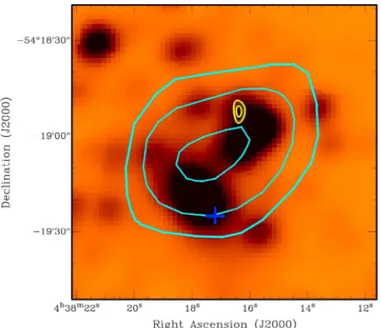
Fig. 3.WISE 4.6 microns image of the central area of PSZ2 G262.73-40.92. The centre of the X-ray emission is indicated as a blue cross. Contours of the compact source, 3 ⇥ (1, p2, 2), subtracted tapered radio image appear in cyan, while yellow contours are the same contour levels from the high resolution Block 3 radio map.
with a relatively high C parameter. The size and orientation of the 3 contours on the Block 3 tapered radio map have a remarkable coincidence with the X-ray morphology (see Fig. 4 inMartinez Aviles et al. 2016). The detected RH seems to be slightly under-luminous compared to objects hosted by clusters in a similar mass range, as shown in the P1.4 GHzvs. M500 plot
(purple star in Fig.4); although it is not a clear outlier like the RH discovered byBonafede et al.(2015). It is, however, one of the lowest luminosity radio haloes detected at z > 0.35.
6.2. Diffuse radio source in the cluster PSZ2 G262.73-40.92 According to the X-ray morphological analysis, PSZ2 G262.73-40.92 is a merging, but probably moderately disturbed cluster, lying close to our cut line of cool-core clusters, with a con-centration parameter C = 0.348 ± 0.005 and a centroid shift w = 0.016 ± 0.001 (see Fig. 2). The tapered compact source subtracted image in the field of the cluster PSZ2 G262.73-40.92 shows the presence of a candidate diffuse source close to the cluster central position. The high resolution image reveals the presence of a very faint point source in the region of the diffuse emission, with a possible counterpart on the IR map (Fig.3), for which we measured a flux density of 0.33 ± 0.04 mJy. We mea-sured the total flux density inside the 3 contours (shown in cyan colour in Fig.3) of the diffuse emission in the compact source subtracted tapered image in Block 3, which is characterized by a rms noise of 83 µJy beam 1 (see Table3). We obtained a flux
density of 1.18 ± 0.12 mJy inside the 3 contours. The region shows an elliptical shape, with a major axis of 63 arcsec and a minor axis of 50 arcsec, which for our cosmology corresponds to a physical size of 349 kpc ⇥ 277 kpc at the cluster redshift. The diffuse source present in the residual map follows the emis-sion from the galaxies in the WISE images (Fig.3), and is offset from the cluster X-ray emission (Fig. 1, top left panel), which makes the confirmation and possible classification of the source challenging with our data.
6.3. Clusters without diffuse radio emission 6.3.1. Cool-core cluster PSZ2 G271.18-30.95
PSZ2 G271.18-30.95 has the highest X-ray luminosity of the ATCA sample, although it is not the most massive (see Table1). Within the sample this cluster has also the highest concentra-tion parameter (C = 0.509 ± 0.004) and the lowest centroid shift (w = 0.005 ± 0.001). This positions PSZ2 G271.18-30.95 as a clear cool-core non-disturbed cluster. Unsurprisingly, as in ⇠70% of cool-core clusters (Gitti et al. 2015) our high resolution radio map shows the presence of a strong radio source coincident with the cluster centre (see Fig.1top middle panel and Fig.A.2 bottom panels) with a flux density of ⇠10 mJy at ⇠1.9 GHz. From the Hubble Space Telescope optical image there is an evident connection between the radio source and the BCG. Moreover, by measuring the flux densities of the central source in various sub-bands (Blocks 1 to 4, see Sect.3) we estimate a spectral index for the central compact source of ↵ ⇡ 0.6.
It is known that radio mini-haloes are usually located in the centre of cool-core clusters, surrounding the central active radio galaxy and extending to the radius of the cluster cooling region (see e.g.Giacintucci et al. 2017, and references therein). To fur-ther investigate the possible presence of a radio mini-halo, we did several tests by imaging at ⇠10 arcsec resolution without com-pact source subtraction and using different values for the taper. None of our maps show evidence of extended diffuse emission at the typical mini-halo scales. We point out, however, that the presence of the compact source at the cluster centre and the pres-ence of a strong source close to the cluster made the imaging and compact source subtraction problematic in this particular case. 6.3.2. Highly disturbed clusters without radio emission Three of the seven galaxy clusters of the ATCA sample show evi-dence that they are both highly disturbed (see Fig.1lower panels and the three red circles in the bottom right of Fig.2) and have low concentration parameters. PSZ2 G277.76-51.74, the most massive cluster of the sample, also has the lowest concentration parameter (C = 0.102 ± 0.002) and shows a centroid shift w = 0.042 ± 0.001. On the other hand, PSZ2 G285.63-17.23 has the highest centroid shift (w = 0.081 ± 0.003, C = 0.124 ± 0.006). Finally PSZ2 G286.28-38.36 also shows signs of being highly disturbed (w = 0.078 ± 0.005, C = 0.137 ± 0.008). None of these clusters show hints of diffuse radio emission on our maps. 6.3.3. Detection limits
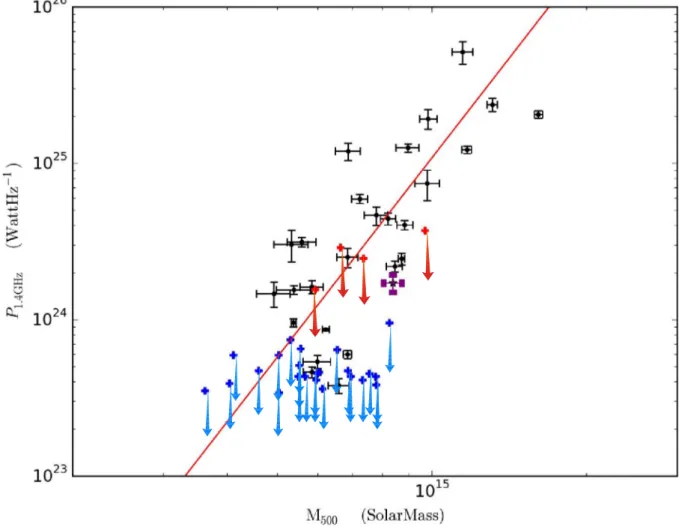
In Fig. 4 we show the upper limits for the non-detections in the ATCA sample as red arrows on the P1.4 GHz vs. M500
plot. We compare our calculated values with those obtained by Venturi et al.(2008) andKale et al.(2013) (blue arrows in Fig.4), measured using GMRT images, with the modelled halo injections performed at 610 MHz. Our calculated ATCA upper limits appear higher in the plot as a consequence of the com-bination of two effects. The first is that the redshift range of our sample is higher than previous studies (effectively limited to z < 0.3, see Sect.1). In our calculation of the radio power, we have the luminosity distance factor that scales as DLum(z)2.
The second and most important effect is the frequencies of the ATCA observations. Our upper limit injections were performed at ⇠1.9 GHz, and assuming a typical spectral behaviour of RHs (with spectral index ↵ = 1.3), we obtained higher values of the radio power when we rescale to 1.4 GHz. The values of our cal-culated upper limits appear in Table4. It is worth mentioning that
Fig. 4.Synchrotron power of RHs at 1.4 GHz (P1.4 GHz) vs. cluster mass M500(fromPlanck Collaboration 2016). Detected radio haloes reported in
the literature measured at 1.4 GHz (seeMartinez Aviles et al. 2016) are shown in black dots. The red line is the best fit for the black dots. The purple star corresponds to the radio halo on PSZ2 G284.97-23.69. The blue arrows correspond to detection limits appearing inCassano et al.(2013) and references therein. The red arrows are the upper limits for the non-detections presented in this paper (see Table4).
Table 4. Upper limits obtained for the ATCA cluster images without traces of diffuse radio emission.
Cluster name Log P1.4 GHz(WHz 1)
PSZ2 G285.63-17.23 24.46
PSZ2 G277.76-51.74 24.57
PSZ2 G286.28-38.36 24.19
PSZ2 G271.18-30.95 24.39
Notes. The calculated logarithm of the radio power at 1.4 GHz, by assuming a spectral index of 1.3, for the total flux density of the injected fake radio halo model in the Block 3 sub-band (1.9 GHz) appears in Col. 2.
the power of the giant RH discovered in PSZ2 G284.97-23.69 and some other RHs reported in the literature lie close to (or even below) the radio power regime of the upper limits obtained for our ATCA observations. This could imply that the measured flux density of our detected sources could be underestimated.
7. Discussion and conclusions
A full analysis in search of diffuse radio emission on the ATCA sub-sample of the MACS-Planck RHCP is presented in this paper.
Among the seven targets, only two clusters show a confirmed or tentative diffuse radio emission. We reported the presence of a giant radio halo in PSZ2 G284.97-23.69 and found a new candidate diffuse source in PSZ2 G262.73-40.92. The X-ray morphological analysis based on XMM-Newton observations indicates that those objects are most likely disturbed systems, based in particular on the centroid shift indicator (w), with a con-centration parameter (C) not far from the threshold adopted to separate merging and relaxed clusters.
This is not totally unexpected. Our choice for the limits for cool-core/non cool-core and relaxed/disturbed systems is based on the limits for C and w, which were adopted and obtained empirically from the local (z = 0.055–0.183) REXCESS cluster sample (Böhringer et al. 2007), in which two disturbed cool-core clusters are detected (Pratt et al. 2009;Böhringer et al. 2010). Furthermore, the results ofMcDonald et al.(2017) on the SPT sample suggest that the evolution of the core and outer regions are decoupled, which would indicate that there is no reason why a cluster cannot be a cool core and disturbed as well.
Those clusters of our sample that have clear X-ray morpho-logical indicators that they are highly disturbed do not present any bright diffuse emission. Currently, these clusters (upper limits) are still consistent with being on the P1.4 M500
correla-tion. Future deeper observations will have to determine if these haloes could be under-luminous and fall below the correlation.
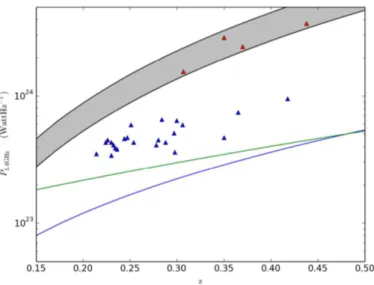
Fig. 5. Upper limit radio powers rescaled at 1.4 GHz vs. redshift for our ATCA observations (red triangles) and GMRT observationsVenturi et al.(2008) andKale et al.(2013) (blue triangles). The lower (upper) border of the grey band corresponds to the lowest (highest) detection limit of injected fluxes, i.e. 3 mJy (5 mJy) for our ATCA images. The green and blue lines show the minimum power at 1.4 GHz of detectable radio haloes in the EMU survey as derived inCassano et al.
(2012).
Hypothetical RH could be either “classical” haloes, i.e. almost consistent with the correlation, or under-luminous RHs with ultra-steep radio spectra, detectable with low frequency radio observations (these are particularly expected in high-z clusters; seeCassano et al. 2006). The challenging hypothesis to be tested would be if those clusters are radio quiet. There are actually cases of disturbed clusters lacking radio haloes. Russell et al.(2011) have shown that the galaxy cluster A2146 possesses no diffuse emission even though it is clearly a merging cluster (see also White et al. 2015, for a detailed study of the dynamical status of the cluster). However, in this particular case the mass of the cluster is very low (4.3 ⇥ 1014M ), which could be the reason
for the lack of a detectable radio halo.
Indeed, upper limits indicated in Fig. 4 are significantly higher compared to other works (Cassano et al. 2013), even if the rms sensitivities reached in all these analyses are compara-ble. This is explained by the fact that previously published upper limits are based either on lower frequency (mostly 610 MHz) observations (Venturi et al. 2008;Kale et al. 2013) or on lower redshift ATCA cluster samples (Shakouri et al. 2016). In the first case (and keeping in mind that we convert radio powers to the reference frequency of 1.4 GHz), the same rms sensitivity at 1.9 GHz and 610 MHz translates to a higher 1.4 GHz radio halo luminosity upper limit for the 1.9 GHz case because of the spec-tral steepness of radio haloes (we rescaled by assuming a specspec-tral index ↵ = 1.3 to be consistent withCassano et al. 2013). In the second case, the clusters are observed at the same frequency, but located at z ⇠ 0.15, which, owing to the DLum(z)2factor,
trans-lates into ⇠10 higher upper limits in radio power compared to lower redshift ATCA observations.
To be able to distinguish between radio-quiet or under-luminous diffuse emission in the three disturbed galaxy clusters in our sample, it is clear that more sensitive and lower fre-quency radio observations are needed. Instruments such as the JVLA, the upgraded GMRT, or the LOFAR Two-metre Sky Sur-vey (see e.g. Shimwell et al. 2017) are already improving the observational capabilities needed for such studies by reaching
better sensitivities. As an example of the expected power of future instruments, in Fig. 5 we compare the detection upper limits obtained for our ATCA observations (red triangles) with previous upper limits taken with the GMRT at 610 MHz (blue tri-angles) as a function of redshift. The green and blue lines show the minimum power at 1.4 GHz of detectable radio haloes in the Evolutionary Map of the Universe (EMU) survey for differ-ent signal-to-noise levels as derived inCassano et al.(2012) (see Sect. 5 and Eqs. (9) and (10) in their paper). The EMU survey will produce a deep radio continuum survey of the southern sky with rms noises of ⇠10 µJy beam 1; these levels are comparable
to our best rms noise of ⇠11µJy beam 1, but have lower
resolu-tion (⇠10 arcsec;Norris et al. 2011), thereby resulting in a better sensitivity at lower frequencies (1.3 GHz). From Fig.5we note that EMU will have the sensitivity to discover possible haloes in clusters that presently are undetected in both GMRT and ATCA samples.
Acknowledgements. The authors would like to warmly thank Roberto Ricci for useful discussions during the preparation of this paper. GMA is supported by the Erasmus Mundus Joint Doctorate Program by Grants Number 2013-1471 from the agency EACEA of the European Commission. GMA, CF, and MJ-H acknowledge financial support from Programme National Cosmologie et Galax-ies (PNCG) and Université de Nice-Sophia Antipolis – Programme Professeurs Invités 2015. MJ-H acknowledges the Marsden Fund administered by the Royal Society of New Zealand on behalf of the Ministry of Business, Innovation, and Employment. TV, RC, and GB acknowledge partial support from PRIN-INAF 2014 grant. The research leading to these results has received funding from the European Research Council under the European Union?(tm)s Sev-enth Framework Programme (FP7/2007-2013)/ERC grant agreement no. 340519. Basic research in radio astronomy at the Naval Research Laboratory is supported by 6.1 Base funding. The Australia Telescope Compact Array is part of the Australia Telescope National Facility, which is funded by the Australian Gov-ernment for operation as a National Facility managed by CSIRO. The results of these papers are partially based on data retrieved from the ESA Planck Legacy Archive, NASA SkyView, and the Hubble Legacy Archive, which is a collabora-tion between the Space Telescope Science Institute (STScI/NASA), the Space Telescope European Coordinating Facility (ST-ECF/ESA), and the Canadian Astronomy Data Centre (CADC/NRC/CSA).
References
Bartalucci, I., Arnaud, M., Pratt, G. W., et al. 2017,A&A, 598, A61
Basu, K. 2012,MNRAS, 421, L112
Böhringer, H., Schuecker, P., Pratt, G. W., et al. 2007,A&A, 469, 363
Böhringer, H., Pratt, G. W., Arnaud, M., et al. 2010,A&A, 514, A32
Bonafede, A., Intema, H. T., Brüggen, M., et al. 2014,MNRAS, 444, L44
Bonafede, A., Intema, H., Brüggen, M., et al. 2015,MNRAS, 454, 3391
Brunetti, G., & Jones, T. W. 2014,Int. J Mod. Phys. D, 23, 30007
Brunetti, G., Setti, G., Feretti, L., & Giovannini, G. 2001,MNRAS, 320, 365
Cassano, R., Brunetti, G., & Setti, G. 2004,J. Kor. Astron. Soc., 37, 589
Cassano, R., Brunetti, G., & Setti, G. 2006,MNRAS, 369, 1577
Cassano, R., Ettori, S., Giacintucci, S., et al. 2010,ApJ, 721, L82
Cassano, R., Brunetti, G., Norris, R. P., et al. 2012,A&A, 548, A100
Cassano, R., Ettori, S., Brunetti, G., et al. 2013,ApJ, 777, 141
Croston, J. H., Pratt, G. W., Böhringer, H., et al. 2008,A&A, 487, 431
Cuciti, V., Cassano, R., Brunetti, G., et al. 2015,A&A, 580, A97
Ebeling, H., Edge, A. C., Mantz, A., et al. 2010,MNRAS, 407, 83
Feretti, L., Giovannini, G., Govoni, F., & Murgia, M. 2012,A&A Rev., 20, 54
Giacintucci, S., Markevitch, M., Cassano, R., et al. 2017,ApJ, 841, 71
Gitti, M., Tozzi, P., Brunetti, G., et al. 2015,Advancing Astrophysics with the Square Kilometre Array (AASKA14), 76
Govoni, F., Murgia, M., Markevitch, M., et al. 2009,A&A, 499, 371
Hudson, D. S., Mittal, R., Reiprich, T. H., et al. 2010,A&A, 513, A37
Kale, R. & Parekh, V. 2016,MNRAS, 459, 2940
Kale, R., Venturi, T., Giacintucci, S., et al. 2013,A&A, 557, A99
Kale, R., Venturi, T., Giacintucci, S., et al. 2015,A&A, 579, A92
Martinez Aviles, G., Ferrari, C., Johnston-Hollitt, M., et al. 2016,A&A, 595, A116
Mazzotta, P., & Giacintucci, S. 2008,ApJ, 675, L9
Norris, R. P., Hopkins, A. M., Afonso, J., et al. 2011,PASA, 28, 215
Pascut, A., & Ponman, T. J. 2015,MNRAS, 447, 3723
Petrosian, V. 2001,ApJ, 557, 560
Planck Collaboration, Ade, P. A. R., Aghanim, N., et al. 2011a,A&A, 536, A11
Planck Collaboration, Aghanim, N., Arnaud, M., et al. 2011b, A&A, 536, A9
Planck Collaboration, Ade, P. A. R., Aghanim, N., et al. 2016,A&A, 594, A27
Pratt, G. W., Croston, J. H., Arnaud, M., & Böhringer, H. 2009,A&A, 498, 361
Russell, H. R., van Weeren, R. J., Edge, A. C., et al. 2011,MNRAS, 417, L1
Santos, J. S., Rosati, P., Tozzi, P., et al. 2008,A&A, 483, 35
Santos, J. S., Tozzi, P., Rosati, P., & Böhringer, H. 2010,A&A, 521, A64
Sault, R. J., Teuben, P. J., & Wright, M. C. H. 1995, in Astronomical Data Anal-ysis Software and Systems IV, eds. R. A. Shaw, H. E. Payne, & J. J. E. Hayes,
ASP Conf. Ser., 77, 433
Shakouri, S., Johnston-Hollitt, M., & Pratt, G. W. 2016,MNRAS, 459, 2525
Shimwell, T. W., Röttgering, H. J. A., Best, P. N., et al. 2017,A&A, 598, A104
Sommer, M. W., Basu, K., Intema, H., et al. 2017,MNRAS, 466, 996
Steer, D. G., Dewdney, P. E., & Ito, M. R. 1984,A&A, 137, 159
van Weeren, R. J., Andrade-Santos, F., Dawson, W. A., et al. 2017,Nat. Astron., 1, 0005
Venturi, T., Giacintucci, S., Brunetti, G., et al. 2007,A&A, 463, 937
Venturi, T., Giacintucci, S., Dallacasa, D., et al. 2008,A&A, 484, 327
Appendix A: High resolution radio images of ATCA sample
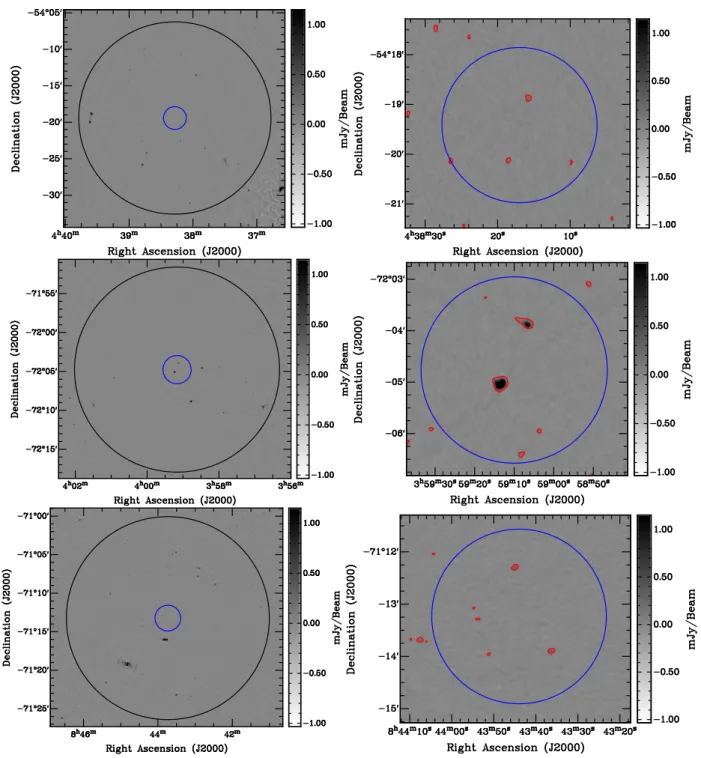
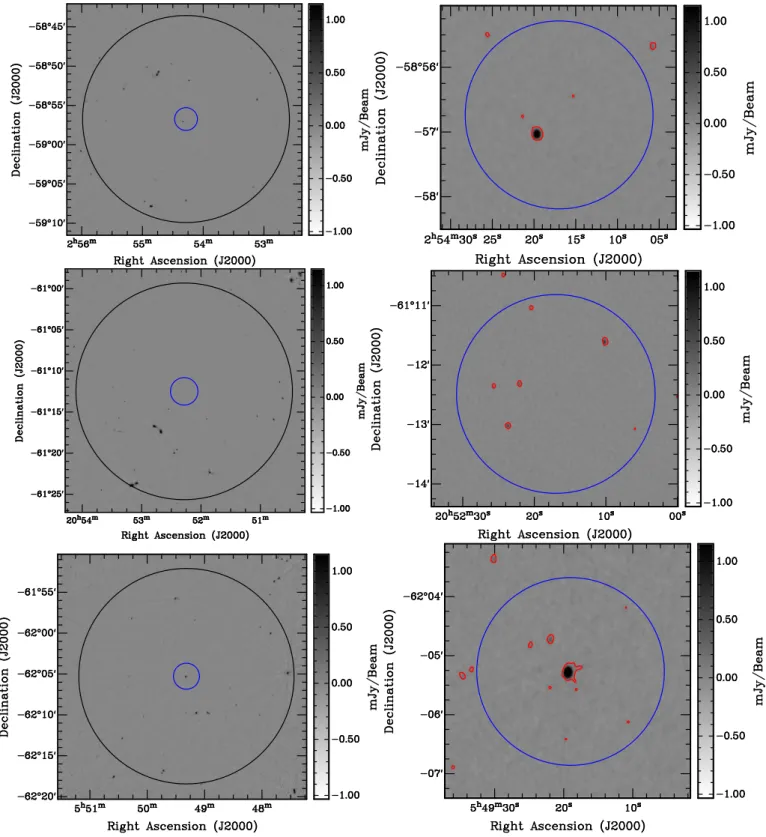
Fig. A.1.Final full-resolution, wide-band ATCA images of the cluster sample. Left panels: full field image centred on cluster coordinates. The outer circle denotes the boundary of the primary beam with a radius of ⇠0.22 . The central 1 Mpc-diameter region is indicated by the inner, blue smaller circle. Right panels: zoom into the central area with 3 contours of the corresponding map overlaid in red. Top: PSZ2 G262.73-40.92; middle: PSZ2 G286.28-38.36; bottom: PSZ2 G285.63-17.23.
![Fig. 1. XMM-Newton smoothed images in the [0.3–2] keV band of the ATCA cluster sample overlaid with the 3 ⇥ (1, p](https://thumb-eu.123doks.com/thumbv2/123dokorg/8109214.125163/5.892.55.834.125.658/fig-newton-smoothed-images-atca-cluster-sample-overlaid.webp)