Regional heat flows of resting and exercising men
immersed in cool water
GUIDO FERRETTI, ARSENIO VEICSTEINAS, AND DONALD W. RENNIE
Department of Physiology, Centre Mgdical Universitaire, Geneva 1211, Switzerland; Institute of Physiology, Department of Biomedical Sciences, University of Brescia, Brescia 25124, Italy; and Department of Physiology, State University of New York, Buffalo, New York 14214
FERRETTI, GUIDO, ARSENIO VEICSTEINAS, AND DONALD W.
RENNIE. Regional heat flows of resting and exercising men
immersed in cool water. J. Appl. Physiol. 64(3): 1239-1248, 1988.-Trunk (&), limb (ML), and whole-body (HDIR = & +
& + &rehead ) skin-to-water heat flows were measured by heat
flow transducers on nine men immersed head out in water at critical temperature (T,, = 30 t 2OC) and below [overall water temperature (T,) range = 22-32”C] after up to 3 h at rest and exercise. Body heat flow was also determined indirectly (&) from metabolic rate corrected for changes in heat stores. At rest at T,, [02 uptake (vo2) = 0.33 t 0.07 l/min, n = 71, HT = 52.3 t 14.2 (SD) W, HL = 56.4 t 14.6W, H,,IR = 120 t 27 W, and HM = 111 & 29 W (significantly different from H&J. T, markedly affected HDrR but only slightly affected HM (n = 22 experiments at T, different from T,, plus 7 experiments at T,,). During light exercise (3 MET) at T,, (VO, = 1.06 t 0.26 l/min, n = 9), HT = 122 t 43 W, HL = 130 t 27 W, HDrR = 285 t 69 W, and HM =
MET) at T,, (VO,
260 t 60 W. During severe exercise (7 = 2.27 t 0.50 l/min, n = 4), HT = 226 rt 100 W, HL = 262 t 61 W, HDIR = 517 t 148 W, and HM = 496 * - 98 W. Lowering T, at 7-MET exercise (n = 9, plus 4 at T,,) had no effect on H DIR and HM. In conclusion, resting HL and HT are equal. At T, < T,, at rest, HDIR > HM, showing that unexpectedly the shell was still cooling. During exercise, HL increases more than HT but less than expected from the heat production of the working limbs. Therefore some heat produced by the limbs is probably transported by blood to the trunk. During heavy exercise, H DIR is constant at all considered T,; apparently it is regulated by some thermally dependent mech- anism, such as a progressive cutaneous vasodilation occurring as T, increases.
trunk heat flow; limb heat flow; core and shell heat stores; critical water temperature; temperature regulation
IN SEVERAL STUDIES the distribution of body heat flow
from skin to environment has been analyzed (11, 16, 23,
32). However, there is disagreement about the fractional loss of heat from the trunk vs. the limbs. Hayward and Keatinge (16) stated that most of the body heat loss in cold water takes place through the skin of the trunk. Similar conclusions were drawn by Wade et al. (32), who emphasized the role of countercurrent heat exchange in the limbs as a major factor limiting the heat flow from the extremities. Rennie (23), however, observed that the limbs contribute to -45% of the total heat flow at the end of a 3-h resting immersion at critical water temper- ature (T,,, the lowest water temperature a subject can
tolerate at rest for 3 h without shivering). Similarly, Wade et al. (32), although in apparent contradiction with their own conclusions, reported values of steady-state heat flow in limb corresponding to -41% of the total.
Part of the disagreement may depend on the very long time required to reach a thermal steady state, even in limbs (19). The wide variability in changes of body heat stores among individuals, as well as the source of the net heat loss in prolonged slow cooling, continues to be a puzzle. If skin heat flow is more or less evenly distributed between limbs and the trunk in cool water (11, 16, 23, 32), how can this be reconciled with the dramatic de- crease in limb blood flow documented to occur at water temperatures (T,) ~33°C (3, 10, 23)?
Moreover, exercise in water affects the rate of core cooling and may even increase core temperature, depend- ing on intensity of exercise (13, 30), T, (13, 30), body obesity (31), area-to-body weight ratio (27), and whether or not the limbs are being exercised (30). These factors may be expected to change the relative proportion of the loss of heat from limbs to water.
With the above points in mind, the rate of body heat loss was measured in the present study on men at rest and at light and heavy exercise during nonshivering immersion in T,,. In addition, to evaluate the effects of temperature on the rate of heat loss, the latter was determined also at temperatures lower than critical at rest and heavy exercise. The heat flow was measured directly from limbs and trunk and indirectly by applica- tion of the body heat balance equation (4, 9) from meas- urements of O2 uptake (VOW). The relative magnitude of the flow of stored heat from core and shell was evaluated, as was the relative magnitude of trunk heat flow vs. limb heat flow.
MATERIALS AND METHODS
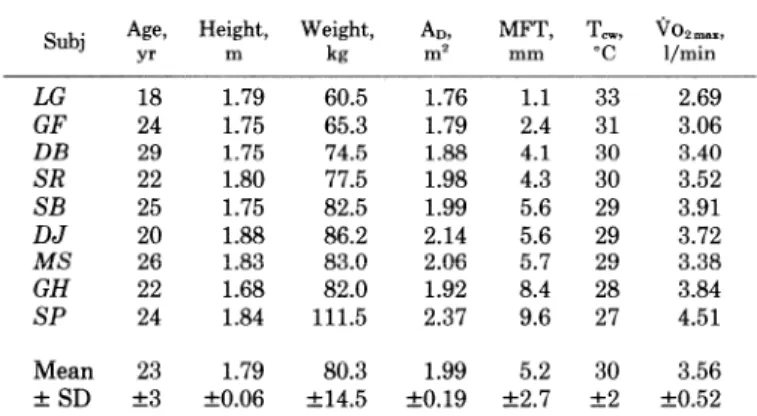
Nine normally fit young males, covering a wide range of adiposity, were selected as subjects. Their anthropo- metric characteristics are given in Table 1. Body surface area (An) was calculated according to the method of DuBois and DuBois (15). Mean subcut,aneous fat thick- ness was calculated from measurements of skinfold thickness at 10 sites, as suggested by Allen et al. (1), using a Lange skinfold caliper (Cambridge Scientific Instruments, Cambridge, MD). T,, was measured as described by Rennie et al. (24). Maximal 00, (vOzmax)
1240 REGIONAL HEAT FLOWS IN WATER
TABLE 1. Physiological characteristics of subjects --
Age, Height, Weight, AD, MFT, T,, ~%mx,
Subj yr m kg m” mm “C l/min LG 18 1.79 60.5 1.76 1.1 33 2.69 @ Front side Q Back side GF 24 1.75 65.3 1.79 2.4 31 3.06 DB 29 1.75 74.5 l&3 4-l 30 3.40 SR 22 1.80 77.5 1.98 4.3 30 3.52 SB 25 1.75 82.5 1.99 5.6 29 3.91 DJ 20 1.88 86.2 2.14 5.6 29 3.72 MS 26 1.83 83.0 2.06 5.7 29 3.38 GH 22 1.68 82.0 1.92 8.4 28 3.84 SP 24 1.84 111.5 2.37 9.6 27 4.51 Mean 23 1.79 80.3 1.99 5.2 30 3.56
t SD &3 kO.06 zk14.5 kO.19 k2.7 zk2 zkO.52
AD, body surface area; MFT, mean subcutaneous fat thickness; T,,, critical water temperature; vozrnax, maximal O2 uptake.
was determined in air at 20-22°C during simultaneous arm cranking and leg pedaling, before the procedure described below. At all work loads, two-thirds of the total mechanical power was imposed on the legs and one-third on the arms. Starting from 90 W, the total work rate was increased by 30 W at each step, whose duration was 5
min. Vo2 was determined at each work level during the
last 30 s of exercise. VO 2 max was defined as the VO, level not followed by a raise ~2% at a further work rate increase.
The skin-to-water heat flow (H) was measured by
means of circular heat flow disk transducers (Thermo- netics, San Diego, CA) placed in 10 different regions, whose surface area was calculated according to Sawyer et al. (26): chest (9% of total An), abdomen (9%), back (20%), upper arm (8%), forearm (7%), hand (3%), thigh (18%), calf (13%), foot (4%), and forehead (7%). The positions of the disks are shown in Fig. 1. The disks were glued on the skin surface by a strip of double-faced surgical tape (Stomaseal, 3M, St. Paul, MN). Diameter and thickness of the disks were 25 and I.74 mm, respec- tively; their thermal insulation was 0.0067”Co rn2. W? The calibration factors provided by the factory, which have been reported to be less than t5% of independently determined values (2l), were used. The resulting values were corrected for the presence of the disk insulation along the thermal gradient (22). The regional heat flows (W/m) were converted to *W for calculated surface area of each body segment. The assumption was made that the heat flux measured by the disks at rest and exercise was representative of the mean heat flux of the body region on which each disk was glued. This assumption was tested on two subjects during resting immersion at T,, on all segments except the head. Eight disks were located on one region. The resulting mean value of heat flow was then compared with the corresponding value independently determined by means of one disk only located on the same position as in Fig. 1. A paired t test showed no significant difference between the two groups of H values (n = 18; P > 0.05). Since an increase of heat production above resting makes temperature gradients and radial heat flows within each body segment more homogeneous (25), the test was not repeated during exercise.
The total body heat flow, HDIR, was calculated as the
FIG. 1. Sites at which heat flow disks were glued onto skin surface.
sum of all regional heat flows. Furthermore all body
segments, except the head, were divided into two groups representing the trunk (HT) and the limbs (HI,).
T, around the subject was measured by a thermocouple inserted in a 3-cm-long 25-gauge needle floating 20 cm from the abdominal skin surface. Rectal temperature (T,,) was measured by a rectal probe (Yellow Springs Instruments, Yellow Springs, OH) inserted 20 cm into the rectum. Thermocouples and thermistors were cali- brated in thermostated, well-stirred water against a high-
precision mercury thermometer (National Bureau of
Standards). All the measured parameters were recorded on a polygraph (Grass Instruments, Quincy, MA).
0, consumption was measured by standard open-cir- cuit method. Expired air was collected in Douglas bags and subsequently analyzed for gas composition and vol-
ume (Applied Electrochemistry 5-3A O2 meter, Beckman
LB-2 CO2 meter, and Singer dry gas meter). The rate of metabolic energy production (& in W) was calculated on the basis of an O2 caloric equivalent of 20.3 and 20.9 kJ/ 1 0, at rest and exercise, respectively. The rate of meta- bolic heat production (2M, in W) was then calculated as M = @ - r/t: where I@ is the mechanical power output. An indirect determination of the body heat flow (HM) was then made by correcting 1M for an 8% respiratory heat flow (23) (from here on, nonrespiratory M is defined as 0.92 2M) and for the rate of loss (-t) or gain (-) of core heat stores (S,): HM = 0.92 IM t S,. In turn, S, was
REST - Tcw n=7 + bock q chest 0 thigh 4p forearm I abdomen A arm 100 - e 0 ccilf Ir r A hand a 0 80 - : x foot 60- o 40 - *ftf?lli*ft* 20 - OL 1 I I ! I I I ! I 0 20 40 60 80 100 120 140 160 180 38.5 ,- T 38.0 re 37.5 0 ( Cl 37.0 36.5 I - ’ 0 20 40 60 80 100 120 140
time of immersion (min)
calculated from the rate of change of T,, when \io2 was measured (Tr,, in *C/h), if we assume 1) a mean specific heat of the body of 3.47 kJ. kg-‘. YF, 2) a core mass equal to 60% of the subject’s body mass at rest and 90% during exercise (2, lo), and 3) a nil rate of change of shell heat stores after 1 h of immersion (10, 12). Thus, at the end of a resting immersion period, SC (in W) = T,, x 3.47 x 0.6 X BW X 0.278, where 0.278 is the correction factor from kJ/h to W and BW represents body weight. Experimental procedure. Each subject reported to the laboratory in the morning and rested for -30 min in 20- 22OC air temperature. Then he sat on a chair fixed on a frame described elsewhere (14), and after instrumenta- tion he was lowered to the neck in a stainless steel tank (3 m x 1.5 m x 2 m) full of water, whose temperature was regulated around the desired values with a precision of tO.l”C. The water was stirred by a water pump in a circular direction at a velocity of 0.1 m/s. To further increase the motion of water, the whole frame was pushed and pulled back and forth in the anteroposterior direc- tion over a 50-cm distance at a velocity of 0.15 m/s. A bicycle ergometer adapted for underwater exercise (14) allowed both upper and lower limb work to be performed. The work load distribution was equal to that selected for the measurement of Vozmax.
The following experimental protocols were applied during immersion in water at T,,: 1) 3 h at rest (7
160 180
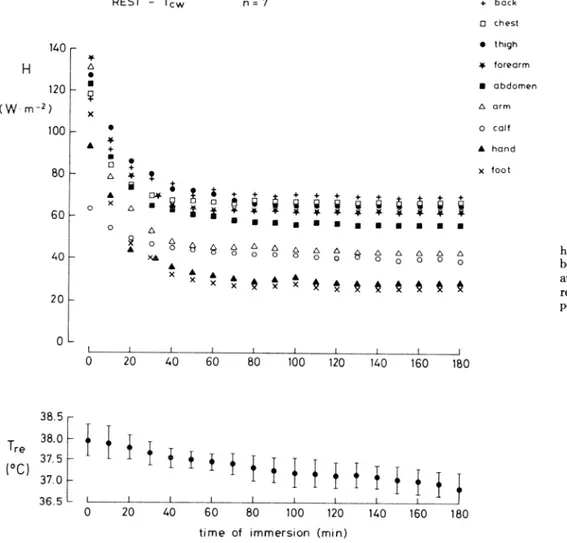
FIG. 2. Time course of skin-to-water heat flows (II, in W/m”) from indicated body regions (top) and of rectal temper- ature (T,,, in “C; bottom) during 3 h of resting immersion at critical water tem- perature (T,,; n = 7). I, Mean * SD.
subjects), 2) 3 h of continuous light exercise (3 MET, 0.30 voqmax; all subjects), and 3) 1 h of heavy muscular work (7 MET, 0.70 VO 2 max) preceded by 1 h at rest. This last protocol was conducted on four subjects only; i.e., those who could achieve a steady state for heat flow at exercise before exhaustion (SR, SB, MS, and GH). GF and SP, who performed the light exercise protocol first, did not volunteer for further studies. Thus, at rest, n = 7 instead of n = 9. At all protocols, expired air was
collected for VO, measurements at 15min intervals. All
other variables were continuously measured through the entire time of immersion.
The above protocols at rest and at heavy exercise were carried out also at T, < T,, on the same subjects as at T,,. At rest, however, the immersion lasted from 80 to 170 min only, because of the onset of shivering, detected by a measurable increase of the metabolic rate. To repro- duce as closely as possible the condition after 3 h at T,,, the present analysis takes into account only those exper- iments that showed steady-state heat flows before shiv- ering. As a consequence, below T,,, each of the seven subjects performed different numbers of tests (see RE- SULTS).
RESULTS
Resting heat loss at To,. The time courses of the mean heat flows (H, in W/m”) observed at rest at T,, from all
body segments except the head are given in Fig. 2, together with the changes of T,. Steady heat flows were
achieved in -60 min and were maintained thereafter,
despite a slow but continuous drop of T,, (Tr, = -0.29 t 0.23 “C/h during the last hour of immersion).
The absolute rates of heat loss by each body region
measured 3 h after immersion are given in Table 2.
Including the head, H DIR at rest in T,, was equal to 120 t 27 (SD) W (or 60.4 t 13.3 W/m”) for an average VO, of 0.33 l/min (0.92 1M = 101 t 27 W). HM was 111 t 29 W, a value significantly different from HDIR (P c 0.05). HL and HT were 56.4 t 14.6 and 52.3 t 14.2 W, i.e., 47 and 44% of HDIR, respectively.
Effect of temperature on rate of heat loss at rest. The time courses of the resting heat flows and of T,, obtained at the coldest T, are shown in Fig. 3 (T, = 22”C, or T,, - 6°C). This temperature was tolerated by only the most obese subject (GH). A steady state for heat flow was achieved in -60 min and was maintained thereafter. However, the steady-state H values in T,, - 6 were significantly higher (P < 0.05) than those observed on the same individual in T,, (28OC), although the corre- sponding Vo2 values were equal (0.39 and 0.41 l/min for
GH at T,, - 6 and T,,, respectively). A comparison
between the regional H attained by GH in 28 and 22°C water is shown in Fig. 4. The increase of heat loss at 22°C was more pronounced in the limbs (+70%) than in the trunk (+50%), mainly due to the increased H from calf and forearm. In the remaining six subjects, who were immersed in water at most 4°C colder than their T,,, H declined with patterns similar to those shown in Fig. 3, reaching steady value within 60 min. The time of im- mersion ranged from 80 to 170 min, depending on the subject’s adiposity and T,. Figure 5 shows HDIR, HM, and 0.92 2M as a function of relative water temperature (T, - T,,). The three lines intersected at T, = T,, + 1.5OC. A highly significant inverse relationship existed between HDIR and T, - T,, [HDIR = 125.98 - 14.91 (T, - T,,); n =30; r- -0.838; P < O.OOl], having a standard error of the estimate (sy,) of 24.2 W. By contrast, 0.92 1M and HIM were only slightly affected by changing T, [0.92 2M = 108 - 3.4 (T, - T,,); n = 30; r = -0.426; P < 0.05 s,., = 14.4 W; HM = 117.7 - 8.45 (T, - T,,); n = 30; r = -0.681; P c 0.05 qx = 22.8 W]. The distribution of
heat flow between trunk and limbs was virtually un-
changed over the range of temperatures studied (H,/ H DIR = 0.44 - 0.005 T,; n = 30; r = -0.297; P > 0.05).
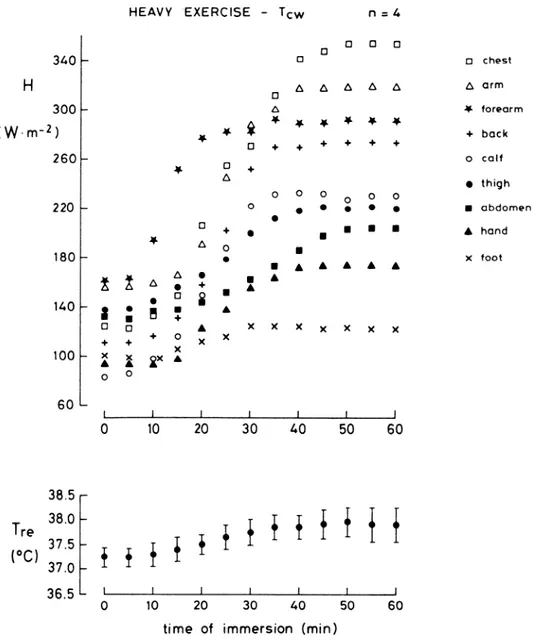
Effect of exercise on heat flows at TCW. The time courses of the mean regional heat flows (H, in W/m”) during heavy exercise (VO, = 2.27 t 0.50 l/min, i.e., -7 MET; 0.92 1M = 526 $- 160 W) at T,, are given in Fig. 6. Steady- state heat flows were reached in -45 min of continuous exercise. Similar patterns were observed during exercise of lower intensity (i70, = 1.06 t 0.26 l/min-‘, i.e., -3 MET; 0.92 2M = 276 t 78 W). The heat flows from each body region at the end of the 3- and 7-MET exercise are summarized in Table 2. During 3-MET exercise, HDIR
was 285 t 69 W (HM = 260 t 60 W). HT and HL were
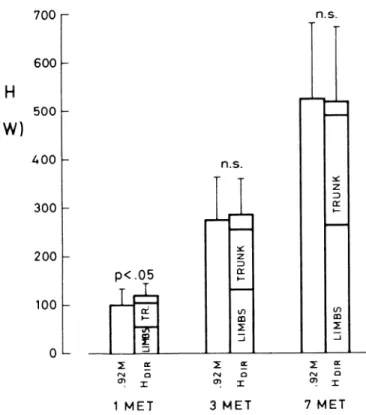
122 t 43 and 130 t 27 W, respectively. During 7-MET exercise, HDIR was 517 t 148 W (HM = 496 + 98 W). HT was 226 -t 100 W and HL was 262 & 61 W. A comparison between HDIR and 0.92 A4 as a function of exercise is attempted in Fig. 7. At rest, HDIR was 20% greater than 0.92 1M, whereas at 3- and 7-MET exercise, HDlR was equal to 0.92 AL The relative values of HT/HDIR and HL/ HDIR are shown in Fig. 8 for the three studied metabolic levels. In all conditions, HT was 0.43 HDIR; i.e., the increase of HT was proportional to that of HDIR. By contrast, HL increased from 0.47 HDIR at rest to 0.51 HDIR at 7-MET exercise. The increase of HL was proportion- ally greater in the arms than in the legs and occurred at the expense of the heat loss from the head.
Role of temperature in modulating heat flow during exercise. The patterns of heat flow observed during 7- MET exercise at T, < T,, were equivalent to those observed at T,,. Steady-state heat flows were reached in -50 min in all body regions. Steady-state H values were higher than those observed at rest at the same T,. However, contrary to rest, no change of HDIR, HIM, and 0.92 iM occurred during exercise by lowering T, (Fig. 9). In the considered temperature range, HDIR was not sig- nificantly different from HM and 0.92 1M (P > 0.05). At work, also T, did not affect HT and HL”
DISCUSSION
Resting heat flow at TCW. The approximately cylindrical limbs account for a greater percentage of total body area than the trunk and also have a higher surface-to-volume ratio, both of which facilitate preferential heat exchange from limbs to water (18, 27, 30). By contrast, it is well known that nonshivering heat is produced mainly in the viscera (lo), that the circulation to the limbs is reduced to a minimum in T,, (3, 10,24), and that countercurrent heat exchange between arteries and deep veins minimizes
TABLE 2. Regional heat flows measured at rest and during light and heavy exercise at TCW
vo2, Tre, Trunk Lower Limbs Upper Limbs
n l/min “C Trunk Limbs Head Total Total, Chest Abdomen Back Thigh Calf Foot Arm Forearm Hand W/m”
~~~ ~~~ Rest 7 0.33 36.86 14.4 10.4 27.5 21.1 14.5 2.5 7.1 8.8 2.4 52.3 56.4 11.3 120.0 60.4 to.07 kO.38 -c-7.1 t3.5 t9.1 t8.2 t4.8 tl.5 t1.9 23.6 k1.3 214.2 H4.6 t3.8 t27.3 t13.3 Exercise 3MET 9 1.06 37.33 30.7 29.9 61.7 42.5 36.9 7.4 20.8 17.7 5.1 122.3 130.4 31.8 284.5 143.0 k0.26 to.54 kll.l 212.9 -t-26.1 k15.2 HO.0 -1-3.6 k8.8 zk6.9 k4.2 t43.2 k27.2 k9.3 t68.8 t34.4 7MET 4 2.27 37.90 68.0 37.0 121.2 78.9 60.1 12.3 55.0 41.4 14.3 226.2 262.0 28.7 516.9 261.8 to.50 to.34 k51.1 k15.2 t52.8 k33.8 k12.6 -+4.0 k46.8 -t-14.6 26.6 t99.8 zk61.4 t17.8 t147.9 k-82.4
Values are means t SD; heat flow values expressed in W. Total heat flow = VO,, 0, uptake; T,, rectal temperature; 3 MET, light exercise (0.30 VO
sum of head, limbs, and trunk. T,,, water at critical temperature; 2 ,,,); 7 MET, heavy exercise (0.70 VO, ,,,).
Subj GH rest Tw = 22Oc (&W-S) t + 280 o + back 0 calf H 0 chest 240 l thigh (W -ma2) 200 160 40 g + gr forearm 0 A 0 A arm + m abdomen 0 0 + + + + z 8 0 +++++++ A hand ii 0 0 0 0 x foot OL I ! 1 I 1 I 0 20 40 60 80 100 120
FIG. 3. Time course of skin-to-water heat flow (H, in W/m”) from the indi- cated body regions (top) and of rectal temperature (T,,, in “C; bottom) observed in GH during resting immersion in 22°C water [critical water temperature (T,,) - 6"C]. T,, water temperature.
36.5 L ' 1 I 1 I I I
0 20 40 60 80 100 120
time of immersion (min)
convective heat transfer from trunk to limbs (4). These
factors should reduce the limb-to-water heat flow and
counterbalance the favorable geometry of the limbs with respect to heat exchange. As a consequence, during rest- ing immersion in T,,, almost the same amount of heat was being lost by the trunk and the limbs (Table 2). Similar results “were obtained by Rennie (23) on Korean diving women, who were characterized by higher thermal
insulation than nonacclimatized Caucasians (24) and
also by Wade et al. (32) in totally immersed subjects at 25OC, although Wade et al. interpreted their data in terms of a greater role of the trunk in the whole-body heat flow. Also Hayward and Keatinge (16), on the basis of regional insulation measurements, claimed that the trunk was the main site of heat loss during resting immersion in water. However, their conclusion is greatly affected by the method employed in the calculation of regional insulation. In fact, in that study the regional insulation was calculated as the ratio of the overall thermal gradient to the local skin heat flow.
At the end of the resting immersion at T,,, E&R was
120 W, whereas HM was 111 W. Since HM takes into
account changes of temperature occurring only in the
core, we suggest that the (120 - 111) 9-W difference
represents the depletion of the heat stores in the shell. If we assume that the shell accounts for 40% of the body weight for a 77%kg subject, such a change of stored heat would correspond to an average rate of temperature decrease in the shell of 0.35”C/h.
Effect of water temperature on resting heat flow. The body heat balance equation for the calculation of the changes in the body’s heat stores (S) in air, as defined by Bligh and Johnson (5), can be simplified during immersion in well-stirred water: conduction and radia- tion are negligible or zero, evaporation is restricted to the respiratory heat loss (equal to 0.08 M), and convec- tion corresponds to HDIR. In the present study, HDIR was measured directly by heat flow disks and expressed as watts per regional An or watts per square meter. There- fore, during water immersion, the rate of change of the whole-body heat stores (S), i.e., the sum of the rate of changes of core (S,) and shell (S,) heat stores, is given by: S, + S, = S = HDIR - 0.92 (l? - I@ = HDIR - 0.92 AL Hence, S, at the end of a 3-h resting period, is given by the difference between the continuous and dotted lines of Fig. 5. It appears from Fig. 5 that 1) HDIR, which
1244 REGIONAL HEAT FLOWS IN WATER H (w) Tw = 22 “C CHEST Tw ~28°C ABDOMEN BACK TRUNK THIGH CALF FOOT ARM FOREARM HAND LIMBS
FIG. 4. Steady-state regional heat flows (H, in W) observed at end of resting immersion in 22 (T,, - 6°C; q ] and 28°C (T,,; q ) water. Trunk values are sum of chest, abdomen, and back. Limb values are sum of remaining 6 heat flow values.
takes into account S changes in the whole body, is
inversely proportional to T,; 2) HM, including only the
S, changes (see MATERIALS AND METHODS), is only
slightly affected by T,; and 3) 0.92 M, corresponding to the heat loss in a thermal steady state, is not affected by T,. The three lines intersect at T, = T,, + 15°C. At this temperature, a thermal balance is reached within the 3rd h of immersion, and no gain or loss of stored heat would occur thereafter (S = 0). T, at the point of intersection of the three lines of Fig. 5 is the coldest T, in which a subject is not losing any stored heat after 3 h of immersion It corresponds to the critical temperature described by Smith and Hanna (28). In warmer T,, the body gains heat (negative S), whereas in cooler T,, before the onset of shivering, the body progressively loses more heat (positive S) with colder T,. At a given T,, the difference between HM and 0.92 M and the difference
240 H 200 (WI 160 120 80 40 HDIR -- HM --- -92 M
-A
-6 -4 -2 0 +2 +4 T-Tcw (“0FIG. 5. Steady-state heat flow (rr) or 0.92 M (in W) at rest as a function of relative T, (T, - T,,, “C). -, whole-body heat flow (HDIR) vs. T, fits the indicated points. - - - and . l . . . , H determined
from metabolic rate (HJ vs. T, and nonrespiratory metabolic heat production (0.92 M) vs. T,, respectively. Regression equations are given in text. 1 , temperature at which subject is at thermal balance at end of 3 h of immersion. $, rates of core (S,) and shell (S,) heat store changes at T,, - 6°C. S, + S, yields rate of whole-body heat store changes (S). l , GH; +, LG; x, DJ; q y MS; *, SB; O, DB; A, SR. between HDIR and HM (see Fig. 5) indicate the changes
of S, (see MATERIALS AND METHODS) and S,, respec-
tively. The rate of depletion of the S, is greater, the lower the temperature of immersion. At T, = T,, - 6°C the rate of stored heat loss by the shell at the end of immer- sion was 60 W, which in an 80-kg human would corre- spond to an average rate of shell cooling of 2.26”C/h. It should be pointed out, however, that HIM was calculated according to the commonly accepted assumption that the core mass is 60% of the whole-body mass (2, 10). If this assumption were not true and the core mass were ~60% of body mass, the slope of the HM-vs.-T, relationship would be less and S, depletion would be greater. From the present analysis it can be concluded that the as- sumption that S, = S, involved in the calculation of HM,
is untrue. Figure 5 clearly shows that S, < S. Therefore
HM is not indicative of the actual body-to-water heat flow at rest, even after 3 h of nonshivering immersion. If such an immersion could be maintained for several ad- ditional hours, HIM, and later HDIR, would slowly approach 0.92 Mat all T, colder than Tcw + l.S”C, which is actually prevented by the onset of shivering.
As expected from the above analysis, a tendency to- ward a relative increase of HL was found when Tw c Tcw.
However, the HL-to-H DIR ratio was not significantly re- lated to the temperature of immersion. Similarly, in GH
at 22°C with respect to 28°C T, (Fig. 4), the heat flow increased more in the limbs (especially in the forearm and in the calf) than in the trunk. Consistent with the
present study, Cannon and Keatinge (11) observed a
greater heat flow through the forearm, but no change in
thorax heat flow, when T, was decreased from 31 to
22°C. Also Craig and Dvorak (12) found that a drop of T, led to a greater reduction of S, than S,. However, they assumed that the heat depletion of the shell was
340 H 300 (W .m-*) 260 220 180 140 100 60 HEAVY ‘EXERCISE - Tcw n=4 0 cl 0 0 m Q Q chest AAA AA A arm tl - 0 calf w o + A a thigh QOQoOO - 0 * * e 9 e m abdomen 0 o + l mm m m A hand r A 0 m I e x foot c2bG~J : Ir A A A A l cJ iii! . a 0 c) m + A 0 I!! A x**xxxx + + + 0 x x x . :: r: PX A 0 O
FIG. 6. Time course of skin-to-water heat flow (H, in W/m”) from indicated body regions and of rectal temperature
CL, in “C) observed during 7-MET ex- ercise at T, (n = 4). I, Mean +: SD. L I 1 1 1 I 1 0 IO 20 30 40 50 60 38.5 r T 38.0 re 375 0 1 Cl 37.O . f f f f 36.5 L I I I I I I 1 0 10 20 30 40 50 60
time of immersion (min)
complete after 30 min of immersion, a fact that is con- tradicted by Fig. 5. Conclusions similar to ours about the elusive sources of stored heat loss have also been drawn by others (20,33).
The probability that the shell continues to cool for >3 h in T, < T,, implies that the rate of heat transfer from core to shell is slower than the rate of heat transfer from shell to water. This discrepancy between heat supply to and heat loss from the shell may be partially explained as follows: 1) the shell heat production is not increased before the onset of shivering, 2) the countercurrent ex- change of heat in the deep vessels of the limbs impedes
convective heat transfer from the trunk (4), and 3)
conductive heat transfer from trunk to limbs is negligible (7, 10.
Effect of exercise at TCw. Exercise of 3 or 7 MET performed at T,, caused a rise of the rate of heat pro- duction brought about mostly by the working muscles of the limbs and accompanied by an increase of the rate of
heat loss. However, the regional distribution of HDlR
during exercise was only slighly different from that ob- served at rest (Fig. 8). Although the heat production
occurred mostly in the limbs, HL at 7-MET exercise was only 51% of HDIR, whereas HT was 44% of HDIR. In the present analysis, it was assumed that 80% of the working muscles were located in the limbs (29), which could be an overestimate. Is it possible that more heat is produced in the muscles than is lost and therefore that some heat is brought back to the trunk by blood convection? After 1 h of 7-MET exercise, muscle temperature is constant and higher than core temperature (T,,,,) (25), thus fa- voring heat transfer. from the limbs to the core. During exercise requiring a VOW seven times greater than resting, muscle blood flow in the working thigh is -50 ml l min.
100 ml-’ of muscle (17). If we assume that the arterio- venous O2 difference is 0.15 ml O2 per milliliter of blood, thigh muscle weight is 6 kg (29), and efficiency of cycling exercise is 25%, then the rate of metabolic heat produc- tion of the thighs would be 118 W, a value 49% greater
than the observed thigh heat flow at 7-MET exercise
(78.9 W, see Table 2). It is concluded that, in spite of a possible overestimate of the limb musculature, some heat is moved from the working limbs to the trunk, presum- ably by blood convection, and subsequently transferred
n.s. former is twice that of the legs (8). As a consequence, since the heat produced in the arms tends to flow more easily toward the skin surface, the convective heat trans- fer from arms to trunk should be less than from legs to trunk.
Effects of changing Tw during 7-MET exercise. When
‘-/-MET exercise was performed in T, ranging from 22 to 32”C, T, had no effects either on I&R (Fig. 9) or on the distribution of H DIR between the trunk and the limbs. The overall heat exchange depended only on the exercise intensity, despite a threefold difference in the core-to- water thermal gradient. Since HDIR is the product of the T,,-T, gradient times the overall body conductance (IQ, it follows that K(T,, - T,) = constant and that the relationship between the overall body conductance and the core-skin thermal gradient is a rectangular hyperbola
I: N cn f 600
H
500
WV)
ns. p< .05 ri < b- P 3w g
i at a. 10)
givenThis means that the overall heat flow observed . exercise level was the result of some thermally dependent mechanism. We propose that this mechanism is a reduction in the tone of the cutaneous blood vessels occurring as Tw increases. Hence, at the extreme right of the curve of Fig. 10, a condition in which cutaneous vasoconstriction was likely to be maximal, all the heat flow through the superficial shell (fat + skin) was by conductive heat transfer. When T, was increased and thus the T,, - T, gradient was reduced, an increase of convective heat transfer is postulated to have occurred because of an increase of cutaneous blood flow. This
would proportionately reduce conductive heat transfer
and the T,,,, - T, gradient. At the extreme left of the same curve, cutaneous blood flow would be very great and conductive heat transfer correspondingly reduced. A further reduction of the thermal gradient would probably lead to active sweating, which, although not affecting skin heat loss in water, could be expected to participate in active cutaneous vasodilation (6). On the other hand, a further increase of the thermal gradient would probably lead to a shivering threshold, beyond which the heat production would be greater than expected on the basis of the exercise intensity (7, 10, 20). Similar conclusions for the resting subject can be drawn also from the data of Burton and Bazett (9), obtained at rest at T, > T,, and also plotted in Fig. 10.
7 MET 1 MET
FIG. 7. Steady-state values of 0.92 1M & and HniR (in W) observed at rest [left, O2 uptake (vo2) = 0.33 t 0.07 l/min, n = 71, 3-MET exercise . (middle, Vo2 = 1.06 t 0.26 l/min, n = 9), and 7-MET exercise (right, Vos = 2.27 t 0.50 l/min, n = 4) at T, = T,,. I, SD. In HEIR histograms, fraction of H flowing from limbs and trunk is also shown, with unlabeled areas representing head heat flow. See Fig. 3 and 5 legends for definitions of abbreviations.
to water as HT. By this analysis, the convective heat transfer from the thigh to the core at 7-MET exercise was -39 W.
The distribution of the work load was 67% in the lower and 33% in the upper limbs, whereas only 58% of HL occurred from the legs at 7-MET exercise. This finding is in good agreement with the observations of Toner et al. (30), who reported a higher heat flow from the arms than the legs during arm or leg exercise of a given constant intensity. This fact was attributed to a more favorable geometry for radial heat exchange in the arms than in the legs, since the surface-to-weight ratio of the
H 5o 3 1 H DIR 40 (/I *0 30 20 10 0
1
MET 1 31
7
FIG. 8. Fractional heat flow (H/HDIR, 96) from trunk, limbs,. arms, and legs at rest [l MET, O2 uptake (VO,) 7 0.33 t 0.07 l/min], light exercise (3 MET, Vos = 1.06. k 0.26 l/
min), and heavy exercise (7 MET, VOW = 2.27
t 0.50 l/min) at T, = T,,. I, SD. See Fig. 3 and 5 legends for definitions of abbreviations. MET MET 3 1 TRUNK LIMBS 38% AD 55 ‘lo AD LEGS 36 % AD ARMS 19 ‘10 A D
800 e H e m 700 * I I 1 I I I -6 -4 -2 0 2 4 T,-Tc, (“C 1
FIG. 9. HnrR (uncircled symbols) and 0.92 1M (circled symbols) as a function of T, (T, - T,,, o C). &iR = 0.92 1M (P > 0.05). For comparison, &iR-VS.-Tw relationship at rest, as from Fig. 5, is also given. l , GH; w, MS; *, SB; A, SR. See Fig. 3 and 5 legends for definitions of abbrevia- tions. 80 - 60 p X*Y=7OW
L
1MET e L I 1 I I 1 I I 1 0 2 4 6 8 10 12 14 16FIG. 10. Total body conductance (K, in W/OC) as a function of core- to-skin thermal gradient (T, - T,, “C). l from present data at 7-MET exercise; K was calculated as &ii&Tre - T,). 7-MET line has been drawn for &rR = constant = 583 W (avg &iR from Fig. 9, n = 13). l- MET line (resting condition) is from Burton and Bazett (9). -+) shiv- ering threshold (T, of Burton and Bazett’s subjects). See Fig. 3 and 5 legends for definitions of abbreviations.
Conchsion. The present data show that at the end of up to 3 h of resting immersion in the 22-32°C T, range, trunk and limb heat flows are equal. &R is greater than expected from the metabolic heat production corrected for core heat store variations. This finding suggests that heat store changes occur also in the shell. These changes are greater, the lower the T,.
At exercise, H DIR is increased in direct proportion to the exercise intensity. Such an increase is slightly greater in the limbs than in the trunk. However, the limb heat
flow appears insufficient to match the heat production of the working muscles. It is therefore concluded that some heat produced in the limbs is moved to the trunk by blood-borne convection. Exercise ZYniR is independent of T, all over the tested T, range, a finding suggesting
that HnIR is the result of some thermally dependent
mechanism, such as a progressive peripheral vasodilation occurring as T, increases.
The authors are indebted to P. E. di Prampero for helpful criticisms in reviewing the manuscript and to D. Wilson and S. Poturalsky for their valuable technical assistance.
This study was partially supported by National Heart, Lung, and Blood Institute Grant POl-HL-14414.
This work was carried out during the tenure by A. Veicsteinas of the Henry C. and Bertha H. Buswell Research Fellowship.
Received 23 February 1987; accepted in final form 1 September 1987.
REFERENCES 1. 2. 3. 4. 5. 6. 7. 8. 9. 10. 11. 12. 13. 14. 15. 16. 17. 18. 19.
ALLEN, T. H., M. T. PENG, H. P. CHEN, T. F. HUANG, C. CHANG, AND H. S. FANG. Prediction of total adiposity from skinfold thick- ness and the curvilinear relationship between external and internal
adiposity. Metabolism 5: 346-352, 1956.
ASCHOFF, J., AND R. WEVER. Kern und Schale in Warmehanschalt des Menschen. Naturwissenschaften 45: 477-485, 1958.
BARCROFT, H., AND 0. G. EDHOLM. The effect of temperature on blood flow and deep temperature in the human forearm. J. Physiol.
Lod.102:5-20,1943.
BAZETT, H. C., L. LOVE, M. NEWTON, L. EISENBERG, R. DAY, AND R. FORSTER II. Temperature changes in blood flowing in arteries and veins in man. J. Appl. Physiol. 1: 3-19, 1948.
BLIGH, J., AND K. G. JOHNSON. Glossary of terms for thermal physiology. J. Appl. Physiol. 35: 941-961, 1973.
BRENGELMANN, G. L., P. R. FREUND, L. B. ROWELL, J. W.
OLERUD, AND K. K. KRANING. Absence of active cutaneous vaso- dilation associated with congenital absence of sweat glands in humans. Am. J. Physiol. 240 (Heart Circ. Physiol. 9): H571-H575, 1981.
BULLARD, R. W., AND G. M. RAPP. Problems of body heat loss in water immersion. Aerosp. Med. 41: 1269-1277, 1970.
BURTON, A. C. The average temperature of the tissues of the body. J. Nutr. 9: 261-280, 1935.
BURTON, A. C., AND H. C. BAZETT. A study of the average tem- perature of the tissues, of the exchanges of heat and vasomotor
responses in man by means of a bath calorimeter. Am. J. Physiol.
117:36-54,1936.
BURTON, A. C., AND 0. G. EDHOLM. Man in a Cold Enuironment. London: Arnold, 1955.
CANNON, P., AND W. R. KEATINGE. The metabolic rate and heat loss of fat and thin men and heat balance in cold and warm water. J. Physiol. Lord. 154: 329-344, 1960.
CRAIG, A. B., AND M. DVORAK. Thermal regulation during water immersion. J. Appl. Physiol. 21: 1577-1585, 1966.
CRAIG, A. B., AND M. DVORAK. Thermal regulation of man exer- cising during water immersion. J. Appl. Physiol. 25: 28-35, 1968. CRAIG, A. B., AND M. DVORAK. Comparison of exercise in air and water of different temperatures. Med. Sci. Sports 1: 124-130, 1969. DUBOIS, D., AND E. F. DUBOIS. A formula to estimate the approx- imate surface area if height and weight be known. Arch. Intern. Med. 17:863-871,1916.
HAYWARD, M. G., AND W. R. KEATINGE. Role of subcutaneous fat and thermoregulatory reflexes in determining ability to stabilize body temperature in water. J. Physiol. Lord. 320: 229-251, 1981. JORFELDT, L., AND J. WAHREN. Leg blood flow during exercise in man. CZin. Sci. Lord. 42: 459-473, 1971.
KOLLIAS, J., L. BARTLETT, V. BERGSTEINOVA, J. S. SKINNER, E.
R. BUSKIRK, AND W. C. NICHOLAS. Metabolic and thermal re-
sponses of women during cooling in water. J. Appl. Physiol. 36:
577-580,1974.
MITCHELL, J. W., T. L. GALVEZ, J. HENGLE, G. E. MYERS, AND K. L. SIEBECKER. Thermal response of human legs during cooling.
1248
J. Appl. Physiol. 29: 859-865, 1970.
20. NADEL, E. R., I. HOLMER, U. BERCH, P. 0. ASTRAND, AND J. J. STOLWIJK. Energy exchanges in swimming men. J. Appl. Physiol.
36:465-471,1974.
21. NUCKOLS, M. L., AND C. A. PIANTADOSI. Calibration and charac- terization of heat flow transducers for use in hyrserbaric helium. Undersea Biomed. Res. 7: 249-256, 1980.
22. POPPENDIEK, H. F. A Review of Calibration Methods for Small Heat Flux Transducers. San Diego, CA: Thermonetic, 1979.
23. RENNIE, D. W. Body heat loss during immersion in water. In: Human Adaptability and Its Methodology. Kyoto: Japan Sot. Pro- motion Sci., 1967, p* 36-41.
24. RENNIE, D. W., B. G. COVINO, B. J. HOWELL, S. H. HONG, B. S. KANG, AND S. K. HONG. Physical insulation of Korean diving women. J. Appl. Physiok. 17: 961-966, 1962.
25. SALTIN, B., A. P. GAGGE, AND J. A. J. STOLWIJK. Muscle temper- ature during submaximal exercise in man. J. Appl. Physiol. 25: 679-688,1968.
26. SAWYER, M., R. H. STONE, AND E. F. DuBors. Further measure- ments of the surface area of adults and children, Arch. Intern. Med.
17:855-862,1916.
27. SLOAN, R., AND W. R. KEATINGE. Cooling rates of young people swimming in cold water. J. Appl. Physiol. 35: 371-375, 1973.
28. SMITH, R. M., AND J. M. HANNA. Skinfold and resting heat loss in cold air and water: temperature equivalence. J. Appl. Physiol. 39: 93-102,1975.
29. THEILE, F. W. Gewichtbestimmungen zur Entwicklung des Mu-
skelsystems und des Skelettes beim Menschen. Nova Acta Ksl.
Leap. Carol. Deutschen Akad. Naturforsch. 46: 170, 1884.
30. TONER, M. M., M. Id. SAWKA, AND K. B. PANDOLP. Thermal
responses during arm, leg and combined arm and leg exercise in water. J. Appl. Physiol. 56: 1355-1360, 1984.
31. VEPCSTEINAS, A., 6. FERRETTI, AND D. W. RENNIE. Superficial shell insulation in resting and exercising men in cold water. J. Appl. Physiot. 52: 1557-1564, 1982.
32. WADE, C. E., S. DECANAY, AND R. M. SMITH. Regional heat loss in resting man during immersion in 25.2”C water. Aviat. Space Environ. Med. 50: 590-593, 1979.
33. WEBB P. (Editor). Prolonged and Repeated Work in CoZd Water. Bethesda, MD: Undersea Med. Sot., 1985, publ. no. 58 (WS-SC).