Retrofit of Italian School Buildings
The Influence of Thermal Inertia and Solar Gains on Energy
Demand and Comfort
Antonio
C
ARBONARI11 University IUAV of Venice, Dorsoduro 2206 Venezia, [email protected]
Abstract: Most of the Italian school buildings were built before the 1973 energy crisis, so they need a retrofit to reduce their primary energy demand and improve indoor environment quality. Moreover, regardless of age, these buildings are equipped with large windows; therefore, it is generally necessary to improve the solar control strategy by means of more recent devices and technologies, in order to ensure the conditions of thermal and visual comfort while reducing the energy demand. Furthermore, the older buildings have heavy masonry, in these cases the problem is where it is more convenient to place an additional layer of insulation: inside or outside the buildings opaque envelope elements. This work is aimed to explore, only by means of computer simulations, the effects of various retrofit strategies on energy demand and general comfort conditions. A specific homemade software has been used. The examined strategies are characterized by different positions of the additional insulation and various solar control devices. At present, the case studies consist in two school buildings in the city of Bologna in Northern Italy. In order to assess the influence of internal gains and time profile of use, other possible uses for the same buildings, such as offices or dwellings, have been considered. Simulations results show that the external insulation is always the most performing, but the differences with the internal one are not relevant in the case of the classrooms. The differences increase with the reduction of internal gains and the extension of the daily time of use, therefore with the use as an office and even more with that as a dwelling. The use of slats inserted between glasses to control solar radiation can be proposed in any case and is useful for improving the luminous comfort, without significantly changing the energy demand for lighting, and consequently for cooling. Compared to this type of device, external slats provide less luminous comfort but better thermal comfort in the cooling period, however they reduce incoming luminous flux and involve a remarkable increase in energy demand, furthermore they cannot be proposed in a historical urban context.
1. INTRODUCTION
Most of the Italian school buildings were built before the 1973 energy crisis, so they need a retrofit to reduce their primary energy demand and improve the indoor environment quality (GAITANI et al., 2015; ERHORN-KLUTTIG et al., 2015; DE SANTOLI et al., 2014). Moreover, regardless of age, they have large windows, and this poses problems of solar control (BUVIK, 2015). These buildings generally have a heavy structure with full brick walls, in these cases, one of the main questions that arise is where it is more convenient to place an additional layer of insulation: inside or outside the buildings opaque envelope elements. In general, it is common to think that in the case of discontinuously used buildings, such as offices and schools, it is better to place the insulation inside, in order to exclude the mass from the thermal balance of the internal environment. In this way a low inertia system is obtained, able to respond quickly to the actions of the plant. In practice, the answer is not obvious; the usefulness of thermal inertia depends on a number of factors such as:
- presence in the local climate of significant daily thermal excursions, - relevance of cooling loads compared to heating ones,
- length of the daily use period.
As previous research shows (CARBONARI, 2017), if cooling loads are prevalent, thermal capacity can be useful in utilizing nocturnal free cooling and delaying heating during the time of use. However, often there are other practical or regulatory constraints on the location of insulators outside, as in the case of historical centers of the cities. Normally the Italian school buildings are only equipped with a heating system with water radiators. Therefore, because of relevant internal and solar gains, with the exception of the colder period, they turn out to be overheated.In this study, it is assumed that a full air centralized heating, ventilation and air conditioning system (HVAC) is installed to eliminate overheating and improve air quality, and to quantify the energy cost of thermal comfort in all seasons.
This work is aimed to explore, only by means of computer simulations, the effects of various retrofit strategies and various time profiles of use on primary energy demand and general comfort conditions. The strategies examined are characterized by different positions of the additional insulation and different solar control devices. The computer simulations were performed using the home made software “Ener_Lux” (CARBONARI, 2017), which allows simultaneous analysis of energy and comfort issues, taking into account automatically any solar control action. At the moment the case studies consist of two school buildings of different ages and with different constructive technologies in the city of Bologna, in Northern Italy. In the case of the most recent building type, two alternative construction technologies, based respectively on steel and wood, were also simulated. In order to assess the influence of internal gains, other possible uses for building, such as offices or dwelling, were simulated. The climate of the city is temperate with cold winter and warm summer, in all seasons there are not negligible daily temperature ranges. In this paper some early results are presented.
2. THE CASES STUDIES
The fallowing two school buildings are currently being examined.
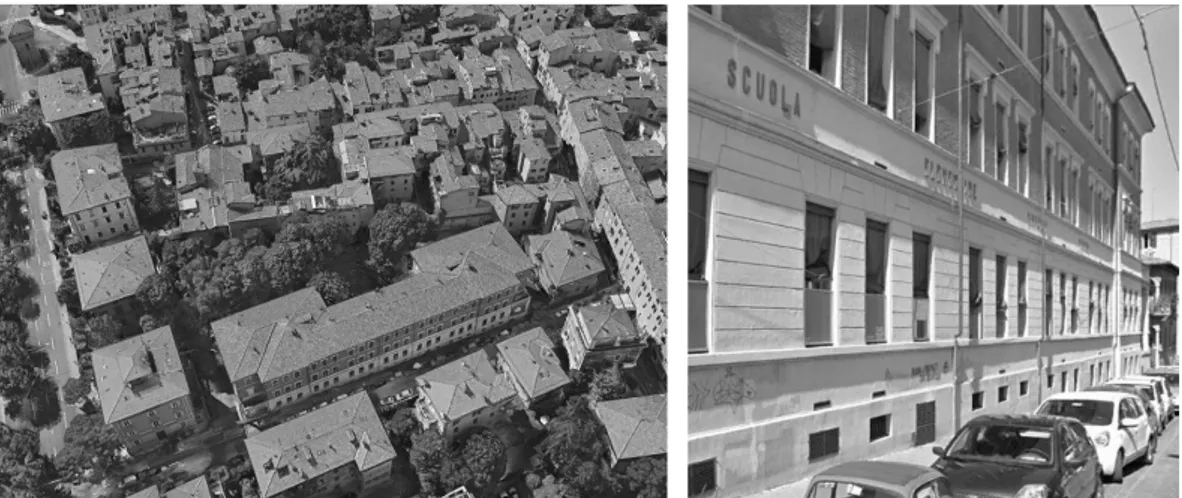
Case A: the elementary school “G. Pascoli”, built in 1915 (Figure 1), with structural internal and external walls in full bricks, 0.25 m thick, with plaster in both sides, horizontal elements are in wood beams and planks, with superimposed lime mortar and bricks. There are vertical wide windows, three in each classroom. Classrooms internal dimensions are: 9.45 m on the side along the façade, 7.39 m on the other side, the height is 4.5 m.
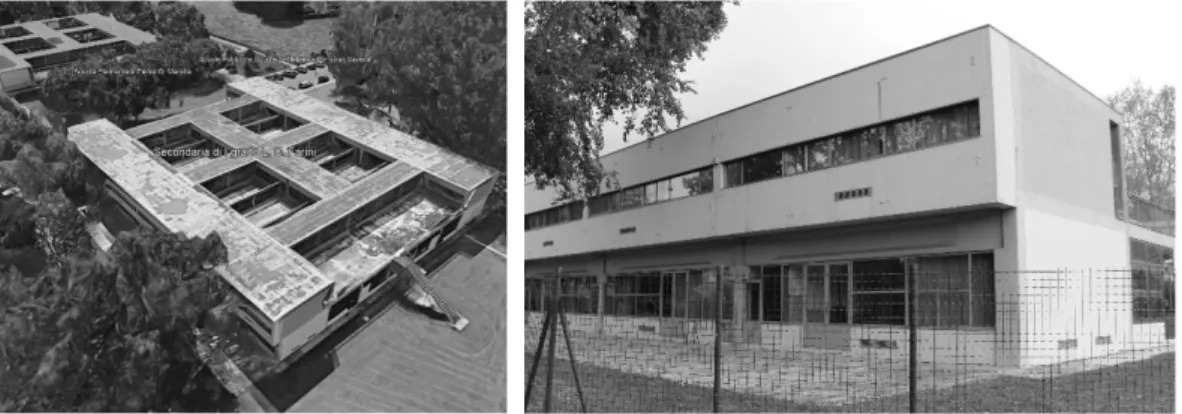
Case B: the elementary and secondary school “L. C. Farini”, built in 1975 (Figure 2), with reinforced concrete structure of beam and pillars, and horizontal ribbon windows. The horizontal elements are in reinforced concrete and hollow tile mixed floors, 0.4 m thick, the walls are made of hollow bricks, 0.12 m thick the external ones and 0.08 m thick the internal ones, with plaster in both sides. Classrooms internal dimensions are: 6.30 m on the side along the façade, 7.17 m on the other side, the height is 3.1 m.
Figure 2: The elementary and secondary school L. C. Farini, built in 1975
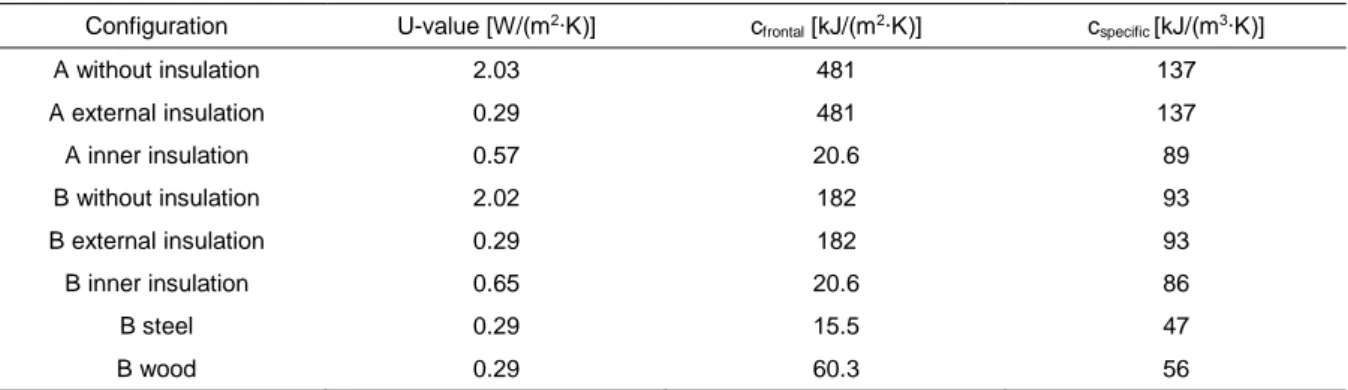
All the examined classroom are approximately East oriented: with 76° (case A) and 63° (case B) East azimuth. In the local climate, this orientation is the less favourable in the cooling period for a room used in the morning, as a classroom. Currently, in both buildings the only solar control device is an internal semi-transparent and diffusing curtain. For each building, the shading effects of urban obstructions that are actually present are considered. With regard to a classroom for each school building, the effects of the addition of two types of insulation, internal and external, are analysed. In order to analyse the influence of the thermal capacity, in all the configurations with external insulation studied, it has been hypothesized a thickness of the insulating material such as to obtain the same value of the transmittance (U-value), equal to the limit value imposed by the current Italian standard, which is 0.3 W·m-2·K-1. Therefore in both buildings the external insulation proposed consist of a layer of rock wool of
about 0.11 m thick with an external protective layer composed primarily of plaster 0.015 m thick. In the case of the older building, this is only a theoretical intervention considering the historical context, in which no modification of the external appearance of the buildings are permitted.
Normally, when an internal insulation is used, its thickness does not exceed 0.05 m. This is due to the fact that a greater thickness would reduce the inner space without making significant energy savings. However, in this study a layer of expanded polystyrene with a thickness of 0.07 m was assumed, this to avoid excessive differences in the U-values compared to the configurations with external insulation, also considering the effect of thermal bridges due to the discontinuity of the internal insulation in correspondence of the slabs. In this way the average U-value of the opaque external borders turns out to be 0.566 W·m-2·K-1 in case A and 0.648 W·m-2·K-1 in case B
(Table 1). The internal insulation is covered with 0.015 m thick plasterboard. For both buildings it was assumed that the glazing is the most widespread and compatible with the existing standards: a double glass with 0.006 m thick sheets glass layers and 0.012 m thick interspace, with a low emissive layer in the external side of the internal glass (overall U-value: 1.8 W·m-2·K-1).
In the classrooms, the presence of twenty-seven pupils and a teacher is supposed. The supposed light plant consist of fluorescent lamps (luminous efficacy: 91 lm/W, maximum total power: 756 W). It is divided into two zones along two bands parallel to the external wall. There are no dimmers. To calculate the primary energy demand related to HVAC, although it is not the best efficient solution, it is assumed that the warm fluid is provided by a gas-boiler, and the cold fluid by an electrically driven chiller. As a first step, the internal air temperature was used as indoor environment control parameter, but the use of the Predicted Mean Vote (PMV) (FANGER, 1970) was also simulated, because this kind of control can be performed by the occupants when the manual adjustment of HVAC terminals is available. Internal set-point air temperatures are assumed equal to 20 °C in winter and 26 °C in summer (as prescribed by the Italian law). While in the middle seasons its value is obtained by interpolation between these two values. Interpolation is based on the monthly mean value of the maximum outdoor air temperature. The relative humidity set point is assumed equal to 50% all over the year.
With regard to thebuilding of (case B), it has been studied the behaviour of other constructive technologies: with steel and wood structure, since their use is currently expanding. The hypothesized building with steel structure has internal and external partitions consisting of sandwich panels; the external one contains a 0.11 m thick layer of expanded polystyrene. The slabs are made of a corrugated steel sheet with superimposed lightweight concrete, its total thickness is 0.24 m, and a roof of paving tiles over a layer of concrete is present. The wooden building uses X-Lam technology. Its outer walls consist of a 0.057 m thick X-Lam layer and an external insulation of 0.10 m thick wood wool, with an external 0.02 m thick protective layer mainly composed of plaster, 0.015 m thick, and an internal 0.015 m thick plasterboard. Even the slabs consist of a 0.30 m thick X-Lam, with superimposed 0.04 m thick concrete, and a 0.02 m thick wooden floor.
In Table 1 the main thermo-physical characteristics of examined classrooms are resumed. The U-values shown in the table are averaged on the surface of the external opaque border, therefore, when the insulation is internal, the U-value include the effects of thermal bridges that are present in correspondence of the slabs. The frontal thermal capacity of the external opaque wall (cfrontal) and the specific volumetric thermal capacity of the classroom (cspecific)
are also shown in the table. These last two quantities do not include the thermal capacity of the masses outside the insulation. The second includes the thermal capacity of the internal building elements that participate in the thermal balance of the classroom. The considered volume is the internal volume of the classrooms.
Table 1: Main thermal characteristics of the classrooms
Configuration U-value [W/(m2∙K)] c frontal [kJ/(m2∙K)] cspecific [kJ/(m3∙K)] A without insulation 2.03 481 137 A external insulation 0.29 481 137 A inner insulation 0.57 20.6 89 B without insulation 2.02 182 93 B external insulation 0.29 182 93 B inner insulation 0.65 20.6 86 B steel 0.29 15.5 47 B wood 0.29 60.3 56 3. METHODOLOGY
The software used, “Ener_Lux” (CARBONARI, 2017), is mainly aimed at the study of solar control devices and related operating strategies. Therefore, it takes into consideration the physical system composed by a room, its glazed surfaces, internal and external solar control devices as well as the surrounding urban environment. Once defined the kind of device and its control logic, the program simulates the dynamic thermal and luminous behaviour of the physical system with hourly steps. And provides the values of the following evaluation indices: Predicted Mean Vote (PMV), Predicted Percentage of Dissatisfied (PPD) (FANGER, 1970), Daylighting Glare Index (DGI) (HOPKINSON et al., 1963) or Unified Glare Rating (UGR) (CIE, 1995), depending on the extent of the light sources present. Other information about the visual environment quality are provided too (ROBBINS, 1986). Then the program calculates sensible and latent room’s thermal loads and the primary energy demand for HVAC and artificial lighting. All control actions aimed at maintaining comfort and energy saving are automatically simulated. To perform room’s energy balance the program usean algorithm based on a thermal grid model. The indexes DGI and UGR are calculated by means of an algorithm simulating occupants’ visual field.
4. ANALYSYS OF THE RESULTS
In the case A, the classrooms, with a bigger volume, have significantly higher thermal capacity than in the case B (Table 1). Moreover, in the second case, the thermal capacity is concentrated in the horizontal structures rather than in the vertical ones. In case A two classroom were examined, respectively located on the second and third floor above ground, while in case B it was only examined one classroom located at the second and last floor. In the first case, the overall area of the three vertical windows is greater than that of the ribbon window of case B (9.75 m2 against 5.57 m2). Therefore, in the second level classrooms the magnitude of solar gains is similar in
both cases, despite the larger urban obstructions of case A, while in the third floor classroom of case A the solar gains are greater than 30% compared to those of the other two classrooms. In the fallowing analysis only the classrooms of the second floors are compared. To simplify the simulation the classrooms are considered adiabatic toward the other internal spaces.
4.1. Energy Demand
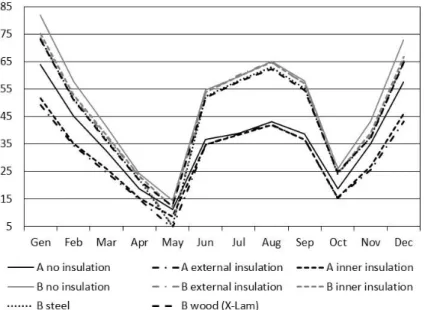
In general, with or without any type of insulation, the case A is less consuming than the case B. This is due to its higher thermal inertia that reduce energy demand for HVAC, especially that related to cooling. Only without insulation the case A is the best consuming during the heating period, because of the U-value of full bricks, slightly greater than that of hollow ones, and of its bigger inertia, which makes heating more difficult, keeping the initial temperatures lower. In all the following figures, the primary energy demand is specific, i.e. referred to the square meter of floor.
Because of the high internal gains, both types of additional insulation, particularly the external one, are useful only during the coldest period, when they reduce the energy demand for heating. In the middle seasons, they only aggravate the problems of overheating, as they prevent the exploitation of night cooling of the masses. With external insulation this negative effect is greater (Figure 3). In the warmest period both types of insulation do not have significant effects, because, due to the higher set point temperatures, the heat flows exchanged through the
envelope are small. Anyway, the best performant insulation is the external one in both buildings examined, but the differences between the two types of insulation are not relevant (Figure 4).
Figure 3: Monthly specific primary energy demand for HVAC and lighting plant in the various configurations [kWh/(m2
floor∙month)]
Figure 4: Annual specific primary energy demand for HVAC and lighting plant in the various configurations[kWh/(m2 floor∙year)]
The annual energy saving due to the insulations is lower in case B (Figure 4), both in absolute terms and in percentage (Figure 10). This is because in case B the energy demand for cooling is dominant and the insulation does not sensibly influence it. In case B the steel structure presents performances very close to whose of the two type of insulation applied to the existing building, in particular to the internal one, while the wood structure appear to be less performant. This is due to the lower diffusivity of the wooden floor, compared to the one in tiles that has been hypothesized in the other cases. This causes the floor surface to heat up more quickly with consequent higher cooling loads. This worsens its thermal behaviour in the middle seasons, particularly in spring (Figure 3). 4.2. Thermal Comfort
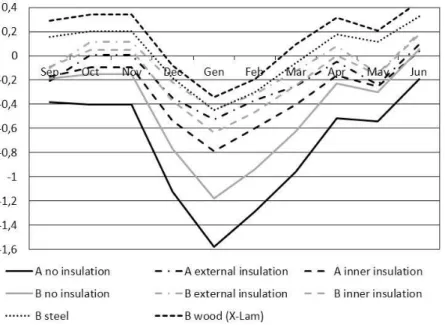
With the same insulation, in all seasons a greater inertia tends to keep the temperatures of the masses and of the internal surfaces lower. The temperatures of the internal surfaces are represented by the mean radiative temperature (MRT), which greatly influences the predicted mean vote (PMV) (FANGER, 1970). Therefore, in the configurations characterized by lower inertia of the case B the thermal comfort conditions, represented by the PMV, are better in winter and worse in the other periods (Figure 5). With the same inertia the external insulation provide better comfort in winter, by means of higher TMR values, but for the same reason it provides worst conditions in middle seasons. There are not sensible differences in the hottest period, in which the classrooms are not used.
Figure 5: Spatial and daily averaged PMV values, in the various configurations
4.3. Luminous Comfort
The evaluation of visual comfort was made only in the hours with daylighting. When visual discomfort conditions are detected it is hypothesized the use of the internal diffusing screen, this reduce the internal average illumination and lamps can be turned on. The case B, with ribbon windows, presents a much smaller frequency of the disability glare (ROBBINS, 1986), due to direct radiation on visual task, and of the discomfort glare, due to the sky visible through the windows (HOPKINSON, 1963). In fact, though the ribbon window, less extended in height, the direct radiation reaches visual tasks less frequently, and the fraction of sky visible from most places is smaller, therefore also the DGI values are lower. Consequently, the classroom of case B uses the lamps for much less time than the classroom of case A.
4.4. Possible Use of Different Solar Control Devices
In all the cases examined, the use of some more sophisticated solar control device is desirable. Movable horizontal slats, external or inserted between glasses, can reduce unwanted solar gains, avoid different kind of glare and improve illumination uniformity in the room.In comparisonto the use of the single diffusing inner curtain these devices, in particular the slats inserted between the glasses, improve the conditions of visual comfort. Considering the urban context, the external slats, which have considerable dimensions (normally not less than 0.3 m deep in the orthogonal direction to the facade), and its supporting structure, can be proposed only for the building of case B, while the small slats inserted between the glasses of the windows can be proposed in both cases.
Figure 6: Annual specific primary energy demand for HVAC and lighting plant in case A and B, always with external insulation, with different solar control devices[kWh/(m2
Both shielding devices, in particular the external slats, improve thermal comfort by mitigating overheating conditions and avoiding direct radiation on occupants. The slats inserted between the glasses have a higher reflection coefficient than the external ones (equal to 0.7 in energy field and 0.78 in visible range), therefore they provide the necessary incoming luminous flux assuming a greater slope, this reduces the fraction of visible sky therefore the DGI values. Moreover, this kind of slats are packable in the hours with lower solar radiation, consequently, energy demand for lamps is not significantly modified. On the other hand, this type of slats leads to higher internal glass temperatures, this reduces the advantages regarding thermal comfort and energy demand for HVAC in the cooling period.
External slats, are not packable and present a lower reflection coefficient value, assumed equal to 0.6 both in energy and in luminous field, therefore, with the orientation that they have in the case studies, they involve an increase in energy consumption for lamps, as they reduce the incoming luminous flux. Consequently, also the energy demand for cooling increases. These results would change significantly if dimmers were used; with the current hypothesis, an insufficient illumination in the most disadvantaged place causes the lighting of half the park lamps.
4.5. Possible Reuse of Buildings such as Offices or Dwellings
In order to explore the influence of internal gains and time profile of use the possible re-use of the same buildings for other functions such as offices and dwellings was simulated.
Figure 7: Office. Monthly specific primary energy demand for HVAC and lighting plant in the various configurations [kWh/(m2
floor∙month)]
Figure 8: Dwelling. Monthly specific primary energy demand for HVAC and lighting plant in the various configurations [kWh/(m2
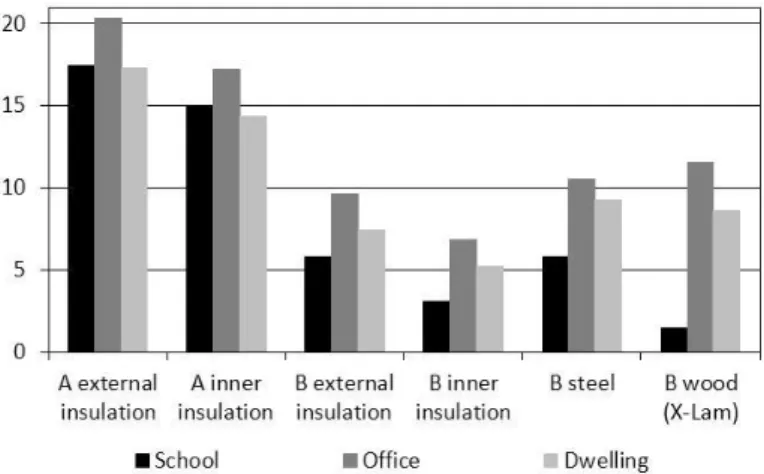
In the case of offices, it was hypothesized the presence of six occupants with the related equipment in the space previously used by a classroom. It was assumed that the daily time of use is twelve hours: from eight in the morning to eight in the evening. In comparison to school use, given the lower internal gains, heating consumption in the winter period is significantly higher, whereas in the other seasons there are no significant differences. Therefore, the total annual consumption is greater than in the case of classrooms. In comparison to the classrooms, the annual energy saving due to insulations is greater, particularly in case A, which in absence of insulation shows the highest consumption for heating.
In case of residential use, the building is used continuously, during the heating period the night set point temperature is reduced to 15 °C. Because of the longer usage time, the total annual primary energy demand is significantly greater, despite lower internal gains. The energy savings due to insulations are also greater, especially in case A. Compared to other uses, the differences in the energy savings between the various types of insulation are greater in absolute terms, but not in percentage. The external insulation is every time the most convenient (Figure 9-10).
Figure 9: Total annual specific primary energy demand for HVAC and lighting plant in the various configurations and for different uses of the buildings [kWh/(m2
floor∙year)]
In Figure 9 total annual specific primary energy demand in the various configurations and for different intended uses of the buildings is resumed, and Figure 10 shows the percentage energy savings achievable with the insulations. The insulation mainly reduces the energy demand for heating, therefore by means of it the greatest savings, both in absolute and in percentage terms, are obtained in case A, which starts from higher heating consumptions. The intended uses that lead to lower internal gains imply higher energy demand for heating, while a longer period of daily use causes higher consumption in general. Therefore in these cases the savings achievable with the insulations, compared to the case of classrooms, are always higher in absolute terms.
Figure 10: Percentage energy savings achievable with the two types of insulation compared to the reference configuration, that without insulation
The energy savings achievable with the insulations decrease with the reduction of thermal inertia both in absolute and in percentage terms. In fact, the configurations of case B present greater total energy demand, mainly due to cooling, and insulation has little influence on it. With the increase in energy demand, due to lower internal gains and longer daily periods of use, the relative convenience of the external insulation with respect to the internal one increases in absolute terms both in the case A and B, in the case A it also increase in percentage terms.
4.6. Possible Use of Different Indoor Environment Control Parameters
At present there are no indoor environment control systems based on the PMV value, however it can be assumed that the occupants, if they can control the plant terminals, do so in order to obtain a mean spatial value of the PMV in the room close to zero. Therefore they will try to compensate an unsatisfactory MRT value by adjusting the air temperature.
Generally, this type of control involves a greater demand for primary energy, compared to the control based on indoor air temperature. At parity of the other quantities influencing thermal comfort, energy consumption increases with the increase of the difference between the MRT value and the desired value of the operative temperature (to).
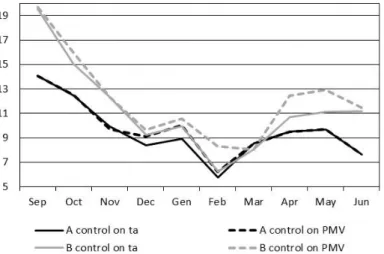
This difference is mainly influenced by the thermal inertia and the time profile of use. Figure 12 shows the percentage increase in total primary energy demand due in various cases to the use of the PMV value, instead of the indoor air temperature value, as an indoor environment control parameter.
In the case of classrooms, which are not used in the warmer months, the thermal inertia increases these differences in the winter but attenuate them in the middle seasons (case A). The external insulation mitigates this problem by maintaining higher values of the MRT. In case B there are relevant differences in spring too, its minor inertia does not keep the MRT values low (Figure 11).
Figure 11: Classrooms with external insulation, comparison between total primary energy demand with different indoor environment control parameters in cases A and B [kWh/(m2
floor∙month)]
In the case of offices the differences are more pronounced in the cooling period (summer and middle seasons). In particular the greater inertia (case A) accentuates the percentage difference in the energy demand for cooling. Only in the case of dwellings, continuous use, even at night, means that the MRT values are closer the desired to.
Therefore the differences between the two type of control are very attenuated. Even, in case B with external insulation, the control on PMV becomes slightly advantageous thanks to lower summer consumption.
Figure 12: Percentage increase in total primary energy demand due to the use of the PMV, instead of the indoor air temperature, as a control parameter of the indoor environment, in various cases
5. CONCLUSION
These first results show that, in the considered climate, thermal inertia is useful to reduce the energy demand for HVAC,especially that related to cooling. This is mainly due to the fact that it allows to exploit the nighttime cooling of the masses during the cooling period. Therefore, with the same insulation, the configurations characterized by a lower inertia have higher energy demand.
In all the cases examined, the external insulation is more advantageous than the internal one, mainly because it is more efficient in reducing the energy demand during the heating period. In the middle seasons, both types of insulation are counterproductive, because they prevent the exploitation of night cooling of the masses. In the hottest periods, with the same inertia, both insulations seems to be irrelevant, due to the smaller amount of thermal flows exchanged though the building envelope. In general, in the case of classrooms, the differences between the performances of the various types of insulation are not relevant. The relative convenience of the external insulation compared to the internal one increases in the building’s uses characterized by lower internal gains and longer daily periods of use.
In general, the conditions of thermal comfort are better with greater inertia and with external insulation. With the same insulation, greater thermal inertia tends to keep the MRT values lower during the year; therefore, it can improve thermal comfort, but only during the cooling period.At present, in absence of particular devices for solar control, better visual comfort conditions are obtained in case B, with the ribbon windows.
Both the solar control devices examined can improve the thermal and visual comfort. Compared to the external slats those inserted between the glasses are more effective from the lighting point of view and less from the thermal one, since they involve higher temperatures of the internal glass. On the other and, the external slats penalize more the daylighting, and this causes a greater energy demand for artificial lighting and cooling.
6. REFERENCES
BUVIK, Karin; ANDERSEN, Geir; TANGEN, Sverre, 2015. Energy upgrading of a historical school building in cold climate. Energy Procedia, 78, 3342–3347.
CARBONARI, Antonio, 2017. Solar control of extensively glazed facades: a computer method for predicting the effects of various devices and building’s thermal inertia. In: SET 2017 - The 16rd International Conference on
Sustainable Energy Technologies, Bologna, Italy, 17-20 July 2017. Bologna: WSSET.
COMMISSION INTERNATIONALE DE L'ECLAIRAGE (CIE), 1995. CIE 117 – 1995 Discomfort Glare in interior lighting. Vienna: CIE.
DE SANTOLI, Livio; FRATICELLI, Fabio; FORNARI, Filippo; CALICE, Claudia, 2014. Energy performance assessment and a retrofit strategies in public schools buildings in Rome. Energy and Buildings, 68, 196-202. ERHORN-KLUTTIG, Heike; ERHORN, Hans, 2015. School of the future – Towards zero emission with high performance indoor environment. Energy Procedia, 48, 1468–1473.
FANGER, Povl Ole, 1970. Thermal Comfort. New York: Mc Graw-Hill.
GAITANI, Niki; CASES, Laia; MASTRAPOSTOLI, Elena; ELIOPOULO, Eftychia, 2015. Paving the way to nearly zero energy school in Mediterranean region – ZEMedS project. In: 6th International Building Physics Conference,
Energy Procedia, 78, 3348-3353.
HOPKINSON, Ralph.; PETHERBRIDGE, P.; LONGMORE, James, 1963. Daylighting. London: Heinemann. ROBBINS, Claude L., 1986. Daylighting, design and analysis. New York: Van Nostrand Reinhold Company.
![Figure 4: Annual specific primary energy demand for HVAC and lighting plant in the various configurations [kWh/(m 2 floor ∙year)]](https://thumb-eu.123doks.com/thumbv2/123dokorg/5489151.62788/5.892.231.710.565.825/figure-annual-specific-primary-energy-lighting-various-configurations.webp)