LI
DAR
CAMPAI
GN
AT
STROMBOLI
VOLCANO:
METHODOLOGY
AND
RESULTS
S. PARRACINO Department of Industrial Engineering University of Rome “Tor Vergata”, Rome, Italy ENEA guest S. SANTORO Department of Earth and Sea Sciences
University of Palermo, Palermo, Italy University of Palermo, Palermo, Italy ENEA guest G. MAIO ARES Consortium, Rome, Italy
ENEA guest
M. NUVOLI
Nuclear Fusion and Safety Technologies Department ENEA, Frascati, Italy
A. AIUPPA
Department of Earth and Sea Sciences University of Palermo, Palermo, Italy L. FIORANI
L. FIORANI
Nuclear Fusion and Safety Technologies Department ENEA, Frascati, Italy
RT/2016/31/ENEA
ITALIAN NATIONAL AGENCY FOR NEW TECHNOLOGIES, ENERGY AND SUSTAINABLE ECONOMIC DEVELOPMENT
S. PARRACINO
Department of Industrial Engineering University of Rome “Tor Vergata”, Rome, Italy ENEA guest
S. SANTORO
Department of Earth and Sea Sciences University of Palermo, Palermo, Italy ENEA guest
G. MAIO
ARES Consortium, Rome, Italy ENEA guest
LIDAR CAMPAIGN AT STROMBOLI VOLCANO:
METHODOLOGY AND RESULTS
M. NUVOLI
Nuclear Fusion and Safety Technologies Department ENEA, Frascati, Italy
A. AIUPPA
Department of Earth and Sea Sciences University of Palermo, Palermo, Italy
L. FIORANI
Nuclear Fusion and Safety Technologies Department ENEA, Frascati, Italy
RT/2016/31/ENEA
ITALIAN NATIONAL AGENCY FOR NEW TECHNOLOGIES, ENERGY AND SUSTAINABLE ECONOMIC DEVELOPMENT
I rapporti tecnici sono scaricabili in formato pdf dal sito web ENEA alla pagina http://www.enea.it/it/produzione-scientifica/rapporti-tecnici
I contenuti tecnico-scientifici dei rapporti tecnici dell’ENEA rispecchiano l’opinione degli autori e non necessariamente quella dell’Agenzia
The technical and scientific contents of these reports express the opinion of the authors but not necessarily the opinion of ENEA.
LIDAR CAMPAIGN AT STROMBOLI VOLCANO: METHODOLOGY AND RESULTS S. Parracino, S. Santoro, G. Maio, M. Nuvoli, A. Aiuppa, L. Fiorani
Riassunto
Grazie al nuovo sistema di telerilevamento ambientale BILLI – Bridge Volcanic LIDAR, messo a punto dal gruppo di ricerca FSN-TECFIS-DIM dell’ENEA (CR Frascati), è stato possibile condurre una campagna sperimentale presso l’isola di Stromboli (ME) – 24-29/06/2015, allo scopo di rilevare la CO2 presente in eccesso all’interno del plume vulcanico, per fornire un’allerta precoce in caso di eruzione.
Tale ricerca rientra nel progetto BRIDGE - Bridging the gap between gas emissions and geophysical observations at active volcanoes (progetto patrocinato dall’European Research Council).
Parole chiave: Rischio vulcanico, Rivelazione di gas, Telerilevamento laser, Lidar ad assorbimento differenziale
Abstract
Thanks to the innovative, laser-based, remote sensing system, named BILLI – Bridge Volcanic LIDAR, developed at ENEA (RC of Frascati) by FSN-TECFIS-DIM research group, it has been possible to carry out an experimental campaign at the volcanic island of Stromboli (ME), between the 24 and the 29 of June, 2015. The main goal was to detect the exceedance of in-plume CO2 concentration for early warning of eruptions.
The research is funded by the ERC project BRIDGE – Bridging the gap between gas emissions and geophysical observations at active volcanoes.
1. Introduction
2. Material and methods 2.1 The BILLI system
2.2 The BRIDGE DIAL technique 3. The experimental campaign of Stromboli
3.1 The experimental area 3.2 Meteorological parameters 4. Results and discussion
4.1 24/06/2015 4.2 25/06/2015 4.3 26/06/2015 4.4 27/06/2015 4.5 28/06/2015 4.6 29/06/2015 5. Conclusions References Acknowledgements 7 8 8 13 18 18 19 23 27 31 35 43 43 49 54 55 56 INDEX
1. Introduction
The prediction of future volcanic eruptions and prompt alert of neighbouring populations could soon be a reality thanks to an entirely made-in-Italy technology recently developed by ENEA researchers of FSN-TECFIS-DIM research group.
In fact, during the experimental campaign of Stromboli volcano (Eolian Islands, Italy), carried out between the 24 and the 29 of June, 2015, the new laser radar named BILLI – BrIdge voLcanic LIdar, developed by ENEA, has been used to detect and analyze volcanic plumes.
This system, based on a very sophisticated technology, has worked twenty-four hours a day, producing 3D pictures of volcanic plumes evolution at over 3 Km (from the position of BILLI) and achieving fast and remote measurements of carbon dioxide contained in volcanic fumes. According to recent studies in volcanology, the exceedance of this chemical compound is a significant indicator/clue for early warning of eruptions [1,2,3].
For the first time, this complex system has allowed real-time distance measurements of the exceedance of in-plume CO2 concentration, an operation otherwise rare, slow, dangerous and
complex, also for the difficulties posed by distance. Thanks to its mirror system the laser beam can be oriented in any direction, aiming with the maximum accuracy at the volcanic smoke plume area to be investigated.
The first field tests were successfully performed from 13 to 17 October 2014 at Pozzuoli Solfatara in Contrada Pisciarelli (Campi Flegrei crater area, Naples, Italy) [1,2,3] with the support of researchers from the ENEA Portici Laboratory of Environmental Chemistry. Lidar retrievals were in good agreement with conventional techniques, yet based on completely independent and significantly different approaches. In that specific case, measurements were performed over short distances from the position of the system; instead, during the field campaign of Stromboli, measurements were performed over long distances without any risks for authorized personnel. ENEA has developed this particular laser radar or lidar system, under the European Research Council’s BRIDGE (Bridging the gap between gas emissions and geophysical observations at active Volcanoes) project, coordinated by Prof. Alessandro Aiuppa (University of Palermo), to provide more accurate eruption prediction models so that populations might be promptly alerted in case of danger.
It is well known that measuring carbon dioxide in volcanic smoke plumes is a scientific and technological challenge extremely important. As already mentioned, actually eruptions are proved to be preceded by a higher release of gas in the smoke plumes from the crater, such as carbon dioxide, the most reliable precursor gas of volcanic eruptions.
Measurements like these ones have never been realized until now and the laser radar has allowed to carry out scans with speed and continuity more higher than conventional in-situ instruments.
For these reasons, it would also be desirable and useful, in the near future, the installation of fixed lidar stations for volcanoes real-time monitoring.
BILLI laser radar technology can also find application in hostile environments, such as areas where a fire did break out or in industrial or urban areas subject to emissions from combustion processes.
2. Mater
In this sect of a newly warning of time data p 2.1 The BI BILLI is a remote sen composed scheme and Figure 1) A mirror to aim The transm injection s frequency operating i TmHo:YLF nm) that c could also easy to dep Instead, th converter (rial and m
tion is prov y designed f eruptions. processing a ILLI system a complex d nsing that pr of a transm d the mecha A - Technical s m it to the targ mission sub seeded Nd duplication in NIR band F and fiber can prevent be a good ploy in the h he receiver (ADC). Themethods
vided an ove DIAL met This mathe and graphic m differential rovides grou mitter and anical frame scheme of BIL get). b-system is :YAG lase n (DFM – D d (OPANIR r lasers hav t to choose choice, but harsh enviro sub-system e specificati erview abou thod for th ematical tec presentatio absorption und based a receiver eq e are report ILLI system. B s based on: er (powerfu Difference F R); with rega e been disc the best ab t our experi onment near m is based o ons of the w ut BILLI sy he measurem chnique has on of the exc lidar (DIA and range re quipment. F ted in Figure B - Mechanica : a double ul, tunable Frequency M ard to this a carded main bsorption l ience show r degassing on: a telesc whole system ystem mode ment of CO been imple ceedance in AL) system esolved rem For more d e 1. al frame of th grating dy and narro Mixing) and pparatus se nly for theirine [4]. OP ws that they craters. cope, a dete m are repor e of operati O2 in volca emented in M n-plume CO (optical rad mote measur details, a sk he lidar system ye-laser opt ow-linewidt d an Optical e Figure 2. r limited tun PO (optical tend to be ector and an rted in Table
ion and the anic plumes
Matlab scrip O2 concentra
dar) for env rements. Th ketch of th
m (on the left
tically pum th), a devi l Parametric nability (few parametric quite delic n analogica e 1 [1,2,3]. application s, for early pts for real-ation. vironmental he system is he technical ft two steering mped by an ice for the c Amplifier w tenths of c amplifier) ate and not al to digital n y -l s l g n e r f ) t l
P La Hama A Table 1) BIL Figure 2) A cell, DFM: d of the optiona TRA Pump: Quanta aser: Sirah Pr RE T DE amatsu InGaA Agilent Infinii Osc LLI specificati A - Laser syste difference freq al SHG. ANSMITTER a-Ray® Nd:YA recisionScan D ECEIVER Telescope ETECTOR As PIN Photod ADC iVision 3000 X cilloscopes ions. em manufactu quency mixing AG Laser Dye Laser diode G12182 X-Series ured by Sirah. g, OPA: optic Pu Pul Rep Transm L Beam Mir D Fo 2 D Pho B Speci Dyn Sam . SHG: secon cal parametric ulse energy lse duration petition rate itted wavelen Linewidth m divergence rror coating Diameter ocal length Diameter otosensitivity Bandwidth ific detectivity namic range mpling rate nd harmonic g c oscillator. B ngth e 0.5 y 3.5× generator, EB B - Detailed sc 25 mJ 8 ns 10 Hz 2.01 μm 0.04 cm-1 5 mrad (full an Al 310 mm 900 mm 1 mm 1.2 A W-1 0 ÷ 10 MHz ×1011 cm Hz1/ 14 bit 100 Ms s-1 BP: enhanced cheme of the ngle) z /2 W-1 beam profile dye laser ande d
During the experimental campaign of Stromboli, BILLI has worked with two wavelengths and their relative absorption coefficients. See Table 2 [5].
Mode Wavelength [nm] Wavenumber [cm-1] CO2 Abs. Coeff. [m-1]
ON 2009.5369 4976.271 1.934
OFF 2008.4838 4978.880 0.3016
N.B.
2008.4838 →
2009.5369 →
Table 2) Wavelengths, Wavenumbers and CO2 Absorption Coefficients calculated at STP (T=296K, P=1atm) [5].
In fact, the main goal was to evaluate the exceedance of in-plume CO2 concentration; for this reason
the system has worked in DIAL mode of operation. On this regard, it is noted that [1,2,3]:
the system is able to explore the atmosphere in both vertical and horizontal directions; each lidar profile is obtained averaging 100 shots ON and OFF (interleaved between them
with ~0.1 );
the temporal resolution between laser shots – Δt is equal to 10 ns, with a range (spatial) resolution – ΔR of 1.5 m;
a concentration profile is obtained (20 s) by a couple of lidar signals (ON and OFF) using the newly designed mathematical technique named BRIDGE DIAL;
starting from lidar signals of the same scan it is possible to retrieve the dispersion map of in-plume CO2 concentration [ppm] in the investigated area;
knowing the (estimated) plume speed it is possible to obtain the CO2 flux [Kg/s].
The system could also be used for the measurement of wind speed [6], thanks to the ability of steering the optics in different directions. The number of photons backscattered by the atmosphere at a given distance from the instrument is proportional to the backscattering coefficient. This factor is a function of the density of aerosols responsible for the light scattering. Any change in its spatio-temporal distribution during a data acquisition will lead therefore to variations in the lidar returns from one laser shot to another. In particular, a wind flow along the beam axis will be detected from the transport of the spatial inhomogeneities of the backscattering coefficient along the optical path. Moreover, the laser source chosen for BILLI has some remarkable features [1,2,3]:
1. 10 pm stability corresponding to about 0.2 cm-1 stability; 2. enhanced beam profile amplifier (EBPA);
3. dynamic mode option (DMO); 4. piezo wavelength control (PWC);
EBPA: the circular cross section of the amplifier cells inside the dye laser supports an improved quality of the beam profile: near-Gaussian intensity distribution in the far field is obtained, thus implying circular profile, small size and low divergence.
DMO: the longitudinal mode spacing of the dye laser resonator is 0.018 cm-1. Its linewidth is 1.2 pm which corresponds to about 0.025 cm-1. This means that two longitudinal modes will be emitted. Unfortunately, the mode structure is not predictable nor constant over minutes: this means that during a lidar experiment energy could distributed in unknown and unequal parts in the two modes, causing a serious problem due to the narrow bandwidth of the CO2 absorption lines. In order to
overcome this difficulty, dynamic mode option (patent pending) has been developed: a piezo changes the resonator length of the dye laser between every shot, thus modifying the longitudinal
mode structure for successive laser pulses. Hence the spectral shape for successive laser pulses is statistically distributed (in our case 50% of the energy is emitted in each mode) and artifacts due to the longitudinal mode structure are suppressed.
PWC: piezo wavelength control allows the laser system to fire at ON and after 1/10 of second at OFF. This is achieved as follows:
the rotatable Littrow grating of the dye laser is mounted on a tilt piezo changing the wavelength between successive Nd:YAG laser shots so that one shot is fired at ON and the other one at OFF (Figure 3 - A);
although the piezo is fast enough for a 10 Hz repetition rate, the nonlinear crystals inside the DFM and OPA cannot be moved so fast; therefore two more nonlinear crystals have been mounted, the first one after the standard DFM crystal and the second one after the standard OPA crystal; these two new crystals have been mounted with a slightly different angle in order to produce OFF: this is achieved by a special mechanics allowing the adjustment of the new crystal to the slightly different angle with a micrometric screw (Figure 3 - B). The visible and UV emissions of the system could be used for the spectroscopic measurement of other species (e.g. SO2, another key molecule of volcanic plumes).
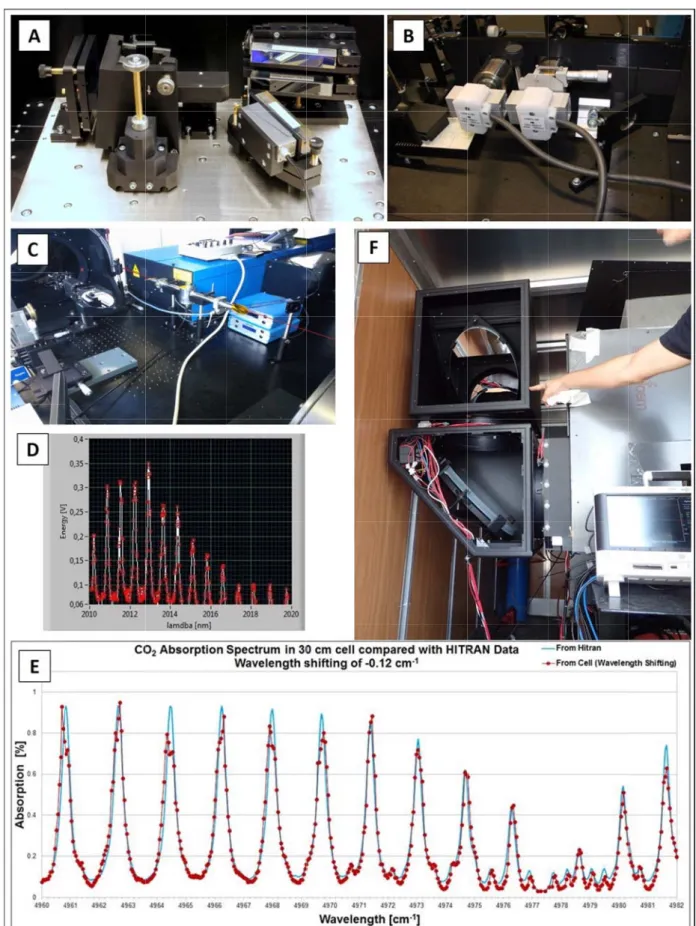
Furthermore, it has been noticed that the measurement error was dominated by instability in wavelength setting. This is why it was implemented a photo-acoustic cell filled with pure CO2 at
atmospheric pressure and temperature, close to the laser exit, as shown in Figure 3 - C. Using new software developed for this application, it is possible to change the transmitted wavelength (by moving the stepper motor inside the resonator cavity of the dye laser) and to record the photo-acoustic signal (averaging 10 laser shots, corresponding to 1 s). Once corrected the wavelength displayed by the laser controller for a small shift (0.12 cm-1), the agreement between experiment and theory [7] is excellent, i.e. within the laser linewidth (0.04 cm-1) (Figure 3 - D). In practice, the wavelength can be controlled by recording the photo-acoustic signal before each atmospheric measurement and the experimenter can set the ON and OFF wavelengths with accuracy better than the laser linewidth.
Summarizing, the system has some special features reported in Figure 3 [1,2,3]: enhanced beam profile amplifier (beam size/divergence);
dynamic mode option (spectral stability); piezo wavelength control (ON-OFF transition); double crystals (ON-OFF generation/amplification); photo-acoustic cell filled with CO2
mechanical control of telescope mirrors (by means of LABVIEW routines) in both horizontal and vertical plane.
Figure 3 Wavelen E - Theo indicates behind th 3) Special Fea ngth Control, oretical (line) s the two larg he experimen atures of the s C - Photo-aco and experime ge elliptical m ter contains la system: A – D oustic cell (in ental (circles a
mirror inside asers and teles
Double Gratin nside the white
and line) CO2 their precisio scope. ng (Grazing In e circle), D -2 absorption sp on motorized ncidence: 240 Photo-acousti pectrum., F - turning mou 00 lines/mm), B ic signal from The experime unt (opened). B - Piezo m the cell, enter arm The box
2.2 The BRIDGE DIAL technique
The lidar system principle of operation is simple: the backscatterers (molecules and aerosols) at the distance R from the system send back part of the laser pulse toward the active surface of the telescope. Consequently, the analysis of the detected signal as a function of t, time interval between emission and detection, allows one to study the chemico-physical properties of the atmosphere along the beam, since the simple relation between t and R is given by R=c∙t/2, where c is the speed of light.
In its round trip, the laser pulse is attenuated by the atmosphere. This phenomenon is quantified by the extinction coefficient of the probed air that is linked to the absorption of its gases. Usually their absorption bands are narrow and this property can be used to measure their concentration by DIAL: this system is based on the detection of backscattered photons from laser pulses transmitted to the atmosphere at two different wavelengths. At one wavelength (OFF), the light is almost only scattered by air molecules and aerosols, whereas at the other one (ON), it is also absorbed by the species under study. The difference between the two recorded signals is thus related to the gas concentration. In this way, it is possible to retrieve the concentration profile along the laser beam [5,6].
The Lambert-Boguert-Beer law relates the attenuation of light to the properties of the material through which the light is traveling. It stated that absorbance of a material sample is directly proportional to its thickness (path length). From this law it is possible to obtain the attenuation coefficient (α) of a material sample (e.g. the atmosphere):
∙ ∙ ∙ (1) with: : / : / : : ∙ :
Since the system works in DIAL mode (Differential Absorption Lidar), each profile is composed of two signals; they are acquired, respectively, at ON (CO2 maximum absoprtion) and OFF
wavelength (CO2 minimum absorption). Furthermore, from the fieldwork experience at Stromboli,
it is known that the laser beam was backscattered several times by the plume and by the rockface and the system has worked, for the first time, over long distances up to 3 Km. For these reasons, the lidar profile processing was splitted in two portions.
With regard to the Figure 4, it is possible to see an example of lidar profile from the position of the system until 2 Km. There are two visible peaks (particularly at OFF wavelength), the first one corresponds to and it is the signal due to the scattering, inside the laboratory, of some photons of the transmitted laser pulse (this peak gives the exact time of pulse transmission and is proportional to the transmitted energy, thus providing the signal normalization). Instead, the second peak corresponds to ; this is the lidar signal from the rockface of volcanic crater named “Pizzo”.
Moreover, in Figure 5, there is a zoom of the lidar profile number 8 (from 1500 to 3500 m) that belongs to the first loop of a morning scan acquired the 26 of June, 2015. In this picture, it is possible to distinguish two peaks referred to lidar signal from the rockface and, in particular, to the edges of Stromboli volcanic crater. They are named, respectively: “Pizzo” ( ) and “Vancori” ( ) by volcanologists.
Therefore, possible to From the e species (e.g Ave Ave with: ∆ first of all o evaluate th equation (3) g. carbon di erage CO2 c erage CO2 c / Lab Pea l, the two tr he ratio betw ), it is possib ioxide – CO concentratio concentratio , / Figure 4) C boratory ak ransmittanc ween these t ∙ ∙ ∙ ∙ ∙ ∙ ble to obtain O2) between on between on between ∙ Clean Data. Pa ces related t two elemen ∙ ∙ n the averag n the two pe Laboratory ∙∆ ∙ ∙ ln Pizzo and ∙∆ ∙ ∙ ln . articular of La 19 to ON/OFF nts: ∙ ∙ ∙ ge concentr eaks and in b y Peak and Vancori aboratory Pea 936 F signals are ∙ ∙ ∙ ∙ → ∙ ation of the both cases a Pizzo / ak and Pizzo. re computed ∙ ∙∆ e investigate already men Pizzo d, then it is (2) (3) ed chemical ntioned: (4A) (4B) s ) ) l ) )
After the s account a Corrected the portion find plume with Figure 6 smoothing spatial reso Signal – S(R n of the sign e. On this re h: ∗ / 6) Clean data Figu of the anal olution of (R)on/off for b nal included egard, see F with plume tr Pizzo ure 5) Clean D lyzed lidar 1.5 m), the both ON an d between igures 6 and / /
race after the s P Data. Pizzo, P profile (w e second st nd OFF clea 1500 and 3 d 7. From th ln / smoothing me Plume 831 Plume
Plume and Van
ith span eq tep consists an data. This 500 m, in w he equation / ∗ ∙ , con ethod (span=1 Vancori ncori qual to 13 – s of the eva s procedure which is hig below: / 13). Zoom betw – 19.5 m, aluation of e is carried o
gher the pro
min
ween 1500 an
taking into f the Range out only for obability to (5) / nd 3500 m o e r o )
Therefore, respectivel Using the higher than RCS, it is exceedance with: ∆ ∆ 1 ∑ can be ev ly, Pizzo an Range Cor n ON signal possible to e of in-plum ∙ ∆ ∙∑ , 1.5 Fig valuated th nd Vancori. rrected Sign l) and assum retrieve th me CO2 con ∆ , gure 7) RCS c he in-plume nal (5) relat ming that th e effective ncentration ( ∆ ∙ . , . computed from e CO2 con ted to the O he average C presence of (Figure 8). B 4 m 1500 to 350 ncentration OFF wavele CO2 concen f in-plume By means o . 0 m between th ength (beca ntration (4B CO2 concen of the equati he two pea ause the OF ) is proport ntration, kn ions (6) and aks named, FF signal is tional to the nown as the d (7): (6) (7) , s e e ) )
The last ste concentrati plume CO2 CO2 is clo “backgroun in-plume c For more d Fig ep is the nor ion. This co 2 concentrat ose to 0, so nd of plume carbon dioxi ∗ : details, see F F gure 8) Excee rmalization oefficient is tion trend f o it is reas e”). Throug ide concent Figure 9. Figure 9) Exce edance of in-p n of equation equal to 72 from 1974 t onable to a gh this step, ration: eedance of in-p plume CO2 con n (7), subtra 2.7 ppm and to 2188 m ( assume that , it is possib -plume CO2 co ncentration ev acting the b d can be eva (inside this r t from this ble to obtain ∗ oncentration a valuated for R ackground v aluated as th range the co portion ca n the correc 19 after correctio RCS. value of in-he average v oncentratio an be extrap ct value of 974 218 on. -plume CO2 value of in-n profile of polated the exceedance (8) 8 2 -f e e )
3. The e
In this sect of the inv discussed. 3.1 The ex The experi shown in F Sicily, con (ME), a vo The main g fumes, for For this pu 3 Km) and Thanks to any directi planes, the measureme transport r the carbon In-situ cali named “Ca point was Azimuth a earth softw main orog coordinate As it is sh vertical (E 317°). Figura 10) A main orograpxperimen
tion, both th vestigated a xperimenta imental cam Figure 10 -ntaining one olcanic arc n goal of the early warni urpose, BILL d probed it w two large e ion. With s e CO2 con ents, once rate (as deridioxide flu ibration of t asuzza” by particularly angles into r ware [8], it graphic obs s. hown in Fig Elevation an A – Map of E phic obstacles
ntal camp
he experime area, during al area mpaign of S A, Stromb e of the thre north of Sic field campa ing of erupt LI was mou with its laser elliptical mi such config ncentrations carried out ived from th ux. the system h volcanolog y useful du real Azimut has been po stacles in gure 10 – B ngles from Eolian Islands s.paign of St
ental set-up g the exper Stromboli ha boli is a sm ee active vo ily. aign was th tions. unted in a sm r beam (Fig rrors (Figur guration, an outside an t over a si he wind spe has been po gists, placed uring the da th angles. In ossible to d the investi B, BILLI D 14° to 24°) s – Detail of Stromboli
p of the BIL rimental ca as been carr mall island in olcanoes in he measurem mall truck p gure 10 - B) re 3 - F) the nd scanning nd inside t gnificant p eed at the p ossible thank d 930 m fro ata post-pro n fact, once determine b igated area DIAL syste ) and horiz Stromboli vol LLI DIAL sy ampaign ofried out fro n the Tyrrh n Italy. It is ment of carb positioned f , without an e instrumen g the plume the volcani part of the plume altitu ks to a fixed m the posit ocessing ste e georeferen oth the exa a and, ther em has scan zontal plane lcanic island. ystem and t f Stromboli m the 24 to henian Sea, one of the bon dioxide far from the
ny risks for nt field-of-v e in both h ic plume w plume, and ude), allowe d reference tion of the s ep, so as to ncing this p act position refore, thei nned the ar es (Azimuth B – Map of the weather i (24-29/06 o 29 of June off the nor e eight Aeol e contained e volcanic pl authorized view could b horizontal a were measu d upon sca ed one to re point: a litt system. Thi o convert ex point, thanks of the syst ir relative rea of inter h anlges fro the experimen r conditions /2015), are e, 2015. As rth coast of lian Islands in volcanic lume (up to personnel. be aimed to and vertical ured. These aling to the etrieve also tle building, is reference xperimental s to Google tem and the geographic rest in both om 227° to
ntal area and
s e s f s c o o l e e o , e l e e c h o d
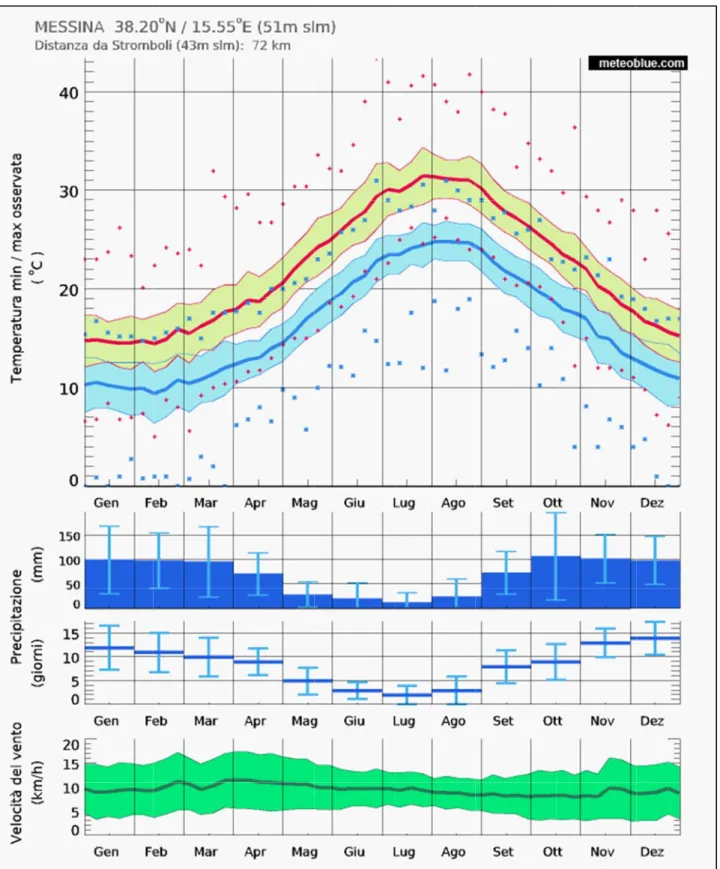
The most o correspond In particula angles – fr Moreover, than 17.6° 17° the sys 17.6° it ha traces. Thi These info measureme For more d mentioned Figure 11) S 3.2 Meteor This parag measureme As it is kn also lidar m In particula Tem Rel Pre Win Win On the bas experiment prove that was sunny absence of In Tables meteorolog of scan have ds to the sys
ar, the mos om 16.7° to during the , the system stem’s LOS as been poss s was true f ormations w ent sessions details, see . Sketch of thres rological p graph repo ent sessions nown, the w measuremen ar, here the mperature [ lative Humi ecipitations nd Speed [K nd Directio sis of field tal data with
the weathe and warm, f precipitatio 3 and 4 gical trends e been done stem’s LOS t common c o 20.66° (wi experimen m’s LOS ov S overtook P sible to dete for a fixed v were really u s. Figure 11 i sholds of eleva arameters orts the tre s (24-29/06/ weather con nts. attention is °C]; idity [%]; [mm]; Km/h]; on [°]. inspections h weather tr r conditions , with typica ons. This fa 4, are repo ; such as: e along the that interce configuratio ith each step ntal campaig vertook Van Pizzo’s side ect these tw value of Azi useful for t in which are ation angles. ends of th /2015) of th nditions stro s focused on , carried ou rends, extra s during the al values of act, has sign orted, resp vertical dire epted the ro on was: Azi p equal to Δ gn, it has b ncori’s peak e; finally, fo wo orograph imuth angle the analysis e reported t he main m he experime ongly influe n the analys ut during th apolated by e experimen f temperatur nificantly fav pectively, th ection, for a ockface of v imuth angle Δ=0.04°). een noticed k; instead, or Elevation hic obstacle e, equal to 2 s and proce the threshol meteorologi ental campai ence remote is of the fol he measurem several fore ntal campai re of the M vored in-sit he most i a fixed Azim olcanic crat e – 237.8° ( d that for el for Elevatio angles incl es and, in so 237.8°. ssing of dat ds of Eleva cal parame ign of Strom e sensing sy llowing para ment session ecast websit gn were fin editerranean u measurem important m muth angle. ter named “ (“Vancori”) levation ang on angles g luded betwe ome cases, ata acquired ation angles eters, conc mboli. ystems and ameters: ns, and cor tes [9], it is ne. In fact, t an climate a ments. monthly an . This angle “Vancori”. ); Elevation gles greater greater than een 17° and also plume d during the s previously cerning the d, therefore, relating the possible to the weather and the total nd weekly e n r n d e e y e , e o r l y
The The The The Moreover, extrapolate at Strombo The cross reported in Table 3) Me Table 4) Me e monthly/w e monthly/w e monthly/w e monthly/w in Tables 5 ed by a fore oli and Mess
comparison n Tables 3 a teorological p teorological p weekly aver weekly aver weekly aver weekly aver 5 and 6 ther ecast websit sina [10]. n analysis b and 4. parameters of parameters of rage temper rage relative rage precipi rage wind sp re is a comp te [9] and m etween diff f Stromboli isla f Stromboli isla rature; e humidity; itations; peed/directi parison betw monitored by ferent data h lands – month lands – weekly ion. ween annua y in-situ we has allowed ly trends, Jun y trends, June al (average) eather statio d to verify t e 2015. 2015. ) meteorolog ons of Italian the reliabilit gical trends n Air Force ty of trends s e s
Table 6) Off In conclus for a mode 28 of June However, signals wit ficial climate t ion, weathe erate influen e) and coul weather co th the data c trends – weath er condition nce of the w ld probably onditions al collected by her stations of ns did not s wind that ble y scatter vo llowed also y convention f Italian Air F significantly ew from no olcanic parti o a quite g nal in-situ in Force at Strom y affect BIL rthwest (in icles and fu good correla nstruments.
mboli and Mess
LLI system particular b umes in the ation betwe ssina. measureme between the e direction een the det
ents, except e 27 and the of the sea. tected lidar t e . r
4. Results and discussion
In this section, the results of the experimental campaign of Stromboli are reported and thoroughly analyzed.
Data processing and interpretation is the last step of work and consists of the application of a newly designed DIAL method (for more details, see chapter 2.2). This is due to the intensity of lidar profiles, detected during the field campaign, was lower than common signals previously studied. For this reason it was impossible to use the classical DIAL method.
However, data processing can be divided into three phases:
1) Data Classification: consists in the rearrangement of raw lidar data and identification of plume signals;
2) Data Processing: elaborations of lidar data with the “BRIDGE DIAL Technique”; 3) Graphic Presentation: productions of plots for data analysis and post processing steps. On this regard, see Figure 12 (A-B).
As already stressed, the main goal of the work was the measurement of CO2 in volcanic plumes for
early warning of eruptions. For this purpose, Matlab scripts are specifically developed for data processing and graphic presentation of both CO2 concentration profiles (real time application) and
A)
B)
Figure 12) A
Moreover, the attention was focused on the experimental area (Figure 10 – B) and, therefore, the portion of lidar signals included between 1500 to 3500 m from the position of the system.
In particular, between Pizzo and Vancori rockfaces was higher the probability to find plume traces. In fact, these traces have never been detected before the position of Pizzo’s side (≈2 Km from the position of BILLI) and rarely after the position of Vancori’s peak (farther than 3 Km from the position of the system). For further details see Sections 4.3 and 4.5.
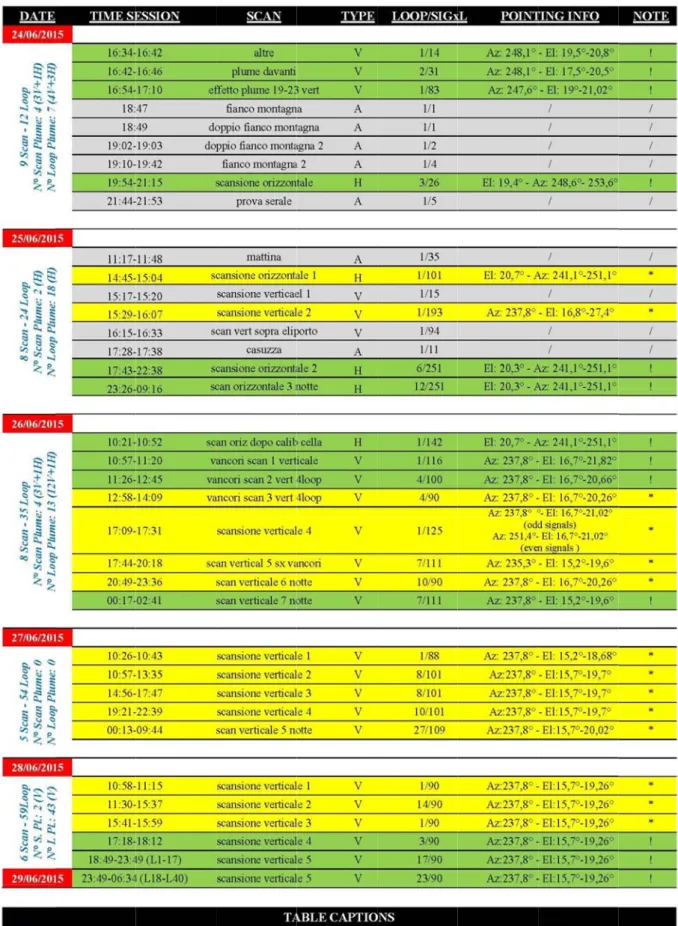
Furthermore, in order to simplify the reading, results are classified using the order reported in Table 7. The most important cases have been highlighted with different colors. For example, green boxes with exclamation mark indicate the presence of clear plume traces, instead yellow boxes with asterisk indicate the presence of background noise (with potentially weak plume traces). Finally, grey boxes with slash indicate that nothing relevant has been detected.
As you can see in Table 7, each daytime measurement session is composed of several scans, each scan is composed of one or more loop and each loop is composed fixed number of lidar signals. Please note that only figures and maps that show clear plume traces have been reported in the following chapters.
Preliminar CO2 conce of range [m of range [m figure is re colors are instead, blu Moreover, referred to respectivel 4.1 24/06/2 During the concentrati “A “P “E p. “S Fi Instead, in For further “Altre” (A) Figure 13) Vertical sca range [m], the map. A humidity (th been increa peak. NB) LOS of ry notes for entration dis m] – X axis m] – Y axis eferred to th used to ind ue color usu each figur each meas ly, vertical o 2015 e measurem ion traces h Altre” – ver Plume davan Effetto plum m. – Figure Scansione O igure 17. other scans r details abo A – Examp an in Cartes elevation an reasonable hus, CO2 mol ased), combin f the system w Elevation: 19 r the interpr spersion ma s, time [s] an s, time [°] a he CO2 con dicate a str ually repres re caption urement ses or horizonta ment session have been de rtical scan, d nti” – vertic me 19-23 v e 16. Orizzontale” s nothing re out the main
ple of lidar sian coordin ngle [°] and explanation lecules have ned with the was pointed .5° retation of C aps reported nd elevation nd azimuth ncentration ong variatio ents the bac reports: the ssion (local al scan. n of the 24 etected in se data acquire cal scan, dat erticale” – ” – horizont levant has b n characteris profile cont ates of the e time [s]. It i of the high been conden effect of the on the right s CO2 concen d in this stud n angle [°] h angle [°] – (expressed on of the e ckground no e carbon d l civil time) of June, 2 everal scans ed from 04:3 ta acquired vertical sca tal scan, da been detecte stics of this (B) taining CO2 exceedance is possible to density of C nsed into the e wind that h side of Pizzo ntration sca dy are referr – Y axis) a – X axis). T in term of exceedance oise. ioxide unit ) and a fixed 2015; a sign s. In particu 34 p.m. to 0 from 04:42 an, data ac ata acquired ed. session, ref plume peak of in-plume o see plume CO2 spots cou e atmosphere have scattere o. an figures red to vertic nd horizont The color ba [ppm]). Re of in-plum of measur d azimuth o nificant amo ular, the atte
04:42 p.m. – 2 p.m. to 04: quired from from 07:54 ference is m ks between 2 CO2 concen traces in the uld be due to e and their sc d the plume
cal scan (as tal scan (as ar on the rig ed, orange a me CO2 con rement, the or elevation ount of in-p ention is foc – Figure 14 :46 p.m. – F m 04:54 p.m 4 p.m. to 09 made to Tab 2.5 Km and ntration as a e bottom rig o an increas cattering pro traces next a function a function ght of each and yellow centration; e time slot n angle for, plume CO2 cused on: . Figure 15. m. to 05:10 9:15 p.m. – ble 7. d 3 Km. B – a function of ght corner of se in relative operties have to Vancori’s 2 0 – – f f e e s
“Plume da (A) (A) Figure 14) (L1) and 2 ( exceedance are related, side of the m of time and condensed effect of the peak. NB) LOS of E L1 L2 avanti” A – Two ex (L2) and acq of in-plume respectively map. A reaso d elevation, into the atm e wind that f the system w Elevation: 19.7 xample of lid quired at diff CO2 concen y to Loop1 (L onable expla could be du mosphere an have scatter was pointed Elevation: 7° dar profile c ferent elevati ntration as a f L1) and 2 (L nation of the ue to an incr d their scatt red the plum on the right s : 17.7° (B) (B) containing C ion angles. B function of r L2). It is poss e high densit rease in rel tering prope me traces fro side of Pizzo L1 L2 CO2 plume p B – Vertical s range [m], e sible to see p ty of CO2 spo lative humid erties have b om the rockfa o. peaks related scans in Cart levation ang plume traces f
ots and their ity (thus, CO been increas face of Pizzo
d, respective rtesian coord gle [°] and tim
from the lef r movement a O2 molecule sed), combin o (left side) t ly, to Loop1 dinates of the me [s]. They ft to the right as a function s have been ned with the to Vancori’s 1 e y t n n e s
“Effetto pl (A) (B) lume 19-23 Elevat verticale” ion: 19.7° Figure A – Ex CO2 pl Km. B – Ver of the concent elevatio possible right c explana could b humidit condens scatteri combin have sc Vancor NB) LO right sid 15) xample of l lume peaks rtical scan i e exceedanc tration as a on angle [° e to see plum corner of th ation of the h be due to a ty (thus, CO sed into the ing propertie ed with the cattered the i’s peak. OS of the sys de of Pizzo. lidar profile between 2.5 in Cartesian ce of in-p function of °] and time me traces in he map. A high density o an increase O2 molecules e atmospher es have been effect of th e plume tra stem was po e containing 5 Km and 3 coordinates plume CO2 f range [m], e [s]. It is n the bottom reasonable of CO2 spots in relative s have been re and their n increased), he wind that aces next to ointed on the g 3 s 2 s m e s e n r t o e
“Scansion (A) (A) (A) Figure 16) (L1), 2 (L2 coordinates and time [s traces at the movement a molecules h combined w NB) LOS of e Orizzonta A – Three e 2) and 3 (L s of the excee s]. They are e top left cor as a function have been co with the effec
f the system w Azimuth: Azimuth: 2 L3 L2 L1 ale” example of li 3) and acqu edance of in related, resp rner of the m n of time an ondensed int t of the wind was pointed b Azim 249.6° 249.0° idar profile c uired at diff -plume CO2 spectively to map. A reaso nd azimuth c to the atmosp d that have sc between the muth: 248.6° (B) (B) (B) containing C fferent azimu concentratio Loop1 (L1) onable explan could be due sphere and th cattered the p right side of L1 L2 L3 CO2 plume pe uth angles. B on as a func , 2 (L2) and nation of the e to an incre heir scatteri plume traces f Pizzo and C eaks referred B – Horizon tion of range d 3 (L3). It i e high density ease in relat ng propertie s along the ri Casuzza. d, respective ntal scans i e [m], azimu is possible t ty of CO2 spo tive humidity es have been ight side of P ely, to Loop1 in Cartesian uth angle [°] to see plume ots and their
y (thus, CO2 n increased), Pizzo’s peak. 1 n ] e r 2
4.2 25/06/2015
During the measurement session of the 25 of June, 2015; a significant amount of in-plume CO2
concentration traces have been detected in two scans. In particular, the attention is focused on: “Scansione Orizzontale 2” – horizontal scan, data acquired from 05:43 p.m. to 10:38 p.m.
– Figure 18.
“Scansione Orizzontale 3 notte” – horizontal scan, data acquired from 11:26 p.m. to 09:15 a.m. – Figure 19.
Whereas in “Scansione Orizzontale 1” and also in “Scansione Verticale 2”, background noise (with potentially weak plume traces) has been detected.
“Scansion
Figure 17)
the time evo coordinates) 244.5°-247° Whereas, on function of wind that ha NB) LOS of L1 L3 L5 e Orizzonta
The six horiz olution of the s) it is possib °, distance of n the right s time and az ave scattered f the system w PI P P 1 3 5 ale 2” zontal loops e exceedance ble to see the of 2300 m fro side of this o imuth angles d the plume t was pointed b ZZO PIZZO PIZZO (L1….L6) of e of in-plume e rockface of om the system orographic o s. A reasona traces from P between the of the scan ha e CO2 concen f Pizzo interc m), as indica obstacle it is able explana Pizzo to Casu right side of ave been chr ntration. In t cepted by the ated by the r s clear the v tion of this f uzza. f Vancori and L2 L4 L6 onological r he middle of e LOS of the red spot in th ariations of fact could be d Casuzza. PIZZO PIZZO PIZZO rearranged s f each scan ( system (azim he middle of f CO2 concen e due to the o as to show (in Cartesian muth angles: f each figure. ntration as a effect of the w n : a e
“Scansion L1 L3 L5 e Orizzonta P P PIZ 1 3 5 ale 3 notte” PIZZO PIZZO ZZO ” L2 L4 L6 PIZZO PIZZO PIZZO
Figure 18)
show the tim Cartesian c (azimuth an of each fig concentratio Pizzo is not these partic the increase their scatter plume trace of Vancori a L7 L9 L1 The twelve h me evolution coordinates) ngles: 244.5° gure. Wherea on as a func t visible, par cular cases). e in relative ring properti es along the and Casuzza PIZ PIZ PIZ 7 9 11 horizontal lo n of the exce it is possib °-247°, distan as, on the ri ction of time rtially or en This is part humidity (th ies have been right side of a. ZZO ZZO ZZO oops (L1….L eedance of i ble to see th nce of 2300 m ight side of e and azimut tirely covere ticularly true herefore, CO n increased) f Pizzo’s pea L12) of the sc in-plume CO he rockface m from the sy f this orograp th. It is impo ed by the plu e during the O2 molecules , combined w ak. NB) LOS
can have bee
O2 concentra of Pizzo int ystem), as in aphic obstacl ortant to not ume (located nighttime se s have been with the effec of the system L8 L10 L12 en chronolog tion. In the tercepted by ndicated by th le it is clear e that in som d in the bott ession and c condensed i ct of the wind m was pointe PIZZO PIZZO PIZZO gical rearran middle of ea y the LOS of he red spot i r the variat me maps the tom side of t could be prob
into the atm d that have s ed between th
nged so as to ach scan (in f the system in the middle ions of CO2 e rockface of the figure in bably due to osphere and scattered the he right side o n m e 2 f n o d e e
4.3 26/06/2015
During the measurement session of the 26 of June, 2015; a significant amount of in-plume CO2
concentration traces have been detected in several scans. In particular, the attention is focused on: “Scansione Orizzontale dopo la calibrazione della cella” – horizontal scan, data acquired
from 10:21 a.m. to 10:52 a.m. – Figure 20.
“Scansione Verticale 1 Vancori” – vertical scan, data acquired from 10:57 a.m. to 11:20 a.m. – Figure 21.
“Scansione Verticale 2 Vancori 4loop” – vertical scan, data acquired from 11:26 a.m. to 00:45 p.m. – Figure 22.
“Scansione Verticale 7 notte” – vertical scan, data acquired from 00:17 a.m. to 02:41 a.m. – Figure 24.
Except for “Scansione Verticale 4”, in which the rockface of Pizzo next to Casuzza has been detected (this fact is true only for even lidar signals), other scans showed only the background noise. On this regard, see Figure 23.
“Scansion (A) (B) Figure 19) plume CO2 coordinates [°] and tim reasonable due to the ef NB) LOS of e Orizzonta A – Examp concentrati s - D of the e me [s]. It is p explanation effect of the w f the system w ale dopo la le of lidar p on profile r exceedance o possible to s of the disper wind that hav
was pointed b Azimut calibrazion rofile contai related to Fi of in-plume C see plume tr rsion of CO2 ve scattered t between the h: 247.74° ne della cell (C) (D) ining CO2 pl igure 20 - A CO2 concent races from th 2 spots (as a f the plume tra right side of la” lume peaks b A. Horizonta ration as a f he left side function of a aces from the f Pizzo and C between 2 K al scan in C function of ra to the bottom azimuth angl e rockface of Casuzza. Km and 2.5 K Cartesian - C ange [m], az m middle of le and the tim f Pizzo to Ca Km. B – In-C and polar zimuth angle f the map. A me) could be asuzza. -r e A e
“Scansion (A) (B) Figure 20) plume CO2 coordinates [°] and tim reasonable be due to th NB) LOS of e Verticale A – Examp 2 concentrati s - D of the ex me [s]. It is explanation he effect of th f the system w Elev 1 Vancori” le of lidar p ion profile r exceedance of possible to of the dispe he wind that h was pointed vation: 19.26° ” rofile contai related to F f in-plume C see a time-ersion of CO have scattere to Vancori (r (C (D ining CO2 pl Figure 21 -CO2 concentr -resolved plu O2 spots (as a ed the plume (rockface). C) D) lume peaks b A. Vertical ration as a fu ume evolutio a function of e traces next between 2.5 scan in Ca unction of ran om on the ri f elevation an to Vancori’s Km and 3 K artesian - C ange [m], ele ight side of ngle and the s peak. Km. B – In-C and polar vation angle f the map. A e time) could -r e A d
“Scansione Verticale (A) (B) (C) L1 2 Vancori PIZZO 4loop” Elevaation: 16.98° PLUME VAANCORI
Figure 21) plume CO2 coordinates [°] and time reasonable be due to th NB) LOS of (E) (G) L2 L4 (D) A – Examp 2 concentrati s - D of the ex e [s]. It is p explanation he effect of th f the system w le of lidar p ion profile r exceedance of ossible to se of the dispe he wind that h was pointed rofile contai related to F f in-plume C ee a complet ersion of CO have scattere to Vancori (r ining CO2 pl Figure 22 -CO2 concentr te time-resolv O2 spots (as a ed these plum (rockface). (F) Fig coo con elev refe “Sc pos mid plum the corn infl abo exp func due the p NB) (roc lume peaks b A. Vertical ration as a fu ved plume ev a function of me traces up ure 22) E, F ordinates of ncentration vation angle erred to t cansione Ve sible to see p ddle and on me traces ar Loop1 of th ner of each uence of th ove the roc
lanation of ction of elev e to the effec plume traces ) LOS of th ckface). L3 between 2 K scan in Ca unction of ran volution in t f elevation an in the atmos F, G - Vertic the exceeda as a func e [°] and tim he specific rticale 2 V plume traces the right sid re less signif he same sca map it is p he passage ckface of P the dispersio ation angle a ct of the win s up in the at e system wa Km and 2.7 K artesian - C ange [m], ele the middle of ngle and the sphere. cal scans in ance of in-p ction of ra ime [s]. Eac c Loop (L Vancori 4loo es, in particu de of each m ificant with an. In the b possible to se of the syste Pizzo. A r on of CO2 sp and the time nd that have tmosphere. as pointed t Km. B – In-C and polar vation angle f the map. A e time) could Cartesian plume CO2 ange [m], ch map is L1,2,3) of op”. It is ular, in the map. These respect to bottom left ee a weak em’s LOS reasonable spots (as a e) could be e scattered to Vancori -r e A d
“Scansion Figure 23) function of Casuzza, in in the bottom Note that th detected onl NB) LOS of “Scansion L1 e Verticale Vertical sca f range [m], ntercepted by m left corner his map rega ly the backgr f the system w e Verticale 4” an in Cartes elevation an y the LOS of r of the map. ards only eve
round noise. was pointed 7 notte” even signals PIZZO sian coordin ngle [°] and f the system ( Above this o en lidar sign to Casuzza ( ates of the e d time [s]. It (elevation an orographic o nals. Wherea (on the right
exceedance o is possible ngles: 16.7°-obstacle is al as in the map side of Pizzo L2 of in-plume to see the ro 21.02°), as i lso visible a w p concerning o rockface). CO2 concen rockface of P indicated by weak trace o g odd signals ntration as a Pizzo next to the red spot of plume. s it has been a o t n
Figure 24) the time ev Cartesian c elevation. I position. As and could condensed effect of the NB) LOS of L7 L3 L5 The seven ve volution of t coordinates) It is importa s already sho be probably into the atm e wind that ha f the system w ertical loops the exceedan it is possibl ant to note own in Figu y due to the mosphere an ave scattered was pointed (L1….L7) of nce of in-plu le to see the that plume res 18 and 1 e increase i d their scatt d the plume t to Vancori (r of the scan ha ume CO2 co e variations traces are e 19, this fact in relative h tering prope traces above (rockface). ave been chr oncentration. of CO2 conc extremely de is particular humidity (th erties have b e the rockface L4 L6 onological r . On the lef centration as ense and con
rly true durin herefore, CO been increas e of Pizzo. rearranged s ft side of ea s a function ontinuously c ing the night
O2 molecules
sed), combin
o as to show ach scan (in of time and change their ttime session s have been ned with the w n d r n n e
As already position of Figures (25 examples o Moreover, of in-plum essential fe In fact, som than the thr (A) 26/ (B) 26/ y mentioned f Vancori’s 5 – A, B), r of this type. in Figure 2 me CO2 con eature of thi me CO2 plu reshold of V /06/2015 – “ /06/2015 – “ d, during th peak (farth related to L 25 – C is re ncentration is scan, rela ume traces Vancori’s p “Scansione “Scansione he experime her than 3 K Loop1 of “S ported the v as a functio ated to Loop are clearly eak. e Verticale e Verticale ental campa Km) was ex Scansione V vertical scan on of range p1, is the ex y visible bey 7 notte” – L 7 notte” – L aign the de xtremely ra Verticale 7 n n in Cartesi e [m], eleva xtension of r yond 3 Km Loop1/Sign Loop1/Sign PLUME etection of p are. Nonethe notte”, ther ian coordina ation angle range betwe m and for el nal64. El:17 nal65. El:17 PLUME plume trace eless, in the re are some ates of the [°] and tim een 2 Km an levation ang 7.72° - Az:2 7.76° - Az:2 es after the e following significant exceedance me [s]. The nd 3.5 Km. gles greater 237.8° 237.8° e g t e e r
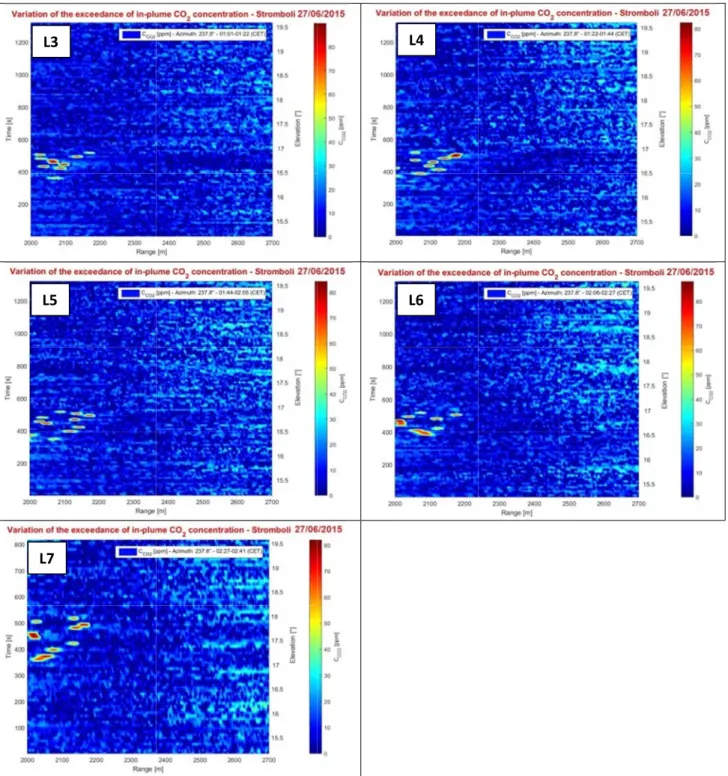
(C) 26/ Figure 25) 17.72°, Azim B – Exampl angle: 237. in Cartesian verticale 7 traces of in threshold of probably du with the eff Vancori’s p Note that th NB) LOS of 4.4 27/06/2 During the traces has b For this rea For further 4.5 28/06/2 During the concentrati “S Fi “S Fi Instead, in For further /06/2015 – “ A – Examp muth angle: le of Lidar p 8°. It is poss n coordinate notte” as a n-plume CO2 f Vancori’s p ue to the inc ffect of the w peak. he dark blue p f the system w 2015 e measurem been detect ason, the di r details abo 2015 e measurem ion traces h Scansione V igure 26. Scansione V igure 27 (fir other scans r details abo “Scansione Variati ple of Lidar 237.8°. It is profile n°65, sible to see a es of the exc function of concentratio peak. As alre rease in rela wind, has p portion indic was pointed ment session ed in every spersion ma out the main
ment session have been de Verticale 4” Verticale 5” rst part). s the backgr out the main
e Verticale ion of the exc
r profile n°6 possible to Loop1, “Sca a triple CO2 eedance of i range [m], on on the lef eady stressed ative humidit probably sca cate an interv to Vancori (r n of the 27 scan. aps of in-plu n characteris n of the 28 etected in se ” – vertical ” – vertical round noise n characteris 7 notte” – L ceedance of in 64, Loop1, “ see a double ansione Vert in-plume pe in-plume CO elevation an eft and beyon d in Figure 2 ty during the attered the p rval without m (rockface). of June, 20 ume CO2 co stics of this of June, 2 everal scans l scan, data l scan, data e has been d stics of this Loop1. n-plume CO2 “Scansione V e CO2 in-plu ticale 7 notte eak between O2 concentra ngle [°] and nd 2.9 Km, f 24, the high d e nighttime s plume traces measuremen 015; the bac oncentration session, ref 2015; a sign s. In particu a acquired f a acquired f detected. session, ref concentratio Verticale 7 n ume peak bet
e”, Elevation 3 Km and 3. tion related d time [s]. It for elevation density of CO session. This s from the s ts. ckground n n aren’t sho ference is m nificant amo ular, the atte
from 05:18 from 06:49 ference is m on notte”, Elev tween 3 Km n angle: 17.7 .2 Km. C - V to Loop1 of t is possible angles grea O2 plume tra s phenomeno side of Pizzo noise with w own in this r made to Tab ount of in-p ention is foc p.m. to 06 p.m. to 11 made to Tab ation angle: and 3.2 Km. 76°, Azimuth Vertical scan f “Scansione to see some ater than the ces could be on, combined o above the weak plume report. ble 7. plume CO2 cused on: 6:12 p.m. – 1:49 p.m. – ble 7. : h n e e e e d e e 2 – –
“Scansion (A) (A) (A) Figure 26) (L1), 2 (L2) chronologic These vertic L1 L2 L3 e Verticale A – Three e ) and 3 (L3) cal rearrang cal scans, exp
4” example of li and acquired ged so as to s xpressed in C Elevatio Elevation Elevatio idar profile c d at differen how the time Cartesian coo n: 16.5° : 16.74° n: 16.9° (B) (B) (B) containing C t elevation a e evolution of ordinates as CO2 plume pe angles. B – T of the exceed a function of L1 L2 L3 eaks referred The three loop
ance of in-pl of range [m],
d, respective ops of the sca
lume CO2 co , elevation a ely, to Loop1 an have been oncentration. ngle [°] and 1 n d
time [s], ar bottom left c as a functio have been c with the effe NB) LOS of “Scansion L1 L3 L5 re related, re corner of the on of time an condensed in fect of the win f the system w ne Verticale
espectively, to e map. A rea
nd elevation nto the atmo nd that have was pointed e 5” (1-17 L o Loop1 (L1) asonable expl n could be du osphere and scattered the to Vancori (r Loop) 1), 2 (L2) and lanation of t ue to an inc their scatter e plume trac (rockface). d 3 (L3). It i the high dens crease in rela
ring propert ces above the
L2 L4 L6 is possible to sity of CO2 sp ative humidi ties have bee e rockface of
o see plume pots and the ity (thus, CO en increased f Pizzo. traces in the ir movement O2 molecules d), combined e t s d
L7 L9 L111 L8 L10 L12
Figure 27)
show the tim the upper r concentratio corner are e side are less is particula humidity (th have been i rockface of NB) LOS of L13 L15 L17 The seventee me evolution ride side of on as a func extremely de s dense but m arly true dur herefore, CO increased), c f Pizzo and th f the system w en vertical lo n of the exce f each scan ction of time ense and con
more spread ring the nig O2 molecules combined wi hen up in the was pointed oops (L1….L edance of in (in Cartesia and elevatio ntinuously ch d than the pre ghttime sessi
have been co ith the effect
atmosphere to Vancori (r L17) of the sc n-plume CO2 an coordinat on. It is impo hange their p evious ones. ion and cou
ondensed int t of the wind
.
(rockface).
can have bee 2 concentrati tes) it is pos ortant to note position; inst As already s ld be proba to the atmosp d that have s L14 L16 en chronolog on. In the bo ssible to see e that plume tead plume tr shown in Fig ably due to phere and th cattered the gical rearran ottom left co e the variat traces in the traces on the gures 18 and the increase heir scatterin e plume trace nged so as to orner and on ions of CO2 e bottom left e upper right d 24 this fact e in relative ng properties es above the o n 2 ft t t e s e
As already plume trac following significant Moreover, of in-plum essential fe In fact, som than the thr (A) 28/ (B) 28/ y shown in ces have be Figures (2 examples o in Figure 2 me CO2 con eature of thi me CO2 plu reshold of V /06/2015 – “ /06/2015 – “ Section 4. een detected 8 – A, B) of this type. 28 – C is re ncentration is scan, rela ume traces Vancori’s p “Scansione “Scansione 3, also dur d after the p , related to ported the v as a functio ated to Loop are clearly eak. e Verticale e Verticale ring the me position of o Loop6 o vertical scan on of range p6, is the ex y visible bey 5” – Loop6 5” – Loop6 easurement Vancori’s f “Scansion n in Cartesi e [m], eleva xtension of r yond 3 Km 6/Signal53. 6/Signal61. PLUME session of peak (farth ne Vertical ian coordina ation angle range betwe m and for el El:17.78° -El:18.1° - A PLUM the 28 of her than 3 K le 5”, there ates of the [°] and tim een 2 Km an levation ang - Az:237.8° Az:237.8° ME June, some Km). In the e are some exceedance me [s]. The nd 3.5 Km. gles greater ° e e e e e r
![Table 2) Wavelengths, Wavenumbers and CO 2 Absorption Coefficients calculated at STP (T=296K, P=1atm) [5].](https://thumb-eu.123doks.com/thumbv2/123dokorg/5597815.67573/11.892.113.780.170.320/table-wavelengths-wavenumbers-absorption-coefficients-calculated-stp-atm.webp)

![Figure 21) plume CO 2 coordinates [°] and time reasonable be due to th NB) LOS of (E) (G) L2 L4 (D) A – Examp2 concentrati s - D of the exe [s]](https://thumb-eu.123doks.com/thumbv2/123dokorg/5597815.67573/40.892.162.732.101.318/figure-plume-coordinates-time-reasonable-los-examp-concentrati.webp)