International Journal of Business and Management; Vol. 12, No. 10; 2017 ISSN 1833-3850 E-ISSN 1833-8119 Published by Canadian Center of Science and Education
The Relationships between Companies and Bank System: An Analysis
of Italian Context
Elisa Giacosa1 & Alberto Mazzoleni2 1 Department of Management, University of Turin, Italy
2 Department of Economics&Management, University of Brescia, Italy
Correspondence: Elisa Giacosa, Department of Management, University of Turin, Turin, Italy. Tel: 39-011-670-6013. E-mail: [email protected]
Received: June 21, 2017 Accepted: August 30, 2017 Online Published: September 9, 2017 doi:10.5539/ijbm.v12n10p1 URL: https://doi.org/10.5539/ijbm.v12n10p1
Abstract
The purpose of our research is to propose to model which could suggest to Italian small and medium companies the best appropriate funding resources to their economic and financial situation. The framework of this paper is represented by Giacosa and Mazzoleni (2016), in which a model classifies the companies into six groups according to different elements, such as attitude to repay financial debts, company’s growth, and profitability. The sample is composed of 39.400 Italian companies. In particular, companies could be divided in these categories: i) star companies; ii) companies at the beginning of decline; and iii) companies in crisis.
It emerged that, in a medium-term vision, it’s necessary to change the management behavior and to try to reach economic fundamentals expected by the bank system, while in the short-term vision the companies have to learn how to use a non-bank financial instruments.
Keywords: funding resources, mini-bonds, alternative financial instruments, small and medium companies,
Italian context
1. Introduction
The financial structure choices are influenced by both objective and subjective decision-making elements (Giacosa, 2012a and 2012b). Objective elements are linked to the company's needs, as long-term investments must be covered by stable financial sources (for instance, equity or medium-long-term debt), and working capital investments have to be covered by short-term funding sources. On the contrary, the subjective element is linked to the providers of financial resources, which have to be coherent in terms of quantity and costs of enterprises’ needs.
Limiting the analysis to funding sources different from equity from current shareholders and trade payables, the parties to whom the companies can recourse are represented by the bank or financial entities different from bank. In Italian banking context, the majority of companies is unprepared to face up the limitation of funding sources, unlike German ones (Mazzoleni, 2016). Therefore, Italian companies have to force a cultural change process, both for developing managerial quality and adapting their economic and financial ratios to market requirements. The purpose of our research is to propose to model which could suggest to Italian small and medium companies the best appropriate funding resources to their economic and financial situation. The motivation of the research is linked to the current scenario, which is characterized by both banking system’s disengagement, cultural companies’ unpreparedness and their economic and financial unsuitability, along with some legislative actions lagging behind the companies’ needs.
Our framework is represented by Giacosa and Mazzoleni (2016), in which a model classifies the companies into six groups according to different elements, such as attitude to repay financial debts, company’s growth, and profitability. In addition, the current research is a development of Giacosa, Mazzoleni, & Rossi (2006), in which they proposed suitable funding methods for Italian and German medium-sized companies by considering their attitude to repay financial debts, the company’s growth, and profitability.
situation and to identify the appropriate funding method should be interested for sustaining its growth and survival.
The paper’s structure is the following. The analysis of the literature concerning to financing policy of small and medium-sized companies is focused on the second paragraph, followed by the illustration of the research method. Paragraph four illustrated and discusses the findings, while conclusions, implications and limitations are contained in the last paragraph.
2. Literature Review
Economic and financial aspects (Giunta, 2007; Value, 2001) along with elements concerning company’s growth (Canals, 2001; Hart & Mellons, 1970; Goold, 1999; Grandinetti & Nassimbeni, 2007; Potito, 2013) permit to evaluate and understand the company’s situations both in short and medium-long term. Several researchers focused on the definition of the company’s financial structure, as the topic has an important role in terms of business management point of view. Topics connected with necessity of self-financing, balance between financial independence and suitable agreements with the third parties were always a subject of various publications. Several interdependent factors impact the company’s situation (Ferrero et al., 2006; Giacosa, 2015), although the literature identified some limitations in their statements (Brealey & Myers, 1988; Ingram et al., 2002; Lombardi Stocchetti, 2013). In particular, within the literature review, we considered two research branches according to our research goal (Fellnhofer, 2015; Mahérault, 2000; Herrera & Minetti, 2007): i) the first branch is focused on the company’s financial structure and the most appropriate relation between investments and funding; ii) the second one is related to traditional and alternative funding instruments, which could be most appropriate for the specific company’s situation.
In terms of the first branch, the dilemma connected with correct choosing of sources of funding has been discussed in numerous publications (Dallocchio et al., 2011; Galbiati, 1999; La Rocca, 2007; Venanzi, 2003; Zazzaro, 2008) as it is considered to be an accelerator of the company’s growth and helps to meet its financial requirements (Giacosa & Guelfi, 2003; Giacosa, 2015; Fazzari et al., 1988; Ferri & Messori, 2000; Ferri & Rotondi, 2006; Lang et al., 1996; Machauer & Weber, 2000; Oliveira & Fortunato, 2006). Obtained funsing sources should be therefore connected also with appropriate investments (Bertini, 1991; Penrose, 1959).
According to the second branch, a variety of contributions exist, several researchers focused on this topic, especially in terms of different funding instruments’ advantages and disadvantages (Venanzi, 1999; Marchi & Quagli, 1991), also in terms of Italian context (Castronuovo, 2008; Dainelli & Giunta, 2010; Meles, 2007; Venanzi, 2003) and referring to SMEs (Giacosa, 2015; Giunta, 2005; Pezzini & Di Cesare, 2003; Unioncamere, 2007). Some part of the present contribution is focused on availability of non-bank funding instruments. As one of such instruments is considered also a listing on a financial market (Anderson & Reeb, 2003; Belkhir Boujelbene et al., 2011; Rossi, 2015), although it is usually considered as less enthusiastic solution for financing the company’s activities (Bracci, 2007; Gualandri & Schwizer, 2008; Mulkay & Sassenou, 1995; Osteryoung et al., 1992) seeing that it leads to reduce the control over the company (Gallucci et al., 2012).
As literature has not deepened the problem on non-bank funding instruments for Italian small and medium-sized companies, current research tries to fulfil this gap and it has these scientific contributions: i) the introduction of some alternative non-bank funding instruments permits the company’s growth, also impacting on corporate culture and business management; ii) sometimes, the recourse of innovative and alternative funding instruments facilitates the company to reach its expectations. Researchers didn’t focus on the evolution of the SMEs’ conditions in terms of profitability, growth and financial debt repayment. Therefore, our research encourages companies to improve their economic and financial situation, also thanks to the implications of our paper.
3. Methodology 3.1 The Sample
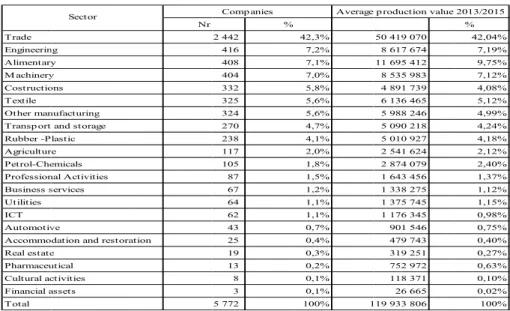
The sample is composed of 39.400 Italian companies. In particular, companies could be divided in these categories: i) star companies; ii) companies at the beginning of decline; and iii) companies in crisis. Star companies of the sample are illustrated in the following table, in terms of clusters of sales revenues and number of companies. Each cluster presents the following ratios: EBITDA, CAGR production value, debt/equity ratio, and relationship between financial debt and EBITDA (Table 1).
ijbm.ccsen Table 1. T Star comp Table 2. S Compani Table 3. T The comp value (Ta net.org
The star comp
panies belong Star companie es at the begin The companie panies at the b able 4). T M E O C R T P A I T P A B A U P R A F C n T Int panies in 2015 to different ec es and their be nning of declin s at the beginn beginning of d Trade M achinery Engineering Other manufacturing Costructions Rubber -Plastic Textile Professional Activiti Alimentary ICT
Transport and storag Petrol-Chemicals Automotive Business services Accommodation and Utilities Pharmaceutical Real estate Agriculture Financial assets Cultural activities n.a. Total Sector ternational Jour conomic secto longing to diff ne are describ ning of decline decline belong N g es ge restoration rnal of Business
ors, with certa fferent econom ed in the table e in 2015 g to different Nr % 1 115 16,6% 1 039 15,4% 718 10,7% 479 7,1% 437 6,5% 390 5,8% 338 5,0% 319 4,7% 317 4,7% 268 4,0% 235 3,5% 207 3,1% 154 2,3% 151 2,2% 137 2,0% 116 1,7% 86 1,3% 72 1,1% 61 0,9% 47 0,7% 43 0,6% 2 0,0% 6 731 100% Companies s and Managem in average pro mic sectors e below (Table economic sec % 21 717 % 22 164 % 12 370 % 8 504 % 7 273 % 4 347 % 7 336 % 7 181 % 4 770 % 4 226 % 3 981 % 5 545 % 3 242 % 2 709 % 2 193 % 1 627 % 4 352 % 769 % 1 034 % 526 % 543 % 5 % 126 423 Average product ment oduction value e 3).
ctors, with cert
% 7 483 17,18 4 841 17,53 0 066 9,78 4 844 6,73 3 961 5,75 7 148 3,44 6 173 5,80 1 970 5,68 0 054 3,77 6 355 3,34 1 522 3,15 5 872 4,39 2 357 2,56 9 452 2,14 3 771 1,74 7 421 1,29 2 140 3,44 9 218 0,61 4 246 0,82 6 319 0,42 3 305 0,43 5 299 0,00 3 818 100 ion value 2013/2015 Vol. 12, N e (Table 2). rtain average p % % % % % % % % % % % % % % % % % % % % % % % No. 10; 2017 production
Table 4. T Compani Table 5. T The comp Table 6. T T A C E M T O T R A P P B R A U I A F P C n T The companie es in crisis are The companie panies in crisis The companie Trade Engineerin Alimentary M achinery Costructio Textile Other man Transp ort Rubber -P Agricultur Petrol-Che Profession Business s Utilities ICT Automotiv Accommo Real estate Pharmaceu Cultural ac Financial a Total Trade Alimentary Costructions Engineering M achinery Textile Other manufactu Transp ort and st Rubber -Plastic Agriculture Professional Act Petrol-Chemicals Business services Real estate Automotive Utilities ICT Accommodation Financial assets Pharmaceutical Cultural activitie n.a. Total Se s at the beginn e described in es in crisis in 2 s belong to dif s in crisis and ng y y ons nufacturing and storage lastic e emicals nal Activities services ve
dation and restora e utical ctivities assets Sector uring torage ivities s s and restoration s ector ning of decline
the table belo 2015 fferent econom their belongin Nr ation Nr 1 4 C
e and their bel
ow (Table 5). mic sectors, w ng to different % 2 442 416 408 404 332 325 324 270 238 117 105 87 67 64 62 43 25 19 13 8 3 5 772 Comp anies % 722 4 331 294 249 245 181 174 171 154 148 120 64 62 47 44 42 40 27 8 4 4 1 132 Comp anies longing to diff
with certain ave t economic sec 42,3% 7,2% 7,1% 7,0% 5,8% 5,6% 5,6% 4,7% 4,1% 2,0% 1,8% 1,5% 1,2% 1,1% 1,1% 0,7% 0,4% 0,3% 0,2% 0,1% 0,1% 100% 1 Average 1,67% 8,01% 7,12% 6,03% 5,93% 4,38% 4,21% 4,14% 3,73% 3,58% 2,90% 1,55% 1,50% 1,14% 1,06% 1,02% 0,97% 0,65% 0,19% 0,10% 0,10% 0,02% 100% Avera ferent econom erage producti ctors 50 419 070 8 617 674 11 695 412 8 535 983 4 891 739 6 136 465 5 988 246 5 090 218 5 010 927 2 541 624 2 874 079 1 643 456 1 338 275 1 375 745 1 176 345 901 546 479 743 319 251 752 972 118 371 26 665 119 933 806 p roduction value 42 932 894 9 390 521 5 681 233 6 942 653 4 780 492 3 065 100 3 153 388 3 179 949 3 773 848 2 795 499 3 305 752 1 891 543 1 991 029 822 037 1 863 625 962 692 607 443 362 850 110 231 49 486 44 347 4 134 97 710 747 age p roduction va mic sectors
ion value (Tab % 42,04% 7,19% 9,75% 7,12% 4,08% 5,12% 4,99% 4,24% 4,18% 2,12% 2,40% 1,37% 1,12% 1,15% 0,98% 0,75% 0,40% 0,27% 0,63% 0,10% 0,02% 100% 2013/2015 % 43,94% 9,61% 5,81% 7,11% 4,89% 3,14% 3,23% 3,25% 3,86% 2,86% 3,38% 1,94% 2,04% 0,84% 1,91% 0,99% 0,62% 0,37% 0,11% 0,05% 0,05% 0,00% 100% alue 2013/2015 ble 6). % % % % % % % % % % % % % % % % % % % % % % %
ijbm.ccsen 3.2 The F The frame classifica company Mazzolen their attitu Our fram • grow which is c Where: PVn, PVm • com • com The fram group of financial growth. E Subseque classifica safe inves and more 1) Investm i) Star co above 7% financial minor ma second qu debt at th 2) High net.org Framework ework of the p ation into six
’s growth, an ni & Rossi (20 ude to repay f mework allows wth the comp calculated as f m = value of p mpany’s profita mpany’s attitud Attitu ework uses a m companies be debt ratio of c Every quadran
ently, the com ation model, si
stment (or inv e profitable inv ment grade co mpanies and e % and average instruments, s arkets (AIM); uadrant – whic he level below risk compani Int paper is repres groups accord nd the profitab 006), which pr financial debts to perform an pany’s growth follows: production in y ability: Profitabili de to repay fin ude to repay f matrix, which elonging to th companies loc nt has been ma Figure mpanies of ou milar to Mood vestment grade vestments). Th ompanies, whic excellent com e financial deb such as debt (m capital marke ch are characte 5. They often es, which con
ternational Jour ented by Giac ding to differ bility. In add oposed a suita s, the company nalysis taking is measured CAGR years “n” and
ity in the year
nancial debt: financial debt is divided into he quadrant. T cating in the sa atched to the m 1. The subject ur sample hav dy’s, S&P’s an e), while the ra herefore, the fo ch are compos mpanies – belon bt below 5. St mini-bond or c et through priv erized by a pro n recourse to b ntain the follo
rnal of Business
cosa and Mazz rent elements, dition, we said able funding m y’s growth, an into considera thanks to CA =
pv
m/
p
“m”, where m “n”= Ebitda in the year n = o 6 quadrants. The bubble’s p ame quadrant most appropria tive dimension ve been divid nd Fitch or Ce atings from BB following comsed of the foll nging to the fi tar companies commercial pa vate equity co ofitability belo banking chann owing catego s and Managem zoleni (2016), w such as the d that our res method for med nd profitability
ation the follow AGR indicator n
pv
- 1 m>n. (n)/Productio = Financial D . Each of them position is inf , while its size ate financial inn in financing ded in few ca erved. The ratin BB are define mpanies’ catego owing compan irst quadrant, s have access apers) standard ompanies; ii) m ow 7% but they el and also mi ories: i) comp ment which propose attitude to rep search is a de dium-sized co y. wing elements r (Compound on value (n) Debts (n)/Ebitd m contains a bu fluenced by av e represents th nstruments (Fi g choices ategories, acc ngs from AAA d as speculativ ories have bee nies: characterized both to bank d or hybrid; qu mature compa y take advanta ini-bonds; panies at the b Vol. 12, N es a model of c pay financial evelopment of ompanies by co s: d Annual Grow da (n) ubble which re average profita heir average c igure 1). cording to a c A to BBB are r ve grade (with en identified: by average pr channel and a uotation on th anies – belong age of a modes beginning of No. 10; 2017 companies debts, the f Giacosa, onsidering wth Rate), epresents a ability and ompanies’ credit risk referred to h high-risk rofitability alternative he major or ging to the st financial decline –
repayment between 5 -10 years. They have difficulties in accessing banking channel; therefore, they generally use financial markets (capital and debt); ii) companies in development – belonging to the fourth quadrant – with high average profitability above 7% and an average financial debt between 5-10 years. Generally, the following funding instruments have been used: private equity operators, hybrid debt or equity instruments, and the quotation on the smaller markets; iii) companies in crisis – belonging to the fifth quadrant and characterized by low profitability (less than 7%) and a high financial debt more than 10, and subjected to the bankruptcy procedures. They have serious difficulties in obtaining bank loans; therefore, they need another source of financing in non-bank instruments; iv) companies in reorganization – belonging to the sixth quadrant. They are characterized by high profitability (more than 7%) and financial debt above 10. For that reason, they are also called “distressed companies”. They could use both banking channel and non-bank funding instruments.
4. Findings
It emerged that:
• First two quadrants is composed of 63% of Italian companies characterized by very good attitude in repaying financial debts (they repay their debts at least in 5 years);
• Third and fourth quadrant contain 19,1% of the company with moderate capacity of financial debts repayment (they repay their debts in 5 – 10 years);
• 11,9% of companies has limited attitude of repaying financial debts (in more than 10 years for debt repayment);
• 6% of companies are characterized by negative EBITDA;
• 38% companies have profitability higher than 7%;
• 56% of the companies are characterized by a profitability below 7%. In addition:
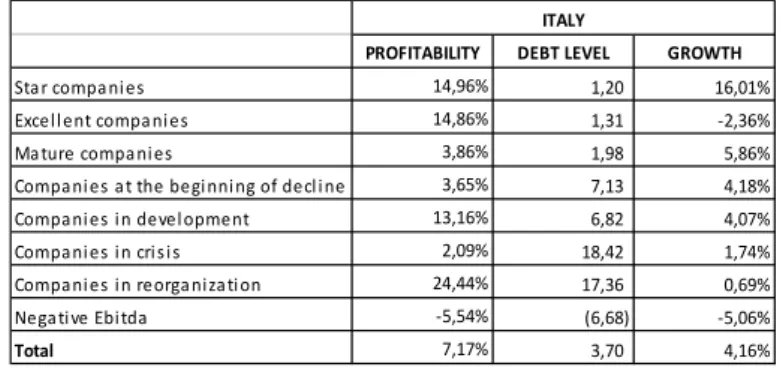
• For star companies, average profitability and capacity to repay financial debts (17,1% of the sample) are little bit better if compared to other companies belonging to the first quadrant (with a growth below of 5%). Their growth in three-year period is high (16,01%), while the growth of other companies belonging to the same quadrant is not lower than the reference parameter (5%) and the results are negative (-2,36%). 32% of Italian companies belonging to the first quadrant can recourse to both standard or hybrid debt instruments (mini bond or commercial papers), along with capital market, private equity operators, or quotation on a main markets or AIM markets;
• The second quadrant (30,09%) is composed of companies with capacity of financial debts repayment in at least 5 years. They are characterized by an average profitability below 7% in three years;
• 14,6% of the companies are “companies at the beginning of decline”: they recorded profitability of 3,65%, low ability to repay financial debts (7.13) and the growth in three-year period of 4.18;
• “Companies in development” are about 4,5% of the sample. They are characterized by high profitability (13,16%) and potential growth (4,07%), and high debt levels (with an attitude of debt prepayment of 6,82); • An attitude of repaying financial debts in at least 10 years characterizes both “companies in crisis” (10,5% of the sample) and “companies in reorganization” (1,4%). Companies in crisis have an average profitability of 2,09%, a growth of production value of 1,74% and limited attitude of financial debts repayment (17,36 years). Companies in reorganization have an high profitability (24,44%), a certain attitude to repay financial debts (18,42 years) and positive growth (0,69%).
Table 7. The composition of the different quadrants of the matrix
Nr i mpre s e % Sta r compa ni e s 6.731 17,08% Exce l l e nt compa ni e s 5.888 14,94% Ma ture compa ni e s 12.184 30,92% Compa ni e s a t the be gi nni ng of de cl i ne 5.772 14,65% Compa ni e s i n de ve l opme nt 1.789 4,54% Compa ni e s i n cri s i s 4.132 10,49% Compa ni e s i n re orga ni za ti on 549 1,39% Ne ga ti ve Ebi tda 2.355 5,98% Total 39.400 100% ITALY
ijbm.ccsenet.org International Journal of Business and Management Vol. 12, No. 10; 2017
Table 8. Profitability, debt level and growth of companies in 2013-2015
In addition, companies with better profitability and growth (with the exception of excellent companies) are characterized by an attitude of repaying financial debts in 1 and 2 years. With the exception of companies in development and in reorganization, they record a low profitability and an ability of debt repayment in a long period (more than 6 years).
5. Conclusion, Implications and Limitations
Around 63% of Italian companies can use bank loans without problems, while 37% of the companies the bank loan is not the main source of funding.
In a medium-term vision, it’s necessary to change the management behavior and to try to reach economic fundamentals expected by the bank system, while in the short-term vision the companies have to learn how to use a non-bank financial instruments.
Different financing instruments could be used by the company: i) debt financing instruments; and ii) capital financing instruments, or iii) a mixed solution. In making the decision process, the company has to taken into account different aspects, such as the sharing of development project of the company, characterized by potential funders/investors, with the purpose to attract their attention to cover the company’s needs. In addition, also the way of evaluating the business projects, which is based on historical results which help to assess the company’s creditworthiness (in the case of debt financing instruments), and on a combination between past performance and future results (in the case of capital financing instruments assessment).
The financial market (both considering the capital and debt financing market) is characterized by presents development margins in terms of regulatory framework – which facilitate the use of innovative financing instruments – and the number of actors who may operate. The following considerations emerged:
• Companies characterized by high growth rates and higher profitability pursue a prudent policy in terms of
banking channels;
• Innovative funding instruments could encourage the companies to change their environment in terms of using only banking channels;
• Considering a short term vision, a banking channel is the most popular way of obtaining financial sources for small and medium-sized companies. However, in a long term vision, it’s emerged a relevant change of this aspect especially considering the financing fixed investments;
• Companies using alternative financing instruments (mini bonds) or the listed one are not always belonging to “excellent companies” quadrant. Therefore, access to alternative financing instruments depends not only on business plan but also on the attitude to introduce it to potential funders.
Theoretical and practical implications of the model are the following:
• In terms of theoretical implications, various solutions for small and medium-sized companies have been proposed to improve their performance. In addition, companies belonging to the third and the fifth quadrant need certain corrective actions to improve their condition;
• In terms of practical implications: useful funding instruments adapted to certain group of companies have been introduced. Undertaking paths proposed by the model can positively impact on the companies’ economic and financial position, especially when they are also focused at non-bank sources of financing. In addition, it emerged a need of facilitating an access to alternative financing instruments (such as appropriate legislative government’s
PROFITABILITY DEBT LEVEL GROWTH
Star compani es 14,96% 1,20 16,01% Excell ent compani es 14,86% 1,31 -2,36% Mature compani es 3,86% 1,98 5,86% Compani es at the begi nni ng of decl i ne 3,65% 7,13 4,18% Compani es i n devel opment 13,16% 6,82 4,07% Compani es i n cri s i s 2,09% 18,42 1,74% Compani es i n reorga niza ti on 24,44% 17,36 0,69% Negati ve Ebi tda -5,54% (6,68) -5,06%
Total 7,17% 3,70 4,16%
by adopting advanced instruments with the purpose to reduce information asymmetries towards financial community and investors.
The research is characterized by some limitations in different terms:
• According to the analysis, we only used three indicators evaluating the company’s economic and financial
position (profitability, growth and ability of debt repayment)., despite they represent a strong correlation with the company’s performance;
• Our model takes into consideration only quantitative variables. Relevant qualitative factors have not been included (such as the originality of the brand, investment projects and market share).
References
Anderson, R. C., & Reeb, D. M. (2003). Founding family ownership and firm performance: Evidence from the S&P 500. Journal of Finance, 58(3), 1301-1328. https://doi.org/10.1111/1540-6261.00567
Baginski, S. P., & Hassel, J. M. (2004). Management decision and financial accounting reports. Mason: Thomson South-Western.
Belkhir Boujelbene, N., Bouri, A., & Prigent, J. L. (2011). Ownership structure and stock market liquidity: evidence from Tunisia. International Journal of Managerial and Financial Accounting, 3(1), 91-109. https://doi.org/10.1504/IJMFA.2011.038365
Bertini, U. (1991). Strategie di sviluppo interno e forme organizzative. In Gozzi, A. (Ed.), La definizione e la
valutazione delle strategie aziendali. Milan: Etas.
Bracci, E. (2007). La piccola impresa familiare. In Bracci, E. and Vagnoni, E. (Eds.), Le piccole imprese familiari. Il
capitale intellettuale nella gestione del ricambio generazionale. Milan: FrancoAngeli.
Brealey, R. A., & Myers S. C. (1988). Principi di finanza Aziendale. Milan: McGraw-Hill.
Canals, J. (2001). How to think about corporate growth. European Management Journal, 19(6), 587-598. https://doi.org/10.1016/S0263-2373(01)00084-6
Castronuovo, S. A. (2008). Il settore industriale in Sicilia: dimensione economica e struttura finanziaria. Rome: Bonanno.
Dainelli, F., & Giunta, F. (2010), Rapporto sulle condizioni economico-finanziarie delle società di capitali toscane
2004-2008. Retrieved from http://www.fargroup.eu/sites/default/files/Rapporto%202004-2008.pdf
Dallocchio, M., Tzivelis, D., & Vinzia, M. A. (2011). Finanza per la crescita sostenibile. Milan: Etas.
Domenichelli, O. (2013). Le determinanti della struttura finanziaria delle imprese: profili teorici ed empirici. Turin: Giappichelli.
Durand, D. (1952). Costs of Debt and Equity Funds for Business: Trends and Problems of Measurement. In
Conference on Research in Business Finance (pp. 215-262). National Bureau of Economic Research, New
York.
European Central Bank. (2014). Asset Quality Review. Phase 2 Manual. Retrieved from https://www.bankingsupervision.europa.eu/ecb/pub/pdf/assetqualityreviewphase2manual201403en.pdf Fazzari, S., Hubbard, G., & Peterson, B. (1988). Financing Constraint and Corporate Investments. Brooking Papers
on Economic Activity, 1(1), 141-195. https://doi.org/10.2307/2534426
Fellnhofer, K. (2015). Literature review: investment readiness level of small and medium sized companies.
International Journal of Managerial and Financial Accounting, 7(3/4), 268-284. https://doi.org/10.1504/IJMFA.2015.074904
Ferrero, G., Dezzani, F., Pisoni, P., & Puddu, L. (2006). Analisi di bilancio e rendiconti finanziari. Milan: Giuffré. Ferri, S., & Messori, M. (2000). Bank-firm Relationship and Allocative Efficiency in Northeastern and Central Italy
and in the South. Journal of Banking and Finance, 24(6), 1067-1095.
https://doi.org/10.1016/S0378-4266(99)00118-1
Ferri, S., & Rotondi, Z. (2006). Does Finance Matter in the Re-specialization of Italy’s Industrial Districts? In Bracchi, G. and Masciandaro, D. (Eds.), Undicesimo Rapporto sul Financial system Italiano. Milan: Bancaria Editrice.
ijbm.ccsenet.org International Journal of Business and Management Vol. 12, No. 10; 2017
Gallucci, C., Nave, G., & Santulli, R. (2012). Nuove modalità di dialogo banca-impresa: il ruolo degli asset familiari.
Esperienze d’Impresa, 1(1), 7-24.
Garofalo, G. (1987). La struttura finanziaria: aspetti istituzionali e teorici. Rome: La Sapienza.
Giacosa, E. (2012a). La comunicazione economico-finanziaria d’impresa. Finalità, strumenti e comportamenti
attuali e teorici in un modello “ideale” di comunicazione. Turin: Giappichelli.
Giacosa, E. (2012b). Mergers and Acquisitions (M&As) in the Luxury Business. Milan: McGraw-Hill.
Giacosa, E. (2015). Fabbisogno finanziario e indebitamento nelle piccolo e medie imprese. Milan: FrancoAngeli. Giacosa, E., & Guelfi, S. (2003). L’economia delle aziende della net economy. Turin: Giappichelli.
Giacosa, E., & Mazzoleni, A. (2016). A decision model for the suitable financing for Small and Medium Enterprises.
International Journal of Managerial and Financial Accounting, 8(1), 75-96. https://doi.org/10.1504/IJMFA.2016.076667
Giacosa, E., Mazzoleni, A., & Rossi, M. (2016). The financing methods for small and medium companies: comparison between Italy and Germany. Corporate Ownership & Control, 13(3), 366-377.
Giunta, F. (2005). Il bilancio. Milan: Apogeo.
Giunta, F. (2007). Analisi di bilancio. Riclassificazioni, indici e flussi. Firenze: Centro Stampa Il Prato.
Goold, M. (1999). The growth imperative. Long Range Planning, 32(1), 127-129.
https://doi.org/10.1016/S0024-6301(98)00133-2
Grandinetti, R., & Nassimbeni, G. (2007). Le dimensioni della crescita aziendale. Milan: FrancoAngeli.
Gualandri, E., & Schwizer, P. (2008). The Role of the Public Sector’, in Gualandri, E. and Venturelli, V. Bridging
the Equity Gap for Innovative SMEs. Basingstoke GBR: Palgrave Macmillan Houndmills 145-172.
Hart, P., & Mellons, J. (1970). Management youth and company growth: a correlation? Management Decision, 4(1), 50-53. https://doi.org/10.1108/eb000925
Herrera, A. M., & Minetti, R. (2007). Informed Finance and Technological Change: Evidence from Credit Relationship. Journal of Financial Economics, 83(1), 225-269. https://doi.org/10.1016/j.jfineco.2005.12.001 Honjo, Y., & Harada, N. (2006). SME Policy, Financial Structure and Firm Growth: Evidence from Japan. Small
Business Economics, 27(4), 289-300. https://doi.org/10.1007/s11187-005-6703-0
Ingram, R. W., Albright, T. L. and Baldwin, B. A. (2002). Financial Accounting. Information for decisions. Mason: Thomson South-Western.
La Rocca, M. (2008). Corporate governance, struttura finanziaria e valore. Milan: Egea. La Rocca, M. (Eds.) (2007). Politiche finanziarie d’impresa. Milan: Egea.
Lang, L., Ofek, E., & Stulz, R. M. (1996). Leverage, Investment and Firm Growth. Journal of Financial Economics,
40(1), 3-29. https://doi.org/10.1016/0304-405X(95)00842-3
Lombardi, S. G. (2013). Valutazione e analisi di bilancio. Milan: Pearson.
Machauer, A., & Weber, M. (2000). Number of Bank Relationships: An Indicator of Competition, Borrower Quality,
or Just Size? Center for Financial Studies, Working Paper Series, 6.
Maggioni, V., Potito, L., & Viganò, R. (Eds.), (2009), Corporate governance: governo, controllo e struttura
finanziaria. Bologna: Il Mulino.
Mahérault, L. (2000). The influence of going public on the investment policy. Family Business Review, 13(1), 71-79. https://doi.org/10.1111/j.1741-6248.2000.00071.x
Marchi, L., & Quagli, A. (1991). Bilancio gestionale. Evoluzione del sistema contabile e sintesi economica e
finanziaria. Milan: Ergon Business Communication.
Meles, A. (2007). Il mercato delle imprese italiane: profili di struttura finanziaria. Naple: E. Albano.
Miles, J. A., & Ezzel, J. R. (1980). The Weighted Average Cost of Capital, Perfect Capital Markets, and Project Life: A Clarification. The Journal of Financial and Quantitative Analysis, 15(3), 719-730. https://doi.org/10.2307/2330405
Modigliani, F., & Miller, H. M. (1958). The Cost of Capital, Corporation Finance and the Theory of Investment. The
American Economic Review, 48(3), 261-297.
Montalenti, P. (2009). Crisi finanziaria, struttura dell’impresa, corporate governance. Rome: ODC.
Mulkay, B., & Sassenou, M. (1995). La hiérarchie des financements des investissements des PME. Revue
Économique, 8(2), 345-363.
Myers, S. C. (1974). Interactions of Corporate Financing and Investment Decisions - Implications for Capital Budgeting. Journal of Finance, 29(1), 1-25. https://doi.org/10.1111/j.1540-6261.1974.tb00021.x
Oliveira, B., & Fortunato, A. (2006). Firm Growth and Liquidity Constraints: A Dynamic Analysis. Small Business
Economics, 27(2), 139-156. https://doi.org/10.1007/s11187-006-0006-y
Osteryoung, J. S., Constand, R. L., & Nast, D. A. (1992). Financial ratios in large public and small private firms.
Journal of Small Business Management, 30(3), 35-46.
Penrose, E. T. (1959). The Theory of the Growth of the Firm. , New York: Oxford University Press. Pezzini, A., & Di Cesare, M. (2003). Le piccole e medie imprese in Europa. Catanzaro: Rubbettino Editore. Potito, L. (2013). Le operazioni straordinarie nell’economia delle imprese. Turin: Giappichelli.
Rossi, M. (2014b). Capital budgeting in Europe: Confronting theory with practice. International Journal of
Managerial and Financial Accounting, 6(4), 341-356. https://doi.org/10.1504/IJMFA.2014.066403
Rossi, M. (2015). The efficient market hypothesis and calendar anomalies: a literature review. International Journal
of Managerial and Financial Accounting, 7(3/4), 285-296. https://doi.org/10.1504/IJMFA.2015.074905
Unioncamere. (2007). Le piccole e medie imprese nell’economia italiana. Rapporto 2007. Il dinamismo della
ristrutturazione. Milan: FrancoAngeli.
Value, B. (2001). Guide to Analysing Companies. London: The Economist, Profile Books. Venanzi, D. (1999). La scelta della struttura finanziaria: teoria ed evidenza empirica. Turin: Italy. Venanzi, D. (2003). Le decisioni di struttura finanziaria delle imprese italiane. Perugia: Morlacchi. Venanzi, D. (2010). Il puzzle della struttura finanziaria. Milan: Pearson Prentice Hall.
Zazzaro, A. (2008). I vincoli finanziari alla crescita delle imprese. Rome: Cacucci.
Copyrights
Copyright for this article is retained by the author(s), with first publication rights granted to the journal.
This is an open-access article distributed under the terms and conditions of the Creative Commons Attribution license (http://creativecommons.org/licenses/by/4.0/).