Processes 2019, 7, 86; doi:10.3390/pr7020086 www.mdpi.com/journal/processes
Article
Life Cycle Assessment and Economic Analysis of an
Innovative Biogas Membrane Reformer for Hydrogen
Production
Gioele Di Marcoberardino 1,*, Xun Liao 2, Arnaud Dauriat 2, Marco Binotti 1 and Giampaolo Manzolini 1
1 Politecnico di Milano, Dipartimento di Energia, via Lambruschini 4, 20156 Milano, Italy;
[email protected] (M.B.); [email protected] (G.M.)
2 Quantis, EPFL Innovation Park building D, 1015 Lausanne, Switzerland; [email protected] (X.L.);
[email protected] (A.D.)
* Correspondence: [email protected]; Tel.: +39-02-2399-3935
Received: 21 December 2018; Accepted: 4 February 2019; Published: 8 February 2019
Abstract: This work investigates the environmental and economic performances of a membrane reactor for hydrogen production from raw biogas. Potential benefits of the innovative technology are compared against reference hydrogen production processes based on steam (or autothermal) reforming, water gas shift reactors and a pressure swing adsorption unit. Both biogas produced by landfill and anaerobic digestion are considered to evaluate the impact of biogas composition. Starting from the thermodynamic results, the environmental analysis is carried out using environmental Life cycle assessment (LCA). Results show that the adoption of the membrane reactor increases the system efficiency by more than 20 percentage points with respect to the reference cases. LCA analysis shows that the innovative BIONICO system performs better than reference systems when biogas becomes a limiting factor for hydrogen production to satisfy market demand, as a higher biogas conversion efficiency can potentially substitute more hydrogen produced by fossil fuels (natural gas). However, when biogas is not a limiting factor for hydrogen production, the innovative system can perform either similar or worse than reference systems, as in this case impacts are largely dominated by grid electric energy demand and component use rather than conversion efficiency. Focusing on the economic results, hydrogen production cost shows lower value with respect to the reference cases (4 €/kgH2 vs 4.2 €/kgH2) at the same hydrogen delivery pressure of 20
bar. Between landfill and anaerobic digestion cases, the latter has the lower costs as a consequence of the higher methane content.
Keywords: biogas; hydrogen production; fluidized bed membrane reactor; life cycle assessment; economic analysis
1. Introduction
Hydrogen is a promising energy carrier, that can replace fossil fuels in power generation and transports, when produced by renewable sources [1]. Nowadays H2 production mainly comes from
steam reforming of natural gas [2], although H2 can be produced from others fossil sources by
hydrocarbon reforming and pyrolysis of coal or natural gas, or from renewable feedstocks by biological or thermochemical processing of biomass or water splitting [3]. In Europe, the common biogas (BG) production process is the anaerobic digestion of agricultural waste, manure, and energy crops; then biogas, or biomethane (if the plant has an upgrading step) is currently fed to an internal combustion engine for electricity and heat production [4]. The Fuel Cells and Hydrogen Joint Undertaking (FCH-JU) project BIONICO, financed by the European Commission, aims at developing an innovative concept for green hydrogen production from raw biogas. Steam reforming of raw
biogas, that mainly consists of methane and carbon dioxide, was identified as one of the cheapest and promising way for hydrogen production [1].
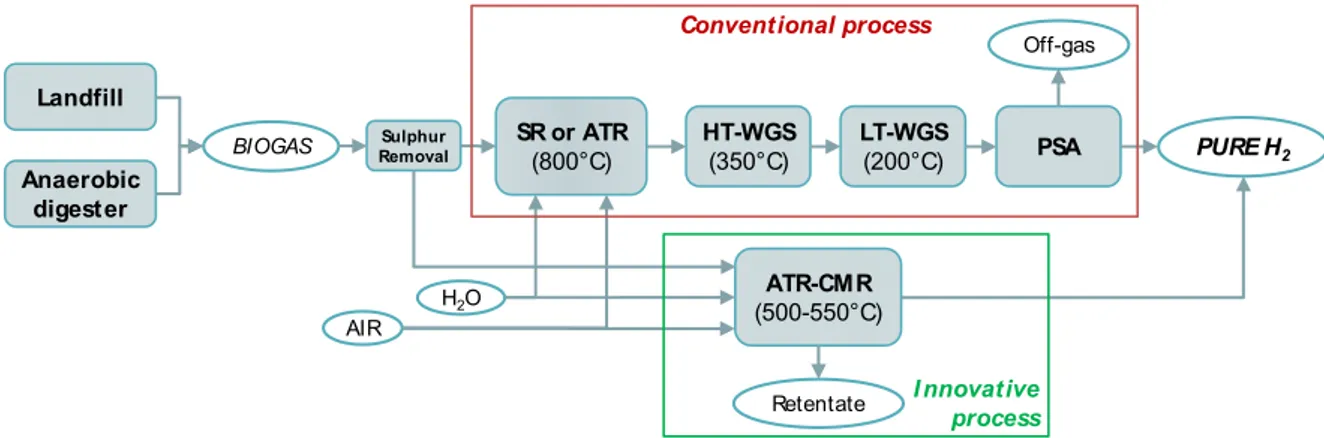
As shown in Figure 1, the conventional reforming process consists of a steam reformer (SMR) or autothermal reformer (ATR), typically working at 800 °C, followed by two water gas shift (WGS) reactors (high-temperature, HT-WGS, and low-temperature, LT-WGS) and by a pressure swing adsorption (PSA) unit for hydrogen separation [5]. The innovative membrane reactor technology, such as the autothermal catalytic membrane reactor (ATR-CMR) in Figure 1, developed within BIONICO, allows the production and separation of hydrogen in a single vessel, with advantages over traditional biogas reforming related to the increase of the overall conversion efficiency and to the strong decrease of equipment size due to the process intensification [6].
Compared to previous works [7,8], this paper starts from the energy and economic consideration to evaluate the environmental performance of the innovative BIONICO process comparing results with the conventional H2 production processes from raw biogas assumed as references. The
combination of conventional techno-economic assessment with environmental assessment is necessary when dealing with technologies aiming at increasing the overall system efficiency, reducing the energy consumption. Life cycle assessment (LCA) determines the environmental impacts including all the system aspects, covering multiple indicators, including water withdrawal, ecosystems, resources depletion, and human health, with detailed analysis on the climate change impact.
Figure 1. Hydrogen production from biogas.
Various LCA studies have been performed on biogas production system and its conversion into combined electricity and heat (CHP), and they all provide quite similar insights. Whting et al. [9] showed that the global warming potentials (GWP) of a CHP system fed with biogas from anaerobic digestion of agricultural wastes can be much lower compared with fossil fuel alternatives: in particular, climate change impacts are influenced by the type and source of feedstock, digestate storage and its application on land. Bacenetti et al. [10] found that feedstock production and digestate emissions are the main contributors to the impact of agricultural anaerobic digestion plants. Van Stappen et al. [11] identified that the key determining factors for LCA are the choices of biogas feedstock and displaced marginal technologies for electricity production and fertilizers. Hijazi et al. [12] reviewed the LCA study of biogas production in Europe, and also found sources of feedstocks for biogas determining the overall environmental impact for biogas systems. Moreover, some LCA studies have also been performed on hydrogen production from biogas. Hajjaji et al. [13] found a cradle to grave carbon footprint of 5.59 kgCO2-eq per kg of H2 produced from biogas from anaerobic
digesters. More than 96% of those impact came from the biogas feedstock production stage, and impact results are highly influenced by the amount of artificial fertilizer displaced by digestate and credits from recycling the plant construction materials and equipment. Valente et al., [14] calculated the harmonized carbon footprint from 71 case studies of green H2 production: the only case study
related to biogas reforming [13] resulted in a harmonized carbon footprint is 7.34 kgCO2-eq per kg of
H2 produced. Battista et al., [15] investigated an ATR reforming process finding that the carbon ATR-CM R (500-550°C) SR or ATR (800°C) HT-WGS (350°C) LT-WGS (200°C) PSA Sulphur Removal BIOGAS H2O AIR PURE H2 Off-gas Anaerobic digest er Landfill Retentate Conventional process I nnovative process
footprint from required material production and the total life cycle stages are 0.08 and 7.24 kgCO2-eq
per kg of H2 produced respectively. Major impacts are related to energy consumption of the PSA and
air compressors as well as CO2 emitted during the auto-thermal reforming process.
Most of the above studies focus on answering the question: “what are the environmental impacts attributed to producing biogas or its derivative product?” Furthermore, they also identified the hotspots influencing impacts are the sourcing of substrates and digestate storage. Admittedly, the biogas production stage is important, however, it is less relevant to our question. In this study, our question is different. The focus is not to debate if we should produce biogas, nor what feedstock of substrates or digestate storage options should be chosen. Instead, the reference condition in this study considers the existing biogas from waste substrates that have been or will be managed for energy production or simply flared without energy recovery. From this reference point, the purpose of our study is to answer the following question: “What technologies are preferable for the environment by diverting the biogas mentioned above for producing hydrogen?”
This study aims to provide a techno-economic and environmental life cycle assessment of the ATR-CMR technology and of the reference technology under different configurations (SMR or ATR) and operating conditions.
2. Case Studies
Six case studies, that differ in terms of production process and biogas composition, are investigated. The innovative BIONICO system is compared with two conventional fuel processor (SMR and ATR); on the other hand, two raw biogas compositions biogases produced by landfill (LF) and anaerobic digestion (AD) are considered. All three systems are designed to produce 100 kg/day of pure hydrogen. Moreover, this work sets a pressure delivery of 20 bar in order to compare the system efficiency with the conventional plants (an additional hydrogen compressor is introduced since hydrogen stream is produced at ambient pressure). As shown in Table 1, the main biogas differences lie on CH4 and inert (CO2, N2) content.
Table 1. Investigated biogas compositions. LF: landfill; AD: anaerobic digestion.
Species Units LF AD CH4 % mol 44.2 58.1 CO2 34.0 33.9 N2 16.0 3.8 O2 2.7 1.1 H2 0.0165 - CO 0.0006 - H2O Saturated Saturated p, T bar, °C 1.013, 25 1.013, 25 LHV MJ/kg 12.7 17.8 2.1. System Layouts
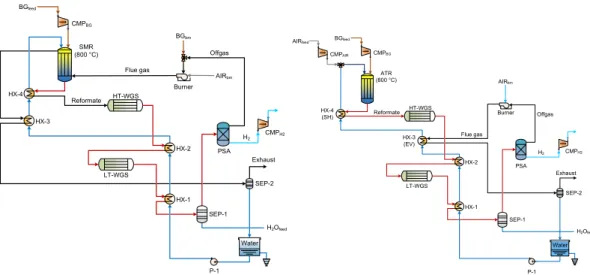
Figure 2 shows layouts for both a conventional system based on steam reforming (Figure 2 left) or auto-thermal reforming (Figure 2 right), while the innovative plant with auto-thermal membrane reactor and vacuum pump is represented in Figure 3.
Figure 2. Reference system layouts: steam reformer (SMR) reforming solution (left) and autothermal
reformer (ATR) reforming solution (right).
In the first reference layout (Figure 2, left), a mixture of compressed BG and steam is fed to the SMR reactor. After a first cooling step (HX-4), the syngas exiting the reforming reactor is sent to water gas shift reactors to promote the CO conversion in CO2, increasing hydrogen production. The
resulting stream consists of a H2 rich syngas diluted with inert gases that, after the water removal, is
sent to a pressure swing adsorption unit to recover a pure H2 flow. The heat required by the
endothermic reaction at the SMR is supplied by the combustion of the PSA off-gas together with an additional amount of biogas (BGbrn). Regarding the second reference layout (Figure 2, right), the main
difference with the previous case relies on the main reactor for biogas to hydrogen conversion. The stream at the inlet of the reactor is a mixture of compressed BG, steam and air. In fact, the heat required by the endothermic reforming reaction is balanced by the partial oxidation of the feed fuel with air. The intake of air is always below stoichiometry and it is regulated to control the reactor operating temperature. Thanks to the partial oxidation, there is no need to supply an additional amount of biogas to the burner: in the ATR configuration, the burner is fed only with the off-gas from the PSA.
Figure 3. Innovative BIONICO system layouts (autothermal catalytic membrane reactor, ATR-CMR).
Water P-1 SMR (800 °C) HT-WGS LT-WGS HX-2 HX-4 CMPBG BGfeed BGbrn AIRbrn Exhaust SEP-1 H2 HX-3 H2Ofeed Burner HX-1 PSA CMPH2 SEP-2 Flue gas Reformate Offgas Water P-1 ATR (800 °C) SEP-2 HT-WGS LT-WGS HX-2 HX-4 (SH) HX-1 CMPBG BGfeed AIRbrn Exhaust PSA SEP-1 H2 CMPAIR HX-3 (EV) Burner AIRfeed H2Ofeed CMPH2 Flue gas Reformate Offgas Retentate Exhaust water rec. H2 BGfeed AirATR H2 Ore a ct io n P-1 CMPBG CMPair Sep ATR-CMR Sep Burner HX-2 Airbrn HX-4 HX-1 HX-3 HXD-1 HXD-2 Vac.P. CMPH2
In the BIONICO layout (Figure 2, right), the BG is firstly compressed (CMPBG), then preheated
up to 300 °C in HX-4 and mixed with steam and water at the inlet of the ATR-CMR. At the ATR-CMR outlet, two streams, the retentate and the pure H2, leave from the top section of the reactor. The
retentate stream, which mainly consists of steam, CO2 and N2 with the remaining CO, CH4 and H2 is
cooled down to 200 °C and throttled before being combusted in air. The separated hydrogen is cooled down to 30 °C and then compressed to the delivery pressure by the vacuum pump/hydrogen compressor. The amount of hydrogen separated in the ATR-CMR is determined so that the thermal power of the retentate closes the energy balance of the system avoiding additional BG supply.
2.2. Techno-Economic Results
The innovative fuel processor and the conventional systems, together with their relative balance of plant, are implemented in Aspen Plus®(AspenTech, Bedford, Massachusetts, MA, USA) [16], where mass and energy balances are solved. The methodology adopted is consistent with previous works [8,17]. A phenomenological model of membrane reactor developed in Aspen Custom Modeler® (ACM) was adopted [18]. The scheme of the membrane reactor model and the main membrane features are summarised respectively in Figure A.1 and Table A.1 in the Annexes section.
All the cases are compared in terms of overall system efficiency, defined in Equation (1) as the ratio of H2 energy output to biogas and auxiliaries’ energy inputs:
h = ̇
̇ , + ̇ , + h
,
(1) where LHVH2 is equal to 120 MJ/kg [19] ; Waux is the sum of the electric consumptions of the system auxiliaries (i.e., compressors, pumps, control system); ƞel,ref is set equal to 45% as the average electric efficiency of the power generating park [20].
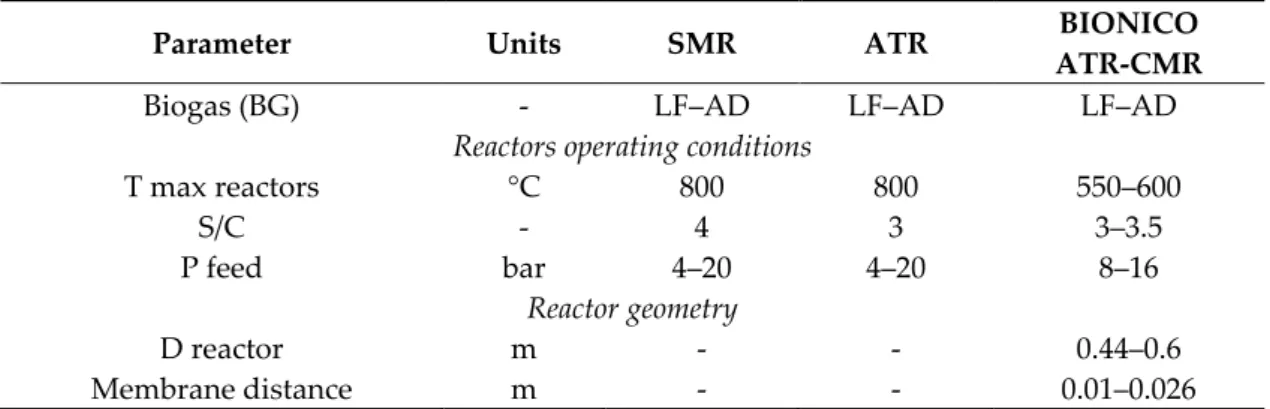
The main design parameters for the investigated systems are listed in Table 2. A sensibility analysis on reactors operating conditions (p, T and steam to carbon S/C), and reactor geometry for the innovative ATR-CMR solution produced more than 400 simulations.
Table 2. Sensibility analysis: design parameters. SMR: steam reformer; ATR: autothermal reformer;
CMR: catalytic membrane reactor.
Parameter Units SMR ATR BIONICO
ATR-CMR
Biogas (BG) - LF‒AD LF‒AD LF‒AD
Reactors operating conditions
T max reactors °C 800 800 550‒600 S/C - 4 3 3‒3.5 P feed bar 4‒20 4‒20 8‒16 Reactor geometry D reactor m - - 0.44‒0.6 Membrane distance m - - 0.01‒0.026
Table 3 summarizes the thermodynamic and economic results for the two biogas compositions with the highest efficiency [7,8]. The overall system efficiency for the BIONICO system is higher than 65% which is at least 19 and 41 percentage points higher than SMR and ATR cases.
Table 3. Techno-economic results for reference and innovative BIONICO systems.
Parameter Units SMR ATR BIONICO
ATR-CMR
BG - LF AD LF AD LF AD
T max reactors °C 800 800 800 800 550 550
H2 flow/pressure kg/day/bar 100/20 100/20 100/20 100/20 100/20 100/20
BG Input kW 247 229 407 368 154.6 154.8
Tot aux cons. kW 24.3 17.9 73.0 60.0 24.8 24.1
ƞsys % 46.2 51.7 24.5 27.8 65.1 66.1
LCOH €/kg 4.29 4.21 6.60 6.41 4.11 4.01
Starting from the thermodynamic results, a preliminary economic analysis of the BIONICO system is carried out to compare the cost of produced hydrogen at different operating conditions. Results are also compared with values found for conventional hydrogen production systems from [7]. The total plant cost (TPC) is calculated with a bottom-up approach breaking down the power plant into basic components or equipment, and then adding installation costs, indirect costs and owner’s and contingencies costs [21]. The components costs, obtained from literature, quotes and reports are then scaled and actualized with the CEPCI index. To evaluate the final levelized cost of hydrogen (LCOH), consumables, auxiliaries variable and fixed costs are added to the TPC, according to the following formulation:
=( × ) + & + ( & × ℎ ) (2)
where CCF represents the carrying charge factor [21] and MH2 is the amount of hydrogen produced in one year of operation. The total installation costs were taken equal to 65% and 80% of the total equipment cost for the innovative and conventional systems respectively [22,23]. Fixed operation and maintenance (O & M) costs are represented by maintenance, insurance and operators costs, while variable O&M costs consider consumables such as catalyst, biogas [24], process water, membranes and auxiliaries electric energy consumptions [25]. Palladium membranes on ceramic supports cost is retrieved from the FERRET project [26] and refers to a production at a semi-industrial scale: membrane cost is included both in the capital cost and in the O & M variable costs taking into account a lifetime of 5 years. The complete methodology and the detailed components costs are reported in [7,8].
Regarding the economic analysis, hydrogen production cost shows lower value respect to the reference cases (4 €/kgH2 vs 4.2 €/kgH2) at the same hydrogen delivery pressure of 20 bar. Between
landfill and anaerobic digestion cases, the latter has the lower costs as consequence of the higher methane content.
3. Lifecycle Assessment (LCA) Methodology
The life cycle assessment approach considered the standards, ISO 14040 [27] and ISO 14044 [28], and the FC-Hy guide for performing LCAs on hydrogen technologies [29]. The functional unit is defined as providing 1 kg of H2 (LHV = 120 MJ/kg) at 20 bar, 15 °C and 99.99% of purity to satisfy the
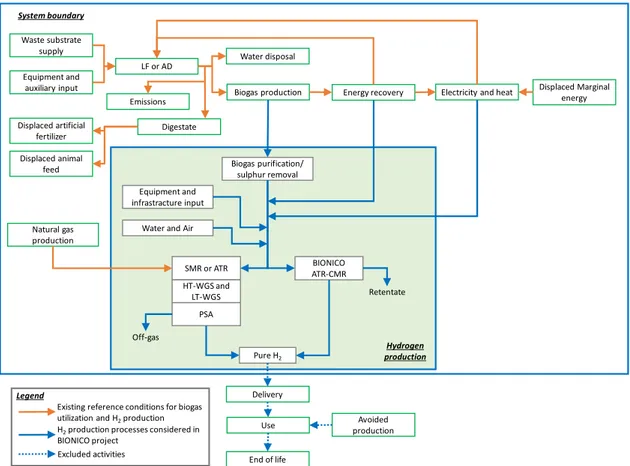
hydrogen market demand. The system boundary is shown in Figure 4 where BIONICO hydrogen production technology is compared to the conventional systems. The biogas production process and the H2 storage, delivery and use are excluded, being equivalent for all the systems.
This study considered the impact of the H2 production system on the current biogas availability
and utilization where nowadays biogas is fed to an internal combustion engine producing electric and thermal energy. Two LCA scenarios are developed:
1. Biogas availability for H2 production is limited. Under this scenario, a system with a higher
biogas conversion efficiency (i.e., BIONICO process) can supply more H2 to the market.
Choosing a technology with lower efficiency means it will require a certain amount of H2
produced from conventional process (such as natural gas steam reforming) to meet the same demand, as shown in Figure 5.
2. Biogas production is abundant, thus there is a surplus of biogas which is simply flared. In this scenario, biogas utilization is not competing with other potential uses.
Figure 4. System boundaries for the reference technologies (SMR and ATR) and BIONICO ATR-CMR
technology.
Figure 5. Scenario 1: biogas utilization and H2 production from the different systems.
For the foreground life cycle inventory data, biogas electricity and auxiliary inputs (water, air) required for the H2 production stages are based on the techno-economic modelling data. Component
data (including reactors, catalyst, membrane) are collected from partners and also data from a previous European project related to H2 production [30]. The life cycle inventory also includes the
components that have been affected by diverting biogas flux for H2 production: it starts from potential
loss of electric and thermal energy that could be produced by the diverted biogas, to the additional impact occurred during the H2 production stages. Furthermore, the following key assumptions are
taken into account:
Biogas production LF or AD Digestate Biogas purification/ sulphur removal Equipment and auxiliary input Waste substrate supply Displaced artificial fertilizer Displaced animal feed Displaced Marginal energy Electricity and heat
Energy recovery Emissions Water disposal Natural gas production Equipment and infrastracture input SMR or ATR BIONICO ATR-CMR HT-WGS and LT-WGS PSA Pure H2 Delivery Use End of life Avoided production Water and Air
Hydrogen production System boundary
Retentate
Off-gas
Existing reference conditions for biogas utilization and H2production Legend
H2production processes considered in BIONICO project
For scenario 1, the energy recovery of biogas is assumed to be cogeneration of electricity and heat. The electric and heat efficiencies are assumed to be 39% and 46%, respectively, with a total CHP efficiency of 85% [31]. The impact of biogas production is excluded from the cogeneration impact. The marginal replacing technology for the lost energy resulting from biogas diversion are assumed to be the European average for electricity generation and natural gas cogeneration for heat production;
The European average grid mix is assumed to be the marginal electricity generation technology demanded for hydrogen production;
The only relevant air emission during the H2 production process is CO2, which is considered to
be carbon neutral in this study;
When natural gas is used as additional feedstock for H2 production, it is assumed the
conventional H2 production from the steam reforming technology is used. The inventory and
impact data are based on [32] and [30].
The secondary life cycle impact (LCI) data, describing background processes (e.g., transportation, electricity production), comes from the Ecoinvent database v3.4 (Ecoinvent, Zurich, Switzerland) [33]. Besides climate change, the analysis will be focused on human health, ecosystem quality and resources as endpoints.
4. Results and Discussion
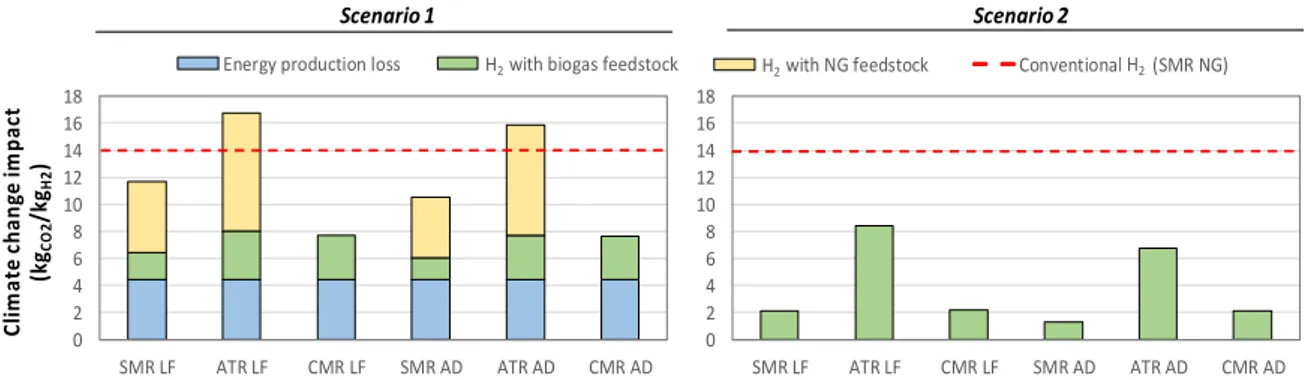
Figure 6 (left) illustrates the climate change impact of the scenario 1 when biogas is a limiting factor. BIONICO ATR-CMR technology performs better than reference systems (SR or ATR), thanks to its higher efficiency of converting biogas to H2. The carbon footprint of the CMR technology could
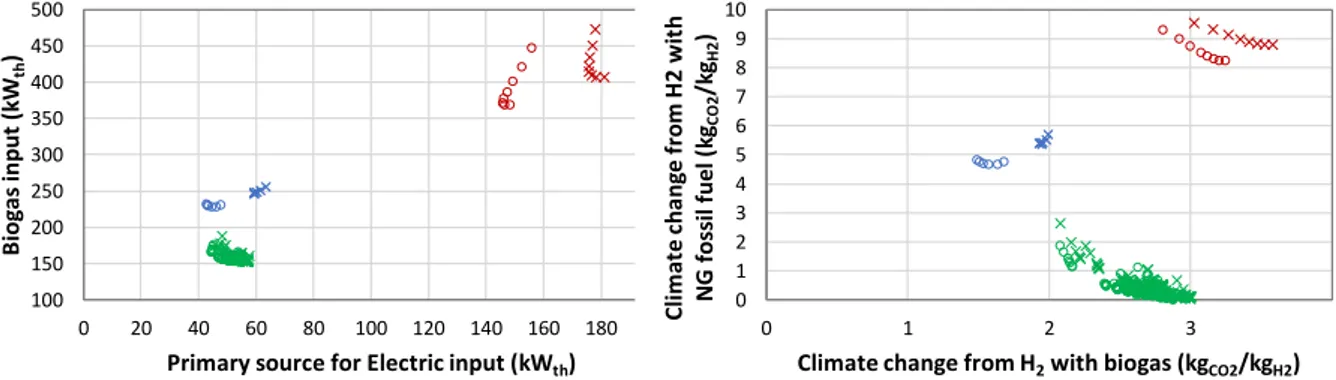
be 45‒46% lower than the conventional hydrogen production metho3333d using steam reforming of fossil natural gas. In this scenario, the impact due to the electrical and thermal energy production loss (biogas is not feeding a cogeneration system) is equivalent for all scenario as the maximum amount of biogas for the conventional process is fixed. As shown in Figure 7 (left), the total thermal input of the BIONICO system is always lower respect to the other processes thanks to the reduced amount of biogas, while the electric consumption is really high only for the ATR case. The key factors are the carbon footprint of the electricity input and of the additional demand for H2 using fossil natural gas
feedstock from lower biogas conversion efficiency systems, as represented in Figure 7 (right).
Figure 6. Climate change impact of the investigated systems against the conventional H2 production
from natural gas steam reforming.
0 2 4 6 8 10 12 14 16 18 SMR LF ATR LF CMR LF SMR AD ATR AD CMR AD C li m a te ch a n ge im p ac t (k gCO 2 /k gH2 ) Scenario 1 Scenario 2 0 2 4 6 8 10 12 14 16 18 SMR LF ATR LF CMR LF SMR AD ATR AD CMR AD Energy production loss H2 with biogas feedstockH2 H2 with NG feedstockH2 Conventional H2 (SMR NG)H2
Figure 7. Scenario 1 results: thermal power inputs (electric auxiliary and require biogas) for the three
H2 production systems (left) and climate change impact of H2 production from biogas and fossil fuel
(right).
On the other hand, when biogas is not a limiting factor (scenario 2), the use of higher or lower amount of biogas does not cause additional impacts, thus the energy production loss is zero. Figure 6 (right) shows that climate change impact is dominated by the amount of electricity input required from the grid, as the principle source for hydrogen production. The carbon footprint of both CMR or SMR technology are quite similar as can be seen from the electric auxiliary consumptions in Figure 8 and Table 3: both the systems can achieve large carbon footprint reduction compared to the ATR system and the conventional H2 production.
Figure 8. Scenario 2 results: climate change impact as a function of the auxiliary electric consumptions
for the three investigated systems. 100 150 200 250 300 350 400 450 500 0 20 40 60 80 100 120 140 160 180 B iog as in p u t (k Wth )
Primary source for Electric input (kWth)
0 1 2 3 4 5 6 7 8 9 10 0 1 2 3 C lim at e ch a n ge f ro m H 2 w it h N G fos sil f u el (k gCO 2 /k gH2 )
Climate change from H2with biogas (kgCO2/kgH2)
SMR ATR CMR LF AD 6 7 8 9 10 60 70 80 90 Electric input (kW) 0 1 2 3 4 10 20 30 40
Electric input (kW)Electric input (kW)
C li m a te ch a ng e (k gCO 2 /k gH2 ) SMR ATR CMR LF AD 6 8 10 12 14 16 18 3 4 5 6 7 C lim at e cha n ge (k gCO 2 /k gH2 ) LCOH (€/kgH2) 2 3 4 5 6 7 8 9 10 3 4 5 6 7 C lim at e ch ang e (k gCO2 /k gH2 ) LCOH (€/kgH2)
Figure 9. Comparison of the climate change impact of both scenario 1 (left) and scenario 2 (right) with
respect to the cost of hydrogen.
Lastly, Figure 9 compared the climate change impact of the two investigated scenarios with respect to the levelized cost of hydrogen confirming that ATR system has the highest impact both from economic and environmental point of view while conventional SR process is similar to the BIONICO technology just in the second scenario where biogas availability is not a constraint.
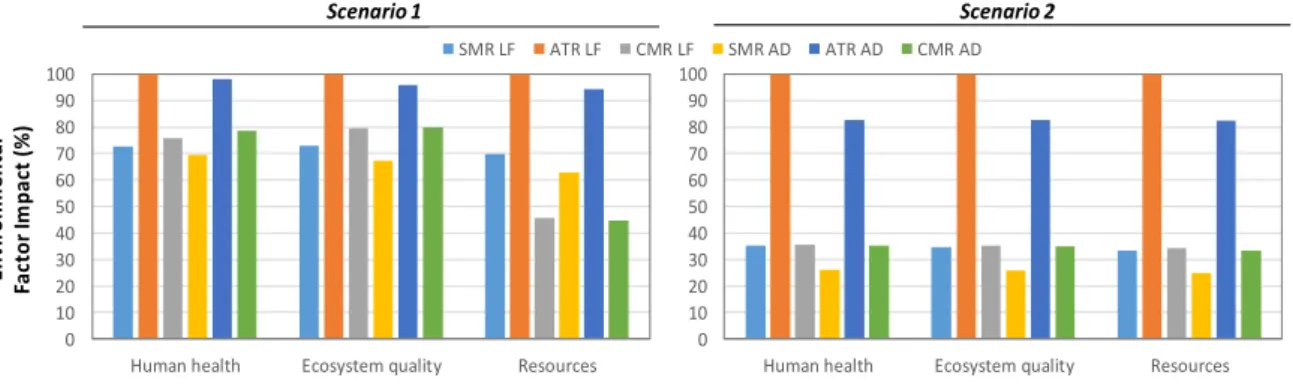
The results of the other environmental factors are shown in Figure 10, where both SMR and CMR technology performs better than ATR; however, the difference between SMR and BIONICO ATR-CMR systems is not significant due to the uncertainties associated with the impact modelling. Process contribution analysis indicates that, for all scenarios, all endpoint categories are highly influenced by the required electricity input and its impact for hydrogen production. For Scenario 1 specifically, the impacts are also influenced by the lost credits of electricity and heat generation due to biogas diversion and also by the additional natural gas required as feedstock to meet H2 demand by systems
with lower biogas conversion efficiency. The results also show a higher overall energy conversion efficiency does not necessarily lead to better human health and ecosystems. A trade-off of climate change and other impact categories should always be investigated.
Figure 10. Comparison of endpoint environmental impact of different systems under different
scenarios. 5. Conclusions
This work investigates the environmental and economic performances of an innovative membrane reformer for hydrogen production from raw biogas. The introduction of palladium membranes in a reforming reactor allows ther simultaneous hydrogen production and separation. This concept has been developed within the BIONICO project. The performance of the BIONICO concept is compared against two available technologies based on reforming, water gas shift reactors and pressure swing adsorption for hydrogen purification.
The system simulations performed with Aspen considered two different biogas compositions, one from landfill and one from anaerobic digestion. The BIONICO system outperforms the reference cases by 40–50% points achieving a hydrogen production efficiency around 69% assuming a delivery pressure of 20 bara. Afterwards, the economic assessment for the investigated cases was carried out accounting for both the capital and operating costs to determine the hydrogen production costs. The hydrogen cost production of the BIONICO case ranges from 4 to 4.2 €/kgH2, while the reference case
resulted 4.21 €/kgH2 and 6.4 €/kgH2 for the SMR and ATR respectively. With respect to the steam
reforming reference case, the BIONICO one has lower biogas and capital costs, but higher electricity costs (as a consequence of the hydrogen compression consumptions), while it has lower biogas and electricity cost with respect to the ATR case. Between the landfill and anaerobic digestion cases, the latter has the lower costs as a consequence of the higher methane content and same price assumed. These results outline the fact that membrane reactors are a promising technology for green hydrogen production starting from biogas.
0 10 20 30 40 50 60 70 80 90 100
Human health Ecosystem quality Resources 0 10 20 30 40 50 60 70 80 90 100
Human health Ecosystem quality Resources
E n vi ro n m e n ta l Fa ct o r Im p a ct ( % ) Scenario 1 Scenario 2 SMR LF ATR LF CMR LF SMR AD ATR AD CMR AD
For environmental life cycle assessment, this shows that the BIONICO case performs better than reference systems for climate change and resource indicators, when biogas becomes a limiting factor for H2 production to satisfy market demand, as the results are more influenced by the additional
hydrogen production. For a healthy human ecosystem, the results are more influenced by the amount and environmental profile of direct electricity input. However, when biogas is not a limiting factor for H2 production, the innovative system can perform either similarly or worse than reference
systems, as impacts are dominated by grid electric energy demand. This study highlights the technology deployment should be carefully examined considering local reference conditions, and type and efficiency of displaced or required marginal technologies for electricity production.
Annexes Nomenclature p Pressure (bar) T Temperature (°C) Acronyms AD Anaerobic digester
ATR Autothermal reformer
ATR-CMR Autothermal catlytic membrane reformer
BG Biogas
CCF Carrying charge factor
CHP Combined heat and power
GWP Global warming potential
HT High temperature
HX Heat exchanger
LCA Life cycle assessment
LCOH Levelised cost of hydrogen
LF Landfill
LHV Low heating value
LT Low temperature
MR Membrane reactor
NG Natural Gas
O/C Oxygen to carbon molar ratio
P Pump
PSA Pressure swing adsorption
S/C Steam to carbon molar ratio
SMR Steam methane reformer
WGSR Water gas shift reformer
Greek letters
ηsys System efficiency in terms of LHV of hydrogen
Membrane Reactor
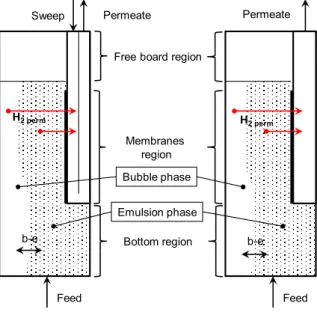
The membrane reactor model includes reforming reactions (different kinetic schemes or chemical equilibrium), detailed hydrodynamics of bubble-emulsion phases and different options on the permeate side (vacuum or co-counter flow sweep gas, including gas diffusion limitations in the porous support) [18]. Membrane reactor bed is divided into three main regions, which lengths can be set by the user: the first region at the bottom of the reactor is dedicated to the oxidation and reforming reactions, the middle region is occupied by the membranes (permeation zone); the last section is a
buffer region that mainly corresponds with the free-board region. The schematic of Aspen Custom Modeler fluidized bed membrane reactor model is depicted in Figure A.1 while the main features of reactor design are reported in Table A.1.
Figure A.1. Scheme of fluidized bed membrane reactor developed in ACM for vacuum pump and
sweep gas case.
Membranes consist of a Pd-Ag layer deposited onto a ceramic multilayer porous support. Parameters of the permeation law (pre-exponential factor k0, apparent activation energy Ea and
exponential factor n), listed in Table 4, comes from experimental analysis of [34]. Table A.1. Membrane reactor features.
Parameter Units Value
Membrane reactor geometry
L reactor m 1
L bottom region (from distributor
to membrane) m 0.1
L free board region m 0.45
D reactor m 0.44‒0.6 Membrane distance m 0.01‒0.026 Membrane parameters OD/ID m 0.014/0.007 Support thickness m 0.0035 Length m 0.45 Membrane thickness ( ) µm 4.5 k0 mol s -1 m-1 Pa-n 3.93 × 10 -8 Ea kJ mol-1 9.26 n - 0.5
Author Contributions: M.B., G.D.M. and X.L. conceived the study. X.L. performed the Life cycle analysis
starting from the thermodynamic system results made by G.D.M. G.D.M. and M.B. wrote the manuscript with support of X.L. G.M. and A.D. supervised the project. All authors discussed the results and contributed to the final version of the manuscript.
Bottom region Membranes
region Free board region
Bubble phase Emulsion phase Feed Permeate Sweep H2 perm b-e Feed Permeate H2 perm b-e
Acknowledgments: The BIONICO project leading to this application has received funding from the Fuel Cells
and Hydrogen 2 Joint Undertaking under grant agreement No 671459. This Joint Undertaking receives support from the European Union’s Horizon 2020 research and innovation programme, Hydrogen Europe and N.ERGHY.
Conflicts of Interest: The authors declare no conflict of interest. References
1. Albrecht, U.; Altmann, M.; Barth, F.; Bünger, U.; Fraile, D.; Lanoix, J.-C.; Pschorr-Schoberer, E.; Vanhoudt, W.; Weindorf, W.; Zerta, M.; Z., et.al. Study on hydrogen from renewable resources in the EU. Final. Rep. 2015. doi:10.1017/CBO9781107415324.004.
2. Sheet, H.F. Hydrogen Production–Steam Methane Reforming (SMR). New York State Energy
Res. Dev. Authority, New York. (2005).
3. Nikolaidis, P.; Poullikkas, A. A. comparative overview of hydrogen production processes.
Renew. Sustain. Eng. Rev. 2017, 67, 597–611.
4. Scarlat, N.; Dallemand, J.-F.; Fahl, F. Biogas: Developments and perspectives in Europe. Renew.
Energy. 2018, 129, 457–472.
5. Alves, H.J.; Bley Junior, C.; Niklevicz, R.R.; Frigo, E.P.; Frigo, M.S.; Coimbra-Araújo, C.H. Overview of hydrogen production technologies from biogas and the applications in fuel cells.
Int. J. Hydrogen Eng. 2013, 38, 5215–5225.
6. Gallucci, F.; Fernandez, E.; Corengia, P.; van Sint Annaland, M. Recent advances on membranes and membrane reactors for hydrogen production. Chem. Eng. Sci. 2013, 92, 40–66.
7. Di Marcoberardino, G.; Vitali, D.; Spinelli, F.; Binotti, M.; Di Marcoberardino, G.; Vitali, D.; Spinelli, F.; Binotti, M.; Manzolini, G. Green Hydrogen Production from Raw Biogas: A Techno-Economic Investigation of Conventional Processes Using Pressure Swing Adsorption Unit.
Processes. 2018, 6, doi:10.3390/pr6030019.
8. Di Marcoberardino, G.; Foresti, S.; Binotti, M.; Manzolini, G. Potentiality of a biogas membrane reformer for decentralized hydrogen production. Chem. Eng. Process. Process Intensif. 2018, 129, 131–141.
9. Whiting, A.; Azapagic, A. Life cycle environmental impacts of generating electricity and heat from biogas produced by anaerobic digestion. Energy. 2014, 70, 181–193.
10. Bacenetti, J.; Sala, C.; Fusi, A.; Fiala, M. Agricultural anaerobic digestion plants: What LCA studies pointed out and what can be done to make them more environmentally sustainable.
Appl. Eng. 2016, 179, 669–686.
11. Van Stappen, F.; Mathot, M.; Decruyenaere, V.; Loriers, A.; Delcour, A.; Planchon, V.; Goffart, J.-P.; Stilmant, D. Consequential environmental life cycle assessment of a farm-scale biogas plant. J. Environ. Manage. 2016, 175, 20–32.
12. Hijazi, O.; Munro, S.; Zerhusen, B.; Effenberger, M. Review of life cycle assessment for biogas production in Europe. Renew. Sustain. Eng. Rev. 2016, 54, 1291–1300.
13. Hajjaji, N.; Martinez, S.; Trably, E.; Steyer, J.-P.; Helias, A. Life cycle assessment of hydrogen production from biogas reforming. Int. J. Hydrogen Eng. 2016, 41, 6064–6075.
14. Valente, A.; Iribarren, D.; Dufour, J. Harmonised life-cycle global warming impact of renewable hydrogen. J. Clean. Prod. 2017, 14, 762–772.
15. Battista, F.; Montenegro Camacho, Y.S.; Hernández, S.; Bensaid, S.; Herrmann, A.; Krause, H.; Trimis, D.; Fino, D. LCA evaluation for the hydrogen production from biogas through the innovative BioRobur project concept. Int. J. Hydrogen Eng. 2017, 42, 14030–14043.
16. AspenTech. Available online: http://www.aspentech.com/products/aspen-plus.aspx (accessed on 15 May2018).
17. Foresti, S.; Manzolini, G. Performances of a micro-CHP system fed with bio-ethanol based on fluidized bed membrane reactor and PEM fuel cells. Int. J. Hydrogen Eng. 2016, 41, 9004–9021. 18. Foresti, S.; Di Marcoberardino, G.; Manzolini ,G.; De Nooijer, N.; Gallucci, F.; van Sint Annaland,
M. A comprehensive model of a fluidized bed membrane reactor for small-scale hydrogen production. Chem. Eng. Process. 2018,
127, 136–144.
19. NIST Chemistry webbook. Available online: https://webbook.nist.gov/chemistry (accessed on 15 May 2018).
20. European Environment agency. Available online: https://www.eea.europa.eu/data-and-maps/indicators/overview-of-the-electricity-production-2/assessment-4 (accessed on 15 May 2018).
21 Gerdes, K.; Summers, W.M.; Wimer, J. Cost Estimation Methodology for NETL Assessments of Power Plant Performance. Report No. DOE/NETL-2011/1455 US Department of Energy, National Energy Technology Laboratories 2011.
22. Spallina, V.; Pandolfo, D.; Battistella, A.; Romano, M.C.; van Sint Annaland, M.; Gallucci, F. Techno-economic assessment of membrane assisted fluidized bed reactors for pure H2
production with CO2 capture. Eng. Convers. Manag. 2016, 120, 257–273.
23. Manzolini, G.; Macchi, E.; Gazzani ,M. CO2 capture in natural gas combined cycle with SEWGS.
Part B: Economic assessment. Int. J. Greenh. Gas Control 2013, 12, 502–509.
24. International Renewable Energy Agency (IRENA). Available online: https://www.irena.org/ (accessed on 15 May 2018).
25. European Commission. EuroStat, Statistics Explained. Available online:
http://ec.europa.eu/eurostat/statistics-explained/index.php/Main_Page (accessed on 15 May 2018).
26. FERRET. Available online: http://www.ferret-h2.eu (accessed on 15 May 2018).
27. ISO 14040. Available online: https://www.iso.org/standard/37456.html accessed on (15 May 2018).
28. ISO 14044. Available online: https://www.iso.org/standard/38498.html (accessed on 15 May 2018). 29. Masoni P., Zamagni A. Guidance Document for performing LCAs on Fuel Cells and H2
Technologies. Available online: https://www.fch.europa.eu/project/guidance-document-performing-lcas-hydrogen-and-fuel-cell-technologies (accessed on 15 May 2018).
30. DEMCAMER. Available online: http://www.demcamer.org/ (accessed on 15 May 2018). 31. European Environment Agency, Combined heat and power (CHP). Available online:
https://www.eea.europa.eu/data-and-maps/indicators/combined-heat-and-power-chp-1 (accessed on 15 May 2018).
32. Spath, P.L.; Mann, M.K. Life Cycle Assessment of Hydrogen Production via Natural Gas Steam Reforming.U. S. N. p., 2000, doi:10.2172/764485.
33. Ecoinvent. Available online: www.ecoinvent.ch (accessed on 15 May 2018).
34. De Nooijer, N.; Gallucci, F.; Pellizzari, E.; Melendez, J.; Pacheco Tanaka, D.A.; Manzolini, G. On concentration polarisation in a fluidized bed membrane reactor for biogas steam reforming: Modelling and experimental validation. Chem. Eng. J. 2018, 348, 232–243.
© 2019 by the authors. Licensee MDPI, Basel, Switzerland. This article is an open access article distributed under the terms and conditions of the Creative Commons Attribution (CC BY) license (http://creativecommons.org/licenses/by/4.0/).