ScienceDirect
Available online at Available online at www.sciencedirect.comwww.sciencedirect.com
ScienceDirect
Structural Integrity Procedia 00 (2016) 000–000
www.elsevier.com/locate/procedia
2452-3216 © 2016 The Authors. Published by Elsevier B.V.
Peer-review under responsibility of the Scientific Committee of PCF 2016.
XV Portuguese Conference on Fracture, PCF 2016, 10-12 February 2016, Paço de Arcos, Portugal
Thermo-mechanical modeling of a high pressure turbine blade of an
airplane gas turbine engine
P. Brandão
a, V. Infante
b, A.M. Deus
c*
aDepartment of Mechanical Engineering, Instituto Superior Técnico, Universidade de Lisboa, Av. Rovisco Pais, 1, 1049-001 Lisboa, Portugal
bIDMEC, Department of Mechanical Engineering, Instituto Superior Técnico, Universidade de Lisboa, Av. Rovisco Pais, 1, 1049-001 Lisboa, Portugal
cCeFEMA, Department of Mechanical Engineering, Instituto Superior Técnico, Universidade de Lisboa, Av. Rovisco Pais, 1, 1049-001 Lisboa, Portugal
Abstract
During their operation, modern aircraft engine components are subjected to increasingly demanding operating conditions, especially the high pressure turbine (HPT) blades. Such conditions cause these parts to undergo different types of time-dependent degradation, one of which is creep. A model using the finite element method (FEM) was developed, in order to be able to predict the creep behaviour of HPT blades. Flight data records (FDR) for a specific aircraft, provided by a commercial aviation company, were used to obtain thermal and mechanical data for three different flight cycles. In order to create the 3D model needed for the FEM analysis, a HPT blade scrap was scanned, and its chemical composition and material properties were obtained. The data that was gathered was fed into the FEM model and different simulations were run, first with a simplified 3D rectangular block shape, in order to better establish the model, and then with the real 3D mesh obtained from the blade scrap. The overall expected behaviour in terms of displacement was observed, in particular at the trailing edge of the blade. Therefore such a model can be useful in the goal of predicting turbine blade life, given a set of FDR data.
© 2016 The Authors. Published by Elsevier B.V.
Peer-review under responsibility of the Scientific Committee of PCF 2016.
Keywords: High Pressure Turbine Blade; Creep; Finite Element Method; 3D Model; Simulation.
* Corresponding author. Tel.: +351 218419991. E-mail address: [email protected]
2452-3216 © 2016, PROSTR (Procedia Structural Integrity) Hosting by Elsevier Ltd. All rights reserved. Peer review under responsibility of the Scientific Committee of PCF 2016.
10.1016/j.prostr.2016.06.285
Procedia Structural Integrity 2 (2016) 2277–2282
© 2016, PROSTR (Procedia Structural Integrity) Hosting by Elsevier Ltd. All rights reserved. Peer-review under responsibility of the Scientific Committee of PCF 2016.
10.1016/j.prostr.2016.06.285
ScienceDirect
Structural Integrity Procedia 00 (2016) 000–000
www.elsevier.com/locate/procedia
2452-3216 © 2016 The Authors. Published by Elsevier B.V.
Peer-review under responsibility of the Scientific Committee of ECF21.
21st European Conference on Fracture, ECF21, 20-24 June 2016, Catania, Italy
Optimization of the process parameters for the manufacturing of
open-cells iron foams with high energy absorption
Girolamo Costanza
a, Gjergj Dodbiba
b, Maria Elisa Tata
aaDipartimento di Ingegneria Industriale, Università di Roma Tor Vergata, Via del Politecnico 1, 00133 Roma - Italy bDepartment of System Innovation, The University of Tokyo, 7-3-1Hongo, Bunkyo-ku, Tokyo 113-8656 - Japan
Abstract
In this work the main results of the experimental research aimed to manufacture iron foams are reported. Iron powders (base metal) have been mixed with urea (filler agent) in different relative amounts (60% Fe- 40% urea, 50-50, 40-60 and 30-70) and then compressed in a cylindrical die in order to obtain a compact precursor. After compaction, the filler agent has been removed from each precursor in boiling water. The successive manufacturing step has been sintering and for this operation the optimum temperature has been found at 950 °C. Finally such foams have been subjected to compressive tests. Different amounts of Fe and urea match with different density and mechanical behavior in compressive tests. Energy absorbed during deformation has been calculated from the stress-strain compressive curve. Plateau stress, total strain and absorbed energy during deformation have been found strictly dependent from the iron/urea ratios.
© 2016 The Authors. Published by Elsevier B.V.
Peer-review under responsibility of the Scientific Committee of ECF21. Keywords: Cellular metals, Manufacturing, Iron foams, Mechanical Characterization. 1. Introduction
Metal foams are a relatively new class of materials (Banhart 2001, Costanza et al. 2003) and different production processes for their manufacturing have been developed during the last years. The most common one starts from powders of the base metal, mixed together with a foaming agent (TiH2) and a stabilizing agent (SiC). After compaction the precursor is inserted in a oven set at temperature higher than the melting point so that foaming can occur in few minutes. The powder mix composition is extremely important for the Al foam morphology (Costanza et al. 2008) but the main limit is due to the melting point of the base metal that in such production process must be in good agreement with the decomposition temperature of the blowing agent. An alternative process, developed for
high melting temperature alloys, in which the base metal and the filler agent are mixed and compacted together (Zhao 2001) has been defined. After removal of the filler agent, in the successive manufacturing steps, some voids airbubble-like lay equally distributed in the volume (Costanza et al. 2011, Deqing et al. 2003, Ip et al. 1999). Dealing with applications, metal foams are usually employed for light structures (Costanza et al. 2004, Costanza et al. 2008), according to the weight reduction up to 80% of the base metal, mechanical strength and stiffness, high energy absorption structures in compressive tests (Banhart et al 1998, Costanza et al. 2012, Olurin et al. 2000; Yi et al. 2001), crushing (Seitzberger et al. 1997) and finally thermal, acoustic and vibrational insulation. Fe (Park et al. 2001), Al (Costanza et al. 2005, Costanza et al. 2015) and Pb (Irretier et al. 2005, Costanza et al. 2013) and their alloys are the most commonly foamed metals. Recently also metal tubes filled with foams have been characterized by means of compressive tests (Bonaccorsi et al 2010, Costanza et al 2014, Costanza et al 2015).
2. Materials and experimental
In this work open-cell foams production has been performed by Sintering – Dissolution Process (Zhao et al. 2001, Costanza et al. 2011). SDP method consists in the following four steps processes: mixing, compacting, dissolution and sintering. The SDP technique has been adopted and suitable modified according to the Fe main characteristics. The base materials are Iron (>99%) powders (70 µm average diameter), Urea (2 mm average diameter) as filler agent and acetone as a binder. The choice was driven not only by the easy dissolution process (water at 100 °C is enough) but also by the relative low cost. Before compaction, Fe powders, filler and the binder have been mixed (five minutes is enough) to obtain a uniform distribution of both components. After mixing acetone binder was evaporate in the air. In order to obtain precursors, powder mixtures were compacted in a mould, by means of hydraulic press, choosing the optimum load for crushing superficial oxide on powders, applying up to 680 MPa. Before sintering the obtained precursor has been successively washed in hot water (100 °C) in order to remove the filler (urea). The successive step of this process has been sintering. Many experiments have been performed and an optimal temperature and time have been identified (950 °C for 30 minutes) for sintering process in order to obtain a satisfying compressive behavior of manufactured foams. Sintering times shorter than 30 min were not sufficient to ensure adequate bonding and sintering time longer than 30 min may lead significant oxidation of Fe matrix. Different compositions of Fe and urea % were considered. In this paper the main results about 60-30 % Fe and 40-70 % urea will be showed. Out of these ranges it has not been possible to manufacture satisfying foams. For each composition three samples have been produced to confirm the reproducibility of the results. In specimens having the same composition a low scattering of data has been observed.
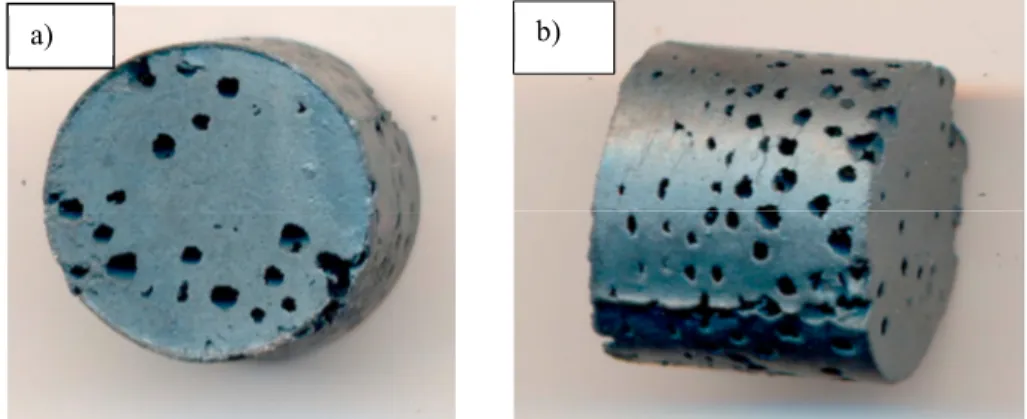
An example of iron foam performed with SDP method with 60% of iron and 40% of urea is shown in Figure 1.
Fig. 1. (a) iron foam 60% Fe-40% urea, front view; (b) iron foam 60% Fe-40% urea, lateral view. 3. Results and discussion
Compression tests were carried out on cylindrical samples (φ = 15 mm, h = 12 mm). The parallelism between the two platens was adjusted through the examination of the contact surface between them before the compression test.
a) b)
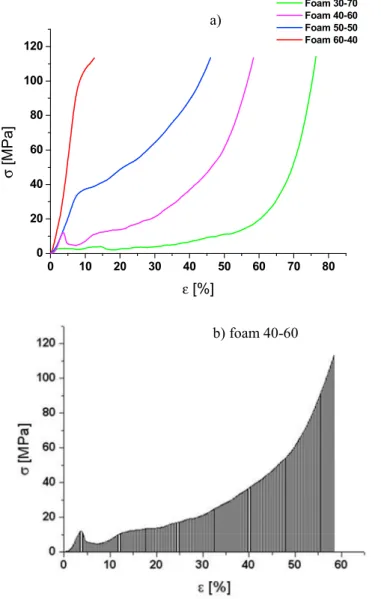
For each sample, the compression test was performed with MTS Insight 50 kN machine and a crosshead speed of 2 mm/min has been selected with a data acquisition frequency of 5 Hz. The main results of compression tests are reported in Figure 2 for foam manufactured with different composition: 60% Fe-40% urea, 50% Fe-50% urea, 40% Fe -60% urea, 30% Fe -70% urea. The compression curves show a strong dependence of the behaviour from the Fe amount (and consequently from the density of the foam), in particular the elasto-plastic limit, the value of the plateau stress and the level of strain on which the final densification occurs. The lower the Fe amount in the foam the lower the foam density and consequently the lower (in term of stress and strain) the elasto-plastic limit while longer strain under constant deformation load and lower plateau-stress appear.
Fig. 2 (a) Stress-strain curve of Iron foam with different composition: 60% Fe-40% urea, 50% Fe-50% urea, 40% Fe-60% urea, 30% Fe-70% urea. (b) The absorption energy by unit volume, corresponding to the area under the stress-strain curve.
The trend of the curves is strictly dependent on the relative amount Fe-urea: in terms of mechanical behaviour (σ-ε curve, plateau stress, total strain %) a good compromise between composition and performance of the compressive strength is represented by 40% Fe-60% urea foam. Despite the small load fall, probably due to the inhomogeneous distribution of pores, and then the initial failure of some wall porosity, the foam shows excellent strength properties,
b) foam 40-60 0 10 20 30 40 50 60 70 80 0 20 40 60 80 100 120 σ [ MP a] ε [%] Foam 30-70 Foam 40-60 Foam 50-50 Foam 60-40 a)
high melting temperature alloys, in which the base metal and the filler agent are mixed and compacted together (Zhao 2001) has been defined. After removal of the filler agent, in the successive manufacturing steps, some voids airbubble-like lay equally distributed in the volume (Costanza et al. 2011, Deqing et al. 2003, Ip et al. 1999). Dealing with applications, metal foams are usually employed for light structures (Costanza et al. 2004, Costanza et al. 2008), according to the weight reduction up to 80% of the base metal, mechanical strength and stiffness, high energy absorption structures in compressive tests (Banhart et al 1998, Costanza et al. 2012, Olurin et al. 2000; Yi et al. 2001), crushing (Seitzberger et al. 1997) and finally thermal, acoustic and vibrational insulation. Fe (Park et al. 2001), Al (Costanza et al. 2005, Costanza et al. 2015) and Pb (Irretier et al. 2005, Costanza et al. 2013) and their alloys are the most commonly foamed metals. Recently also metal tubes filled with foams have been characterized by means of compressive tests (Bonaccorsi et al 2010, Costanza et al 2014, Costanza et al 2015).
2. Materials and experimental
In this work open-cell foams production has been performed by Sintering – Dissolution Process (Zhao et al. 2001, Costanza et al. 2011). SDP method consists in the following four steps processes: mixing, compacting, dissolution and sintering. The SDP technique has been adopted and suitable modified according to the Fe main characteristics. The base materials are Iron (>99%) powders (70 µm average diameter), Urea (2 mm average diameter) as filler agent and acetone as a binder. The choice was driven not only by the easy dissolution process (water at 100 °C is enough) but also by the relative low cost. Before compaction, Fe powders, filler and the binder have been mixed (five minutes is enough) to obtain a uniform distribution of both components. After mixing acetone binder was evaporate in the air. In order to obtain precursors, powder mixtures were compacted in a mould, by means of hydraulic press, choosing the optimum load for crushing superficial oxide on powders, applying up to 680 MPa. Before sintering the obtained precursor has been successively washed in hot water (100 °C) in order to remove the filler (urea). The successive step of this process has been sintering. Many experiments have been performed and an optimal temperature and time have been identified (950 °C for 30 minutes) for sintering process in order to obtain a satisfying compressive behavior of manufactured foams. Sintering times shorter than 30 min were not sufficient to ensure adequate bonding and sintering time longer than 30 min may lead significant oxidation of Fe matrix. Different compositions of Fe and urea % were considered. In this paper the main results about 60-30 % Fe and 40-70 % urea will be showed. Out of these ranges it has not been possible to manufacture satisfying foams. For each composition three samples have been produced to confirm the reproducibility of the results. In specimens having the same composition a low scattering of data has been observed.
An example of iron foam performed with SDP method with 60% of iron and 40% of urea is shown in Figure 1.
Fig. 1. (a) iron foam 60% Fe-40% urea, front view; (b) iron foam 60% Fe-40% urea, lateral view. 3. Results and discussion
Compression tests were carried out on cylindrical samples (φ = 15 mm, h = 12 mm). The parallelism between the two platens was adjusted through the examination of the contact surface between them before the compression test.
a) b)
For each sample, the compression test was performed with MTS Insight 50 kN machine and a crosshead speed of 2 mm/min has been selected with a data acquisition frequency of 5 Hz. The main results of compression tests are reported in Figure 2 for foam manufactured with different composition: 60% Fe-40% urea, 50% Fe-50% urea, 40% Fe -60% urea, 30% Fe -70% urea. The compression curves show a strong dependence of the behaviour from the Fe amount (and consequently from the density of the foam), in particular the elasto-plastic limit, the value of the plateau stress and the level of strain on which the final densification occurs. The lower the Fe amount in the foam the lower the foam density and consequently the lower (in term of stress and strain) the elasto-plastic limit while longer strain under constant deformation load and lower plateau-stress appear.
Fig. 2 (a) Stress-strain curve of Iron foam with different composition: 60% Fe-40% urea, 50% Fe-50% urea, 40% Fe-60% urea, 30% Fe-70% urea. (b) The absorption energy by unit volume, corresponding to the area under the stress-strain curve.
The trend of the curves is strictly dependent on the relative amount Fe-urea: in terms of mechanical behaviour (σ-ε curve, plateau stress, total strain %) a good compromise between composition and performance of the compressive strength is represented by 40% Fe-60% urea foam. Despite the small load fall, probably due to the inhomogeneous distribution of pores, and then the initial failure of some wall porosity, the foam shows excellent strength properties,
b) foam 40-60 0 10 20 30 40 50 60 70 80 0 20 40 60 80 100 120 σ [ MP a] ε [%] Foam 30-70 Foam 40-60 Foam 50-50 Foam 60-40 a)
with a good trend of the curve: a 50% deformation, for example, corresponds to a high stress value, equal to 60 MPa. In the figure below (fig.3) the aspects of foams with different composition are shown. It’s evident that the amount of porosity is most relevant in the foam with larger amount of urea (70%).
The energy absorption capacity is defined as the energy necessary to deform a sample up to a specific strain level. The absorption energy by unit volume of a sample can be evaluated by integrating the area under the stress-strain curve as showed in figure 2 b) for the 40-60 foam. Results of density and energy absorption in compressive tests are reported in Fig. 4 a) and b) for the selected composition Fe-Urea.
Fig. 3 Images of foam with different composition: 60% Fe-40% urea, 50% Fe-50% urea, 40% Fe-60% urea, 30% Fe-70% urea The smaller Fe amount the lower weight and density of the manufactured foams. Weight and density are the most important parameters for the evaluation of the foam quality. As reported in Fig. 4 a) the 40-60 foam shows a density of 2,77 g/cm3, corresponding to a 65% reduction of weight in comparison with massive iron. It is an extremely significant result, taking into account also the good mechanical properties shown in the compression test (Fig. 2 a).
In general, the higher the urea amount, the lower the density of the foam. The best foam considering only the porosity is represented by the 30-70 one. Voids appear homogeneous and equally distributed and in terms of mechanical characteristics it is corresponding with the lowest plateau stress and highest deformation strain. By the way this solution doesn’t represent the best result in terms of energy/density ratio, as shown in Fig. 4 b).
As reported in Fig. 5 a linear relationship between the deformation strain and the density has been found: the higher the density the lower the deformation strain and vice versa. For what concerns the specific absorbed energy (energy / density) the highest value has been achieved in the 50-50 foam in combination with the intermediate
60% Fe - 40% Urea 40% Fe-60% Urea
50% Fe-50% Urea 30% Fe-70% Urea
measured values of both stress and strain. For extremal values (high stress and low strain, 60-40 foam; high strain and low stress, 30-70 foam) the specific energy is always lower.
Fig. 4 (a) ρ density (g/cm3) of foam with different composition: 60% iron-40% urea, 50% iron-50% urea, 40% iron-60% urea, 30% iron-70%
urea. (b) The energy/density ratio (J g / cm3) for the 4 considered foams on the left.
Tab. 1 Physical properties comparison Physical properties
60 Fe – 40 Urea 50 Fe – 50 Urea 40 Fe – 60 Urea 30 Fe – 70 Urea
Weight (g) 9,19 7,34 5,38 3,3 Diameter (mm) 15 15 15 15 Surface (mm2) 176,6 176,6 176,6 176,6 Height (mm) 12 11,5 11 10 Volume (mm3) 2.120 2.031 1.493 1.766 Density (g/cm3) 4,3 (-45%) 3,6 (-55%) 2,8 (-65%) 1,8 (-76%)
Fig. 5 Energy, density of foam with different composition: 60% Fe-40% urea, 50% Fe-50% urea, 40% Fe-60% urea, 30% Fe-70% urea.
0
1
2
3
4
5
Density 60-40 Density 50-50 Density 40-60 Density 30-70 0 5 10 15 20 25 60-40 50-50 40-60 30-70Density(g/cm3) Energy / density ratio
4. Conclusion
The accurate evaluation of the mixture composition is fundamental for the prediction of foams mechanical properties which are strongly dependent on the Fe and urea amount and consequently on the foam density. The compression tests have shown the optimal mechanical strength of the manufactured Fe foams and their energy absorption ability. The porosity amount is strictly connected to the greater presence of urea and, just looking to the density and the deformation strain, the 30-70 foam represents the best composition. But in the evaluation of the overall performance of the foam it is necessary to take into account also other properties, that are: energy absorption, deformation strain and plateau stress. From this point of view other solutions offer a good mix of physical and mechanical properties; between the analyzed ones in this work also the 40-60 and the 50-50 foam must be considered.
Acknowledgements
We would like to thank Mr. Piero Plini and Mr. Benedetto Iacovone for technical support during mechanical testing.
References
Banhart J., 2001. Manufacture, characterization and appllication of cellular metals and metal foams. Progress in materials science 46 (6), 559-632.
Banhart J., Baumeister J., 1998. Deformation characteristics ofg metal foams. Journal of Materials Science 33 (6), 1431-1440.
Bonaccorsi L., Proverbio E., Raffaele N., 2010. Effect of the interface bonding on the mechanical response of aluminium foam reinforced steel tubes. Journal of materials science 45 (6), 1514-1522.
Brugnolo F., Costanza G., Tata M.E., 2015. Manfacturing and characterization of AlSi foams as core materials. Procedia Engineering 109, 219-227.
Costanza G., Gusmano G., Montanari R., Tata M.E., 2003. Manufacturing routes and applications of metal foams. Metallurgia Italiana 95 (2), 31-35.
Costanza G., Quadrini F., Tata M.E., 2004. Pressure effect on Al alloy cast behaviour: microstructures and mechanical properties. International Journal of Materials and Product Technology, 20 (5-6), 345-357.
Costanza G., Montanari R., Tata M.E., 2005.Optimization of TiH2 and SiC content in Al foams. Metallurgia Italiana 97 (6), 41-47.
Costanza G., Gusmano G., Montanari R., Tata M.E. Ucciardello N., 2008. Effect of powder mix composition on Al foam morphology. Proceedings of the Institution of Mechanical Engineers, Part L: Journal of Materials: Design and applications 222 (2) 131-140.
Costanza G., Tata M.E., 2008. Dynamic and static compressive behaviour of aliminium foam. Proceedings of the 4th International Structural
Engineering and Construction Conference,ISEC 4- Innovations in Structural Engineering and Construction 2, 919-922. Costanza G., Tata M.E., 2011. Metal foams: recent experimental results and further developments. Metallurgia Italiana 103 (3), 3-7.
Costanza G., Mantineo F., Missori S., Sili A.,Tata M.E., 2012. Characterization of the compressive behaviour of an Al aluminuum foam by X-Ray computerized tomography. TMS Light Metals, 533-536.
Costanza G., Tata M.E., 2013. Recycling of exhaust batteries in lead-foam electrodes. TMS Annual Meeting, 272-278.
Costanza G., Mantineo F., Sili A., Tata M.E., 2014. Characterization of Cu tube filled with Al alloy foam by means of X-Ray computer tomography. TMS Annual Meeting, 613-620.
Costanza G., Sili A., Tata M.E., 2015. Mechanichal characterization of AISI 316 tubes filled with Al alloy foams. Metallurgia Italiana 107 (3), 9-14.
Deqing W., Ziyuan S., 2003. Effect of ceramic particles on cell size and wall thickness of aluminum foam. Materials Science and Engineering A 361 (1-2), 45-49.
Ip S.W., Wang Y., Toguri J.M., 1999. Aluminium foam stabilization by solid particles. Canadian metallurgical quarterly 38 (1), 81-92. Irretier A., Banhart J., 2005. Lead and lead alloy foams. Acta materialia 53 (18), 4903-4917.
Olurin O.B., Fleck N.A., Ashby M.F., 2000. Deformation and fracture of aluminium foams. Materials Science and Engineering A 291 (1-2), 136-146.
Park C., Nutt S.R., 2001. Effect of process parameters on steel foam synthesis. Materials Science and Engineering A, 297 (1-2), 62-68.
Seitzberger M., Rammerstorfer F.G., Degischer H.P., Gradinger R., 1997. Crushing of axially compressed steel tubes filled with aluminum foam. Acta Mechanica 125 (1-4), 93-105.
Yi F., Zhu Z., Zu F., Hu S., Yi P., 2001. Strain rate effects on the compressive property and the energy-absorbing capacity of aluminum alloy foams. Materials Characterization 47 (5), 417-422.