ALMA MATER STUDIORUM - UNIVERSITÀ DI BOLOGNA
SCUOLA DI INGEGNERIA E ARCHITETTURA
Dipartimento di Ingegneria Civile, Chimica, Ambientale e dei Materiali Ingegneria civile
TESI DI LAUREA
in
Context-Sensitive Design In Transportation Infrastructures
“The role of paved surfaces in the Urban Heat Island
phenomenon: assessment of fundamental thermal parameters
and Finite Element Analysis for UHI mitigation”
CANDIDATO: RELATORE:
David Matricardi Dott. Ing. Cesare Sangiorgi
CORRELATORI: Dott. Ing. Valentina Di Maria Dr. Mujib Rahman
Anno Accademico 2013/14 Sessione III
3
TABLE OF CONTENTS
ABSTRACT ... 7
INTRODUCTION ... 11
1. THE UHI PHENOMENON ... 13
1.1 Surface Urban Heat Island ... 13
1.2 Atmospheric Urban Heat Island ... 14
1.3 Solar Reflectance ... 18
1.4 Solar Reflectance Index (SRI) ... 19
1.5 Emissivity ... 20 1.6 Heat Capacity ... 20 1.7 Other Factors ... 21 1.7.1 Urban Geometry ... 21 1.7.2 Anthropogenic Heat ... 22 1.7.3 Weather ... 22
1.7.4 Geographic Location And Topography ... 23
1.8 Impacts ... 23
1.8.1 Energy Consumption ... 23
1.8.2 Air Quality ... 23
1.8.3 Human Health And Comfort ... 23
1.8.4 Water Quality ... 24
1.9 Mitigating Urban Heat Island ... 24
1.9.1 Cool Pavements ... 25
4
2.1 Thermal imaging camera ... 29
2.1.1 Finding the emissivity ... 34
2.1.2 Measuring the temperature ... 36
2.2 Sunshine Pyranometer for testing ... 39
2.3 Thermocouples ... 41 2.4 Meteorological station ... 44 3. EXPERIMENTAL WORK ... 47 3.1 Laboratory testing ... 48 3.1.1 Tested material ... 48 3.1.2 Emissivity evaluation ... 50
3.1.3 Heat release curves ... 55
3.2 Outside investigation ... 64
3.2.1 Emissivity evaluation ... 66
3.2.2 Albedo measurements ... 71
3.2.3 Temperature readings ... 78
4.CASE STUDY MODELLING ... 81
4.1 ENVI-met software (version 3.1) ... 81
4.1.1 Software architecture ... 81
4.1.2 Simulation models ... 90
4.1.3 Surfacing materials used ... 97
4.1.4 Urban canyon simulations ... 105
4.1.5 Heat basin simulations ... 113
4.1.6 Annex 1: urban canyon simulations bar charts ... 128
4.1.7 Annex 2: urban heat basin simulations bar charts ... 129
CONCLUSIONS ... 131
5
7
ABSTRACT
This thesis work has been carried out during the Erasmus exchange period at the Nottingham Trent University’s Academic School of Architecture, Design and the Built Environment in Nottingham, United Kingdom.
Nowadays the environmental issues and the climatic change play fundamental roles in the design of urban spaces. Our cities are growing in size, many times only following immediate needs without a long-term vision. Consequently, the sustainable development has become not only an ethical but also a strategic need: we can no longer afford an uncontrolled urban expansion. One serious effect of the territory industrialisation process is the increase of urban air and surfaces temperatures compared to the outlying rural surroundings. This difference in temperature is what constitutes an urban heat island (UHI).
The purpose of this study is to provide a clarification on the role of urban surfacing materials in the thermal dynamics of an urban space, resulting in useful indications and advices in mitigating UHI.
With this aim, 4 coloured concrete bricks were tested, measuring their emissivity and building up their heat release curves using infrared thermography. Two emissivity evaluation procedures were carried out and subsequently put in comparison. Samples performances were assessed, and the influence of the colour on the thermal behaviour was investigated.
In addition, some external pavements were analysed. Albedo and emissivity parameters were evaluated in order to understand their thermal behaviour in different conditions. Surfaces temperatures were recorded in a one-day measurements campaign.
ENVI-met software was used to simulate how the tested materials would behave in two typical urban scenarios: a urban canyon and a urban heat basin. Improvements they can carry to the urban microclimate were investigated.
Emissivities obtained for the bricks ranged between 0.92 and 0.97, suggesting a limited influence of the colour on this parameter. Nonetheless, white concrete brick showed the best thermal performance, whilst the black one the worst; red and yellow ones
8
performed pretty identical intermediate trends. De facto, colours affected the overall thermal behaviour.
Emissivity parameter was measured in the outdoor work, getting (as expected) high values for the asphalts. Albedo measurements, conducted with a sunshine pyranometer, proved the improving effect given by the yellow paint in terms of solar reflection, and the bad influence of haze on the measurement accuracy.
ENVI-met simulations gave a demonstration on the effectiveness in thermal improving of some tested materials. In particular, results showed good performances for white bricks and granite in the heat basin scenario, and painted concrete and macadam in the urban canyon scenario. These materials can be considered valuable solutions in UHI mitigation.
KEYWORDS:
Urban Heat Island, thermal imaging, emissivity, urban canyon, painted materials
Questo elaborato di tesi è stato realizzato durante il periodo di scambio Erasmus presso l’Academic School of Architecture, Design and the Built Environment della Nottingham Trent University, Nottingham, Regno Unito.
Al giorno d'oggi le questioni ambientali e il cambiamento climatico rivestono un ruolo fondamentale nella progettazione degli spazi urbani. Le nostre città crescono in dimensione, molte volte solamente seguendo immediate necessità senza una visione di lungo termine. Conseguentemente, lo sviluppo sostenibile è diventato non solo una questione di etica, ma anche una necessità strategica: non possiamo più permetterci un’espansione urbana incontrollata. Un grave effetto del processo di industrializzazione territorio è l'aumento della temperatura dell'aria e delle superfici urbane rispetto alle zone rurali periferiche. Questa differenza di temperatura è ciò che costituisce un’ isola di calore urbana (UHI).
9
Lo scopo di questo studio è quello di chiarire il ruolo dei materiali da pavimentazione urbani nelle dinamiche termiche di uno spazio urbano, con conseguenti indicazioni e consigli utili a mitigare l’UHI.
A tal fine sono stati testati 4 mattoni in calcestruzzo colorato misurando la loro emissività e costruendo le curve di rilascio del calore, tramite l’utilizzo della termografia a infrarossi. Sono state testate due procedure di valutazione dell’emissività e successivamente messe a confronto.
Sono quindi state valutate le performance dei campioni ed è stata studiata l’influenza del colore sul comportamento termico.
Sono state inoltre analizzate alcune pavimentazioni esterne. Per capire il loro comportamento termico in differenti condizioni, sono stati valutati i parametri di albedo ed emissività. È stata effettuata una campagna di misure giornaliera al fine di raccogliere le temperature superficiali.
Il software ENVI-met è stato utilizzato per simulare il comportamento dei materiali testati in due tipici scenari urbani: un canyon urbano e un bacino di calore urbano. Quindi sono stati studiati i miglioramenti che tali materiali potrebbero portare al microclima urbano.
Le emissività ottenute per i mattoni si sono attestate tra 0.92 e 0.97, suggerendo una limitata influenza del colore su questo parametro. Tuttavia, il mattone bianco ha mostrato la miglior prestazione termica, mentre il nero quella peggiore; il rosso e il giallo hanno avuto prestazioni quasi identiche. De facto, i colori influenzano il comportamento termico complessivo.
Il parametro di emissività è stato misurato nella fase esterna di ricerca, ottenendo (come previsto) valori elevati per gli asfalti. Le misure dell’albedo, condotte con un piranometro, hanno dimostrato l’effetto migliorativo della vernice gialla in termini di riflessione solare, e la cattiva influenza della foschia nella precisione di misura.
Le simulazioni con ENVI-met hanno dato dimostrazione sull’efficacia nel miglioramento termico di alcuni materiali testati. In particolare, i risultati hanno mostrato buone prestazioni per i mattoni bianchi e per il granito nello scenario del bacino di calore, e per il cemento e il macadam dipinti nello scenario del canyon urbano. Tali materiali possono essere considerati valide soluzioni nella mitigazione dell’UHI.
11
INTRODUCTION
Nowadays the environmental issues and the climatic change play fundamental roles in the design of urban spaces. In fact, the 80% of the world population will live in cities until 2030 [1], worsening the overpopulation problem and so the quality of life. Consequently, the sustainable development has become not only an ethical but also a strategic need: we can no longer afford an uncontrolled urban expansion.
Two serious linked effects of this matter are the raise of the micro-scale environmental temperature and the increase of the heat waves frequency and duration, carrying dangerous ripercussions such a bigger electric power consumption, more health problems for sensitive subjects (children and elderly people), increasing of atmospheric pollution and greenhouse gases, deteroration of water quality. In particular, many urban and suburban areas experience elevated temperatures compared to the outlying rural surroundings; this difference in temperature is what constitutes an urban heat island (UHI) (fig.1) [2]. As already determined in previous researches, the temperature difference between urban and suburban areas, in a large one-million-people city, can range between 1 and 3°C during the day, and reach up to 12°C in the night time [3,4].
Fig. 1: UHI temperature profile [5]
It is possible to recognize different causes leading to such phenomenon, but basically the main reason is the territory industrialisation process. In fact, the expansion of metropolitan areas results in an increase in the “grey surfaces” (mainly asphalt and
12
concrete) with a consequent loss of green areas. Urban surfacing materials, also due to their low reflectivity, tend to store short-wave radiation in the day time, and to release it during the night. So the air does not cool down, causing an overheating of low atmospheric layers through the convection process. Moreover these surfaces become impermeable and dry, abating the cooling effect of evapotranspiration. Also the urban geometry has its own effects: buildings prevent the cooling effect of wind, hindering the natural air recirculation. The UHI presence is particularly noticeable in larger towns but it is quite evident even in the smaller ones, although the effect decreases as the urban size decreases [6].
The main purpose of the research is to test some paving materials able to mitigate the UHI phenomenon and to provide a general improvement to the micro-scale climate. Basically the experimentation had three phases. The first one, conducted at the Architecture, Design and Built Environment Academic School’s laboratory of the Nottingham Trent University (Maudslay building, City Campus), consisted in testing four concrete coloured interblocks in order to evaluate their thermal behaviour. The second one, carried out in the external areas of the Nottingham Trent University’s City Campus, consisted in measuring the thermal parameters of different paving surfaces. The last one was the simulative phase: using a CFD software called “Envi-met”, the geometric model of the area and different improving scenarios have been developed.
In CHAPTER 1 a background on the Urban Heat Island phenomenon is provided, focusing on the factors affecting it and the impacts that it causes.
A description of the technical equipment used in the research is contained in CHAPTER 2, this section gives an explanation of the fundamental operating principles of the instruments.
CHAPTER 3 describes two fundamentals phase: the laboratory part, where the experimentation on some coloured bricks was carried out; the external part, where different surfacing materials were analysed.
All the simulations and the results worked out are contained in CHAPTER 4. Here the thermal performances of different paving materials were assessed.
The final analysis, deductions and recommendations are enclosed in the CONCLUSION.
13
CHAPTER 1:
THE UHI PHENOMENON
Many studies have been carried out in order to investigate the heat island effect providing full documentation of the problem [7,8,9,10,11]. In particular it is possible to recognize two different types of urban heat island, respectively the surface one and the atmospheric one [2]. To make a distinction between the two categories is important for getting a proper understanding of the causes and the effects so to identify the most adequate mitigation method. As established by different researches [3,4,12,13], they differ in the time they occur, in the intensity they affect the urban environment, in their identification techniques, in their rapresentation (tab.1).
Table 1: features of surface and atmospheric UHI [2]
1.1
Surface Urban Heat Island
It refers to the difference in temperature between dry and exposed urban surfaces (such as roofs and pavements) and shaded and moist surfaces (as natural vegetated ground in the rural surroundings). The first ones can reach temperatures 27 to 50°C hotter than the air, whilst the second ones tend to remain close to the atmospheric temperature [14]. Tipically the effect is more accentuated during the day, when the temperature difference can range between 10 and 15°C. During the night the difference is less intense (5 to 10°C) [12]. The detection and measure of the UHI are conducted using both direct and indirect methods, for instance with thermographic measurement techniques or remote sensing. Besides researchers often use numerical models or estimates based on
14
empirical models. Usually all the data collected contribute to work out thermal images of the analyzed area (fig.2).
Figure 2: surface temperature in Boston, Massachusetts [15]
1.2
Atmospheric Urban Heat Island
It is characterized by the temperature air difference between the urban area and the rural surroundings. Its variation is less significant than the surface UHI: it has been suggested that, on an annual mean basis, air temperature in large cities can be 1 to 3°C warmer than those of their rural surroundings [2]. The effect is more significant after sunset whereas during the day it manifests itself weakly, due to the thermal inertia of surfacing materials and their consequent slow heat release. With reference to different space volumes in city, this UHI type can be further divided in two sub-categories: Canopy Layer UHI and Boundary Layer UHI. The first one occurs in the space volume where people live, namely from the ground to the top of buildings and trees. The second one extends from the rooftops to the height where the built-up area no longer affects the atmosphere (typically no more than 1.5 km from the surface) [6]. The canopy UHI is usually the category to which UHI studies refer, and so does this research.
The surface UHI affects the atmospheric one through the thermal exchange between surfaces and air, especially in the canopy layer (closer to the ground). In fact, the convection process cools down the air in a vegetated area (due to the moisture and to the
15
consequent evapotranspiration) and warms up it in a dense built-up area, where the impervious materials make possible to collect water and to brought it away. Thanks to the continuous mixing within the atmosphere, the air temperature tends to remain more constant than the surface temperature. In particular, the larger variations between the two trends occur during the day, whilst they both are fairly similar at night. The presence of bodies of water, due to the high heat capacity, abates the temperature changes between daytime and nighttime (fig.3).
Figure 3: comparison between air and surface temperature trends [2]
Regarding the measurement techniques adopted by the researchers, the direct ones occupy a primary importance. The easiest and most reilable method is to determine the air temperatures through a dense network of sampling points from fixed or mobile stations [2]. Data are then graphically represented in order to give an immediate and clear understanding of the real condition. For istance, to draw an isotherm map could give a good idea of the situation (fig.4).
16
Figure 4: conceptual map with overlaid isotherms [2]
The formation of UHI involves many factors. The most important are the vegetation reduction, the urban materials thermal and radiative properties, the urban geometry, the anthropogenic heat emissions, the weather, the geographic location (tab.2).
Table 2: factors that produce UHI[2]
The lack of green area in cities has a significative impact on UHI problem. Trees provide shades able to keep surfaces cooler, protecting them from the solar radiation. Vegetation also helps to reduce the air temperature thanks to the evapotranspiration, that
17
is the process of dissipation of the latent energy of water turning it from its liquid to its vapour form. This phase change cools down the air surrounding. Built-up surfaces (paved surfaces, roofs, sidewalks, parking lots, roads) have a much more little ability to evaporate water (fig.5).
Figure 5: evapotranspiration in urban (left) and rural (right) areas [2]
Urban materials play a fundamental role in the UHI development. In particular their thermal performance influences the formation and the intensity of the phenomenon. The most important factors in this case are the solar reflectance, the thermal emissivity and the heat capacity. Sunlight reaches the Earth with a specific band of wavelength, the solar spectrum. It is composed of ultraviolet (UV) rays, visible (Vis) light, infrared energy (IR), and they reach the Earth respectively in 5% (including the part responsible for sunburns), 40% (with the visible colours wavelengths) and 55% (responsible for the heat sensation) of the total amount (fig.6).
18
Figure 6: solar energy composition [16]
1.3
Solar Reflectance
Also called Albedo, it is the ratio of solar radiation reflected by a surface to the total radiation reaching that surface. The albedo of an object is expressed in percentage, so it can range between 0 (0%) and 1 (100%). The first case refers to a situation of no reflection, typical of a black body (an object able to capture the total amount of the incoming radiation), while the second case means that the surface reflects the whole quantity of incoming radiation. For example, the planet Earth has an average albedo of 0.3 [17]. Darker surfaces present lower reflectivity values, so does the bigger part of urban surfacing materials (asphalt, concrete), increasing surfaces and air temperatures and worsening the UHI problem (fig.7). In fact, the material’s colour affects albedo, because much of the solar radiation occupies the visible part of the spectrum. Generally solar reflectance is measured with a solar reflectometer (ASTM C1549), a sunshine pyranometer (ASTM E1918) or using spectrophotometric measurements (ASTM E903 and E892).
19
Figure 7: urban albedos [18]
1.4
Solar Reflectance Index (SRI)
A good way to assess the thermal performance of a material is to calculate its SRI. According to ASTM E1980-01, SRI quantifies how hot a flat surface would get relative to a standard black (reflectivity 5%, emissivity 90%) and a standard white surface (reflectivity 80%, emissivity 90%). It ranges between 0 (standard black surface) and 100 (standard white surface) and is calculated as follows:
where Tblack , Twhite and Tsurface are the steady state of temperatures of the standard black, white and material surface respectively [19]. For example, the standard black has a temperature rise of 50 °C in full sun, and the standard white has a temperature rise of 8.1 °C. Once the maximum temperature rise of a given material has been computed, the SRI can be computed by interpolating between the values for white and black. It is expected to obtain high SRI values for materials with good thermal performances (“cool”) and low values for materials with bad performances (“warm”). For very bad thermal behaviour SRI can reach negative values and for very good behaviour it can have values greater than 100.
20
1.5
Emissivity
Emissivity, or thermal emittance, is a measure of how much long-wave radiation (infrared) is emitted from an object, compared to that from a perfect black body of the same temperature [20]. This parameter can assume values between 0 (perfect reflector-mirror) and 1 (perfect emitter-black body), and is dependent on temperature, wavelength and surface condition. Typically a highly polished surface falls below 0.1, while an oxidized or painted surface has a higher emissivity. Oil-based paint, regardless of colour in the visible spectrum, has an emissivity over 0.9 in the infrared. Human skin exhibits an emissivity 0.97 to 0.98 (tab.3). In general metals tend to have low values, increasing with temperature, while non-metals show high values, decreasing with temperature [20]. As a matter of facts, surfaces with high emissivity values will stay cooler, thanks to their fast heat release.
1.6
Heat Capacity
Another important parameter is the material’s heat capacity, that is its ability to capture and store heat. Typically construction materials (asphalt, concrete, brick) have higher values of heat capacity respect to natural materials (soil, sand), so the urban environment works as a big heat-storage, increasing the UHI. Despite urban materials generally have high emissivity values (so they dissipate heat quickly), they also have high heat capacity and low reflectivity, resulting in an overall bad thermal behaviour.
21
Table 3: Emissivity Values for Common Materials & Non-Metals [21]
1.7
Other Factors
1.7.1 Urban Geometry
Urban geometry produces different effects in thermal behaviour of built-up spaces. Buildings act like a shade for the solar radiation incoming, providing shadows that help surfaces to stay cooler. At the same time buildings obstruct the natural wind course, decreasing its cooling effect. Large and tall constructions prevent a ready heat release from surfaces, on the contrary they absorb this energy. This effect is noticeable especially during night time, when the air remains considerable warmer than the air over rural areas. Researchers usually refer to this with “urban canyon” effect. In fact, tall buildings lining narrow roads create corridors, providing shadows but absorbing energy irradiated from the surfaces (fig.8). In addition there is a reduction of city’s overall albedo. The effects of urban geometry on UHI are often described through the “sky view factor” (SVF), which is the visible area of the sky from a given point on a surface [2].
22
This parameter assumes values close to 1 if the area has few obstructions (so large part of the sky is visible), and approaches 0 when several objects (e.g. buildings) prevent the sky view.
Figure 8: urban canyons trap heat [22]
1.7.2 Anthropogenic Heat
Anthropogenic heat refers to the heat dissipated by the human activities. It includes several sources such as heating/cooling systems, running appliances, transportation and traffic, industrial processes, biological processes. In addition the exhaust gases, besides raising greenhouse layer, also increase localised temperature [2].
1.7.3 Weather
Atmospheric conditions play an important role in UHI development. In particular wind and cloud cover are the two main factors. In fact, UHI finds its most favourable condition with calm winds and clear skies as they maximize the amount of solar energy reaching urban surfaces and minimize the heat that can be convected away. On the contrary, strong winds and cloud cover penalize UHI. Nevertheless during winter it is possible to get benefits from the warming effect of UHI. For instance, higher temperatures prevent the formation of ice on the road, increasing safety.
23 1.7.4 Geographic Location And Topography
Geographic location determines topography and climate. Obviously latitude influences the amount of radiation reaching a location. As a matter of facts, large bodies of water (e.g. lakes, rivers) can moderate temperature and generate winds that take the heat away. Also mountains have their effects, blocking wind or generating patterns that pass through a city.
1.8
Impacts
1.8.1 Energy Consumption
High temperatures, due to the cooling need, lead to the increase of energy consumption, especially during the hot summer periods. This peak urban electric demand increases 1.5 to 2 percent for every 0.9 °C increase in summertime temperature [2]. UHIs tend to exacerbate the consequences of extreme heat waves, enhancing the risk of power outages and blackouts.
1.8.2 Air Quality
The increase of energy demand also results in worsening air pollution. Indeed, the most part of the electric power is produced in fossil-fuel-burning big plants, that release harmful substances in the atmosphere. These pollutants, dangerous for the health and cause of acid rains, include sulphur dioxide (SO2), nitrogen oxides (NOx), particulate matter (PM), carbon monoxide (CO) and mercury (Hg). These plants also produce greenhouse gases, particularly carbon dioxide (CO2), which contribute to global warming. Another result of overheating is the increasing of ground-level ozone (O3) formation, that is toxic for man. This molecule is produced when NOx and volatile organic compounds (VOCs) react in the presence of sunlight [2].
1.8.3 Human Health And Comfort
UHIs can bring different health problems and discomforts. In particular, increased daytime temperatures, reduced night-time cooling and higher air pollution levels can lead to health harms like respiratory difficulties, heat cramps and exhaustion, non-fatal heat stroke and heat-related mortality [2]. Furthermore, the phenomenon enhance the effect of heat waves on sensitive population, such as children, elderly people, people affected by heart diseases, increasing the risk from these extremely hot and wet events.
24 1.8.4 Water Quality
The overheating of urban surfaces due to UHI causes the transfer of the stored heat to the runoff water. This effect, called thermal pollution, degrades the water quality and brings the overheated water into storm sewers (fig.5). Then the water drains into streams, rivers, ponds and lakes, increasing the temperature of these ecosystems and altering the natural equilibrium. All the aspects of acquatic life are affected, especially the metabolism and reproduction of many acquatic species.
1.9
Mitigating Urban Heat Island
Urban climatologists are all agreed that three strategies can help to reduce the UHI effects: trees and vegetation, cool roofs and cool pavements. The benefits of trees and vegetation are quite obvious. Besides the fact that they provide shadow, they also have a cooling effect on the atmosphere, thanks to the evapotranspiration. Foliage also increases the overall albedo, reflecting a bigger part of solar radiation. Cool roof is a roofing system able to reflect the solar radiation keeping the exposed surfaces cool (fig.9). The method consists in the use of high reflective and high emissive materials, improving the building comfort and decreasing the energy consumption. Cool pavements is a compendium of techniques with the objective of improving of the urban climate. The aim of this research falling under this argument, so it is provided a focus on this specific subject.
25 1.9.1 Cool Pavements
“Cool pavements refer to a range of established and emerging materials. These pavement technologies tend to store less heat and may have lower surface temperatures compared with conventional products. They can help address the problem of urban heat islands, which result in part from the increased temperatures of paved surfaces in a city or suburb. Communities are exploring these pavements as part of their heat island reduction efforts” [25].
There are different possibilities to keep the pavement cool: Increase pavement surface reflectance
Albedo is one of the most important thermal parameters of a material. High albedo keeps the pavement cool as well as it reduces the temperature below the surface. In fact, less heat is available at the surface, so the conduction process brings less heat into the pavement layer.
Increase pavement emissivity
Emissivity, as well as albedo, plays a fundamental role in the thermal performance of a pavement, as it determines how readily the surface sheds heat. Improving this parameter is an important factor in mitigating UHI; nevertheless there are only limited options to adopt cool pavement practices that modify it, as most of the paving materials are innately characterized by high emissivity values [26].
Increase pavement surface convection
Convection is a process that transfers heat from the surface to the moving air on top of it. It depends on the speed and temperature of the air passing over the surface, pavement roughness, and the total surface area of the pavement exposed to air.
Reduce pavement thermal conductivity
Conduction is a process that transmit heat from the pavement surface to the underlying layers. Having a low conductivity value helps to restrict the heat to the first pavement layer, avoiding to store it.
26 Reduce pavement heat capacity
Heat capacity determines how much energy can absorbed and stored in the pavement at certain temperature. Built-up areas capture more solar energy than rural surroundings because urban materials have a bigger heat capacity respect of natural soils and vegetation. As a result, this heat is released during the night, worsening the UHI.
Evaporation cooling
The evaporation process needs energy in changing water phase from liquid to gas, cooling down a surface. Enhancing this phenomenon is a good strategy to contrast UHI.
Shading pavements
This practice is useful to protect the pavement from the sun radiation, decreasing the surfaces heating-up.
External active mechanical cooling
Other cooling options can be to incorporate pipes carrying water in the pavement, providing a cooling effect, or cooling through thermoelectric devices embedded in pavements.
There are different potential cool pavement types:
Conventional asphalt pavement
Typically conventional asphalt is not a virtuous thermal material in terms of UHI. It is possible to modify it with high albedo materials such as light-colored aggregate, colored asphalt by pigments, use of tree resin in place of bitumen. If the asphalt is already installed, it is possible to treat it in order to improve its thermal performance (e.g. raise albedo) applying light-colored coating, or chip seals, whitetopping (fig.10), ultra-thin whitetopping and microsurfacing with light-colored aggregate and/or emulsified polymer resin for maintenance [27].
27
Figure 10: whitetopping [28]
Conventional concrete pavement
Normally concrete pavement has a higher albedo than asphalt pavement. Nevertheless the parameter can be increased by using white cement, or cement blended with light color slag.
Permeable pavement
A permeable pavement is a layer with a high number of voids. Meteoric water, instead of staying on the surface, drains through the surface where is collected and carried away (fig.11). Permeable pavements include porous asphalt pavement, pervious concrete pavement, and bricks or block pavers (e.g. interblocks). In addition to the evaporation cooling effect, permeable pavements, thanks to the increased exposed surface (given by the voids and the roughness), create air turbulence over the surface able to facilitate the convection process.
28
Figure 11: permeable pavement [29]
With a cool pavement technique is possible to achieve several benefits [29]: Mitigate urban heat island(UHI) effect;
Reduce energy use and greenhouse emission;
Improve water quality and reduce stormwater runoff (for permeable pavement); Increase pavement life/durability and waste reduction;
Reduces pavement maintenance costs; Enhance night-time illumination; Comfort improvements;
Improve driving safety (for permeable pavement); Noise reduction.
29
CHAPTER 2:
INVESTIGATION EQUIPMENT
This section aims to provide a description of the instrumentation used to carry out the experimentation and a basic understanding of the theoretical rudiments behind the operating principles of these instruments.
2.1
Thermal imaging camera
A thermal imaging camera is a device able to read the objects temperatures. It works detecting the infrared radiation emitted by a surface and it forms a thermal image that represents a temperature map of the object. The working principle is the same of a common camera that forms an image using the visible light.
The instrument focuses the infrared heat energy and converts it into data which then can be displayed as visible images on a screen:
Infrared energy is emitted by an object (A).
Optics in the thermal imaging camera focus this energy on to its infrared detector where it is converted into data (B-C).
The thermal imaging camera’s detector sends the data to its sensor electronics which process images (D).
These images can then be viewed on a video monitor, LCD screen or a network-enabled computer (E) (fig.12).
Figure 12: image processing [31]
30
Thermal imaging cameras are very useful in several applications, from buildings to military. They can save money and even save lives. Typical uses are:
Industrial: identify malfunctions in electrical and mechanical systems. Inspect hot spots in engines, plants, avoiding production delays and saving money. Buildings: identify heat losses and construction defects, achieving energy
savings.
Boundaries security: provides adequate support to the surveillance personnel, helping in the fight against intrusions and contraband.
Security sector: protection of sensible areas like ports, airports, nuclear plants, storehouses, factories, properties.
Research and development: specific thermic devices to provide accurate and reliable means in the experimental field.
Nautical night view: uses in night-time navigation, rescue, fight against piracy. Vehicle night view: installation as drive assistance on cars, improving road
safety. Also utilized by firemen, in mines and military vehicles. Automation: continuous control of automatic industrial process. Security force: incognito watching operation.
Gas losses: searching for potential gas loss dangers.
Fauna observation: hunting or watching of animals in the night-time. Fire safety: firemen are able to look for people to rescue through the smoke. Medical applications: diagnostic of diseases and other general health problems
[33].
Testing was conducted using a FLIR B200 (figg.13,14). The device was used to get the emissivity parameter and the temperature of the samples and surfaces analysed.
31
The camera is able to calculate the temperature of the object catching the emitted infrared radiation from it. However, the radiation measured by the instrument is not only function of the temperature, but also of the emissivity of the material. In addition, there is a contribute deriving from the reflected quote of radiation in the surroundings that hits the object. Both these two factors are influenced by the absorption of the atmosphere. Consequently, to get a correct value of temperature, is necessary to consider the effects of different radiation sources. The camera is able to automatically compensate such factors, but it needs the following parameters:
The emissivity of the object
The reflected apparent temperature
The distance between the object and the camera The relative humidity
32
Figure 14: FLIR B200 technical specification [20]
It is possible to recognize three radiation contributions collected by the camera: the direct infrared radiation from the object, the radiation from the surroundings reflected via the object surface and the atmosphere contribution. In fact, the atmosphere absorbs part of the infrared emitted by the object and reflected by the object, attenuating them in the measurement path. This process is converted into a mathematic formula, used by the camera to correctly measure temperatures (fig.15).
33
Figure 15: radiation contribute: 1-surroundings; 2-object; 3-atmosphere; 4-camera [20]
Considering the blackbody theory, it is possible to write equation 1:
(1) where
Usource = camera output signal C = constant
W = received radiation power from a blackbody source Tsource = blackbody temperature
Typically the source is a graybody source with emittance ε, so the received radiation is εWsource. The three collected radiation power terms are:
1. Emission from the object = ετWobj, where ε is the emittance of the object and τ is the transmittance of the atmosphere. Tobj is the object temperature.
2. Reflected emission from the ambient sources = (1 – ε )τWrefl, where (1 – ε ) is the reflectance of the object. Trefl is the ambient temperature.
3. Emission from the atmosphere = (1 – τ)τWatm, where (1 – τ) is the emittance of the atmosphere. Tatm is the atmosphere temperature.
It is now possible to write the total received radiation power (equation 2):
34
It can be obtained equation 3 multiplying each term of equation 2 by the constant C of equation 1 and replacing the CW products by the corresponding U according to the same equation:
(3) Solving equation 3 for Uobj (equation 4):
(4)
This is the general measurement formula used in all the FLIR thermographic devices [19].
2.1.1 Finding the emissivity
In order to obtain the correct emissivity value is necessary to determine the reflected apparent temperature. This parameter is used to compensate for the radiation reflected in the object. According to the FLIR B200 manual (fig.16), the “Reflector method” was used (fig.17).
35
Figure 16: FLIR B200 reflector method for apparent temperature determination [20]
Figure 17: aluminum foil on the sample
Once determined the reflected temperature, the manual sets the steps showed in fig.18 to find the emissivity value.
36
Figure 18: steps to determine emissivity [20]
The manual also gives some advices useful to correctly determine the emissivity: Avoid forced convection
Look for a thermally stable surrounding that will not generate spot reflections Use high quality tape that you know is not transparent, and has a high emissivity
you are certain of
This method assumes that the temperature of your tape and the sample surface are the same. If they are not, your emissivity measurement will be wrong.
2.1.2 Measuring the temperature
To measure objects temperature is the main purpose of the thermal camera. In order to do that, the correct emissivity of the material must be set in the device. Besides, the distance from the analysed surface, the air humidity, the apparent reflected temperature must be provided to the camera (fig.19). Once all these parameters are set up, a photo from the correct distance from the object can be taken.
37
Figure 19: setting options [34]
On the LCD screen the correct temperature of a spot on the surface is already visualized, even before shooting. This feature is useful to have a preliminary idea. Subsequently, it is possible to analyse the photos with FLIR QUICK REPORTER, a specific software provided by FLIR (fig.20), and get the average temperature of the surface. In this way, it is also possible to obtain the emissivity value, by knowing the temperature of the piece of tape (emissivity set at 0.97) and changing the emissivity until getting the same temperature on the sample surface (see § 2.2.1) The software allows to change the setting parameters even after the photo has been taken.
38
39
2.2
Sunshine Pyranometer for testing
A pyranometer is a type of actinometer used to measure broadband solar irradiance on a planar surface and is a sensor that is designed to measure the solar radiation flux density (W/m2) from a field of view of 180 degrees [35]. Testing was conducted using a SPN1 Delta-T Sunshine Pyranometer (fig.21). The device was used to get the solar reflectivity (albedo) of the external surfaces analysed.
Figure 21: SPN1 Delta-T Sunshine Pyranometer
The SPN1 Sunshine Pyranometer uses an array of seven miniature thermopile sensors and a computer-generated shading pattern to measure the direct and diffuse components of incident solar radiation. The SPN1 Pyranometer computes direct radiation by subtracting the diffuse from the global (total) radiation [36]. The device has got one sensore with three output channels, designated to respectively assess the total solar radiation, the diffuse radiation and the sunshine status.
The measuring procedure, following the standard ASTM E1918-06, consists of:
The probe shall be fixed on an support (fig.22), that places the sonde sensor at a height of 50 cm above the surface. The arm shall be alligned such that it points toward the sun (this eliminates the shadows of the people conducting the test and minimizes the effect of the shadow from equipment). The pyranometer shall be parallel to the surface where measurement in conducted.
40
The pyranometer shall be faced upward (that is, looking directly away from the surface) to read incoming solar radiation.
After that it shall be flipped downward to read the reflected solar radiation. The readings have to be kept constant at least for 10 seconds. The measurements
of incoming and reflected radiation shall be performed in a time interval not to exceed 2 minutes.
Solar reflectance is the ratio of the reflected radiation to incoming radiation. The pairs of incoming and reflected radiation shall be repeated at least three
times.
The calculated solar reflectance from all the measurements shall agree within 0.01 in a reflectivity scale of 0.00 to 1.00.
Furthermore, the standard provides some recommendations:
Be sure that the investigated surface is large (circles, whith at least four meters in diameter or squares four meters on a side), homogeneous, low-sloped, such as roofs, streets and parking lots. The measurements shall be performed on dry surfaces.
Figure 22: pyranometer support
Cloud cover and haze significantly affect the measurements. The tests shall be conducted on a clear sunny day with no cloud cover or haze during the
41
individual measurements. To decide if the weather conditions are accettable, the standard provides some additionally information in the Annex section.
The test shall be done in conditions where the angle of the sun to the normal from the surface of interest is less than 45°.
In order to visualize and elaborate the data collected by the pyranometer, the device is provided with SunRead software (fig.23), able to read the SPN1 output values and status information via the PC RS232 serial port.
Figure 23: SunRead software
2.3
Thermocouples
A thermocouple is a temperature-measuring sensor composed by two dissimilar conductors that contact each other at one or more spots, where a temperature differential is measured by the different conductors. When the temperature of one spot differs from the reference temperature set in the device, it produces a voltage (proportional to temperature) called E.M.F. (electromotive force), displayed converted in a heat unit of measure (typically Celsius or Fahrenheit degrees). It is possible to represent the E.M.F. as follows:
42
(5) Where e is the E.M.F., α and β are constants of the thermocouple, T1 and T2 are the temperatures.
A thermocouple requires a reference junction, placed in series with the sensing junction. As the two junctions are at different temperatures a thermal E.M.F. is generated. The reference junction is used to correct the sensing junction measurement (fig.24).
Figure 24: schematic for a thermocouple/instrument connection [37]
The resulting voltage is proportional to the temperature difference between the two junction. This phenomenon is called Seebeck effect. It generates small voltages in the wire connecting the junctions, as great as the temperature gradient is. In practice the Seebeck voltage is made up of two components: the Peltier voltage generated at the junctions, plus the Thomson voltage generated in the wires by the temperature gradient. The Peltier voltage is proportional to the temperature of each junction while the
Thomson voltage is proportional to the square of the temperature difference between the two junctions. Each thermocouple has its characteristic Seebeck voltage curve, depending on the component metals, their purity, they homogeneity and their crystal structure [34].
In this research the thermocouples were installed inside the samples and on their surfaces. The resulting temperature were collected by a data logger (fig.25). Moreover, a portable thermocouple was used in the external activity (fig.26).
43
44
Figure 26: portable thermocouple
2.4
Meteorological station
Two different typologies of meteorological stations were used in this research: a portable hygro-thermometer humidity alert and a meteorological station.
The portable station model used is an Extech Hygro-Thermometer Humidity Alert w/Dew Point (fig.27,28). It measures the moisture and the temperature in both external and internal environments.
45
Figure 28: portable station technical specifications [38]
Other temperature data were collected from the meteorological station placed at the Nottingham High School, in Nottingham (fig.29). The Geography Academic Department has joined the Weather Underground global network, so a significant amount of data are available for free on the Weather Underground website, such as the temperature, the humidity, the wind direction and speed, the pressure [39].
47
CHAPTER 3:
EXPERIMENTAL WORK
The experimental part of this research was organized in two phases:1. LABORATORY TESTING: the thermal performances of a paving material were investigated, with the purpose of determining if it is a good material in terms of UHI mitigation. All the experimentations were carried out at the Maudslay Building Workshop of Nottingham Trent University’s Architecture, Design and the Built Environment Academic School, in Nottingham. The samples were tested using the FLIRB200 thermal camera and FLIR Quick Reporter software. The procedure of the test took place from March to May 2014.
2. OUTSIDE INVESTIGATION: the thermal performances of different urban surfaces were measured, in order to understand if the materials in which existing pavements are made of have a good thermal behaviour. All the measurements were collected near the Maudslay Building, on the Nottingham Trent University’s properties. The surfaces were tested using the FLIRB200 thermal camera and FLIR Quick Reporter software, the SPN1 Delta-T Sunshine Pyranometer, a portable thermocouple, the Extech Hygro-Thermometer Humidity Alert. The procedure of the test took place from May to July 2014.
48
3.1
Laboratory testing
Permeable paving bricks were tested. The samples were heated by an infrared lamp, and subsequently their thermal parameters were collected. Emissivity was measured, a significant thermal parameter of a material, able to represent its thermal performance. Two different emissivity evaluation procedures were compared: the thermal camera’s manual method and the thermocouples method. Then emissivity was used to measure the temperature of the specimens with the thermal camera, in order to build the heat release trends of the bricks.
3.1.1 Tested material
The material used for testing was the “MARSHALL PRIORA PERMEABLE BRICK”, concrete interblocks with the following dimensions:
Length 200 mm Width 100 mm Height 60 mm.
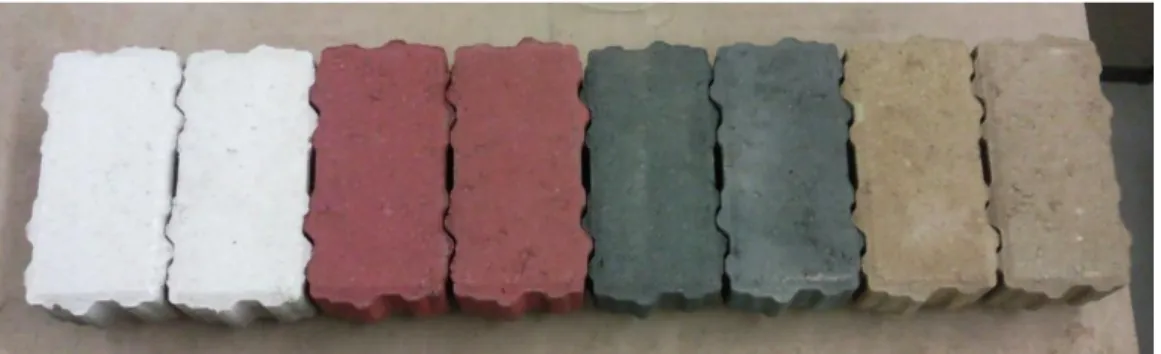
Four different colours of bricks were selected for testing, charcoal (black), red, white and yellow (fig.30). All samples were made of the same concrete mix, and were identical apart from colour. The white brick paint, unlike the others, was a shiny type (fig.31).
49
Figure 31: white sample shiny paint
The sample were instrumented with thermocouples sensor, three inside the bulk and five on the surface, all fixed with a thermo-stable glue (fig.32). The sensors were connected to a data logger that was automatically storing results at 10-minute intervals (fig.33). It was therefore possible to monitor and record the temperature variations inside the specimens and on their surfaces.
50
Figure 33: data logger
3.1.2 Emissivity evaluation
Two different emissivity measuring procedures were performed, aiming to understand if there is another effective method to get this fundamental thermal parameter. In fact, especially outside, it happens that the thermal camera’s manual procedure
(see § 2.2.1) can be difficult to execute, for a number of reasons. First of all, it is not always possible and practical to put a piece of electrical tape on the investigated surface. Besides, it takes a non-negligible amount of time, as the operator has to wait until the tape reaches the same temperature of the surface (if not, the method does not work properly). In addition there is an approximation given by the tape, as none can be sure about its emissivity. Finally, it could be useful to have another way to assess the parameter and so to have a comparison result. For these reasons, the thermocouples method was set up, using the surface thermocouples instead of the electrical tape.
THERMAL CAMERA’S MANUAL METHOD (see § 2.2.1)
Once all brick samples had been prepared they were placed on a table in the testing area. The testing area was environmentally monitored throughout the experiment for air temperature, reflective temperature and humidity; the bricks were elevated off the table surface using wooden blocks. The heat lamps were placed above the samples at a 30° angle. The lights were placed 600 mm above the top of the brick, allowing for localised heating onto the brick.
51
Following the manual, it was determined the apparent temperature with the reflector method and set it in the thermal camera. Two squares of a common black electrical tape were put on the surfaces of each brick. With the infrared lamp, the specimens were heated up for two hours, until reaching a temperature 20°C hotter than the room one (fig.34). Then the lamp was turned off.
Figure 34: heating up the bricks
Subsequently, the emissivity was set to 0.97 and a photo for each brick was taken. At this point, the correct value of temperature was calculated on the tape’s surface. FLIR Quick Reporter software was used to change the emissivity value until getting the same temperature recorded on the tape. The emissivity got is the correct value for the brick (fig.35).
52
Figure 35: FLIR QUICK REPORTER screenshots
The worked out emissivities are shown in Table 4.
Table 4: manual method emissivities
THERMOCOUPLES METHOD
As for the manual method, the reflector method was used to get the apparent temperature and set it in the thermal camera (§ 2.2.1). After the installation of the thermocouples sensors, the bricks were heated up with the infrared lamp on the same conditions of the previous case. Then the lamp was turned off and one photo for each sample was taken (fig.36). Using FLIR Quick Reporter software, the emissivity of the
53
sample was changed until getting the same temperature recorder by the data logger connected to the thermocouples.
Figure 36: thermal photos
The worked out emissivities are shown in Table 5.
Table 5: emissivities
COMPARISON BETWEEN THE TWO METHODS
The resulting emissivities are similar, so it is possible to assume both methods as consistent (fig. 37). In particular, the only value presenting a noticeable variation is the white one. As the Figure 38 shows, that difference is small: 4 % (fig.38). That disparity
54
was supposed due to the shiny type of paint on the white sample surface, that make the thermic photo acquisition more dependent on the little differences of the enlightenment conditions in the room.
Figure 37: worked out emissivities comparison
Figure 38: differences in emissivities values
It can be concluded that using the manual or the thermocouples method is a decision to take depending on the particular situation. For instance, in a controlled environment like a laboratory, the manual procedure could be a good solution as well as the
55
thermocouples one. On the other side, in an external situation it can be more practical to measure the temperature directly with a thermocouple, avoiding using the electrical tape, especially if the surface to investigate is not flat. In addition, a thermocouple can be installed permanently on the surface recording the temperature trend with a data logger, avoiding wastes of time waiting for reaching the same temperature between tape and surface. The important thing is to not forget to reach a 20°C difference in temperature between the sample and the environment, otherwise the thermal camera results could be inaccurate.
3.1.3 Heat release curves
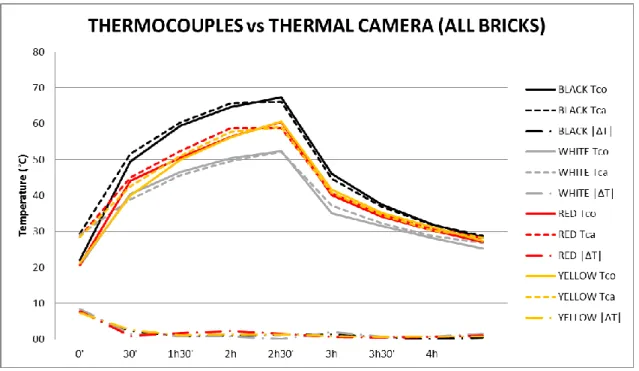
In order to understand the influence of surface colour on the thermal performances of the bricks, and the general thermal behaviour of concrete interblocks, the samples were heated and the left cooling down. Thanks to the thermocouples installed it was possible to record the temperature variation on the surface and the inside of the samples (see § 2.4). Moreover thermal images were taken at regular time intervals.
As mentioned, five thermocouples were installed on the bricks surface and other three inside the bulk (fig. 39).
56
The sensors were connected to a data logger able to record temperature at prearranged time intervals (10 minutes). The testing area was environmentally monitored throughout the experiment for air temperature, reflective temperature and humidity in order to not compromise results; the bricks were elevated off the table surface using blocks made of insulating material. The heat lamps were placed above the samples at a 30° angle. The lights were placed 600 mm above the top of the brick, allowing for localised heating onto the brick. The room temperature remained constant at 23°C.
The bricks were heated for two hours, with thermal photos being taken every half hour plus one shoot before turning on the lamp (fig.40). The data logger recorded the temperature every ten minutes. After two hours, the heat lamps were switched off and removed, and the cooling monitoring process began. Photos and temperatures were collected until two hours from the switch off, and four hours from the begin of testing.
57
Once all experimentations were completed, all data from the thermocouples and the thermal imaging was gathered and placed into excel tables and graphs. Measurements collected are shown below for each brick (tabs.6-7-8-9). After that, different comparisons between the samples thermal performances are illustrated.
THERMOCOUPLES RESULTS (ALL BRICKS)
BLACK p1 p2 p3 p4 p5 p6 p7 p8 Av. Surf. T
0' 22.1 21.8 22.5 21.5 22.1 19.9 19.9 19.9 22.0 10' 37.5 35.8 39.1 37.9 37.5 28.5 24.7 22.1 37.6 20' 44.5 42.6 46.4 45.1 44.1 35.6 31.1 27.6 44.5 30' 49.6 47.5 51.5 50.3 48.2 41.5 36.9 33.3 49.4 40' 53.2 51.8 56.0 53.9 51.6 46.3 41.8 38.3 53.3 50' 56.7 54.2 59.9 57.4 55.8 50.5 46.2 42.8 56.8 1h 59.6 57.6 62.4 59.9 57.7 53.9 49.7 46.4 59.5 1h10' 61.8 59.6 63.6 61.4 60.3 56.8 52.7 49.4 61.4 1h20' 63.6 61.4 66.7 63.7 61.8 59.2 55.2 52.0 63.5 1h30' 64.4 63.0 67.7 64.5 63.4 61.1 57.3 54.2 64.6 1h40' 65.5 63.7 68.3 65.2 64.1 61.9 58.0 55.0 65.4 1h50' 66.2 64.7 69.3 66.4 64.7 62.8 59.0 55.9 66.3 2h 67.4 65.8 71.1 67.3 65.5 64.3 60.6 57.5 67.4 2h10' 63.6 62.9 66.3 63.7 62.7 65.5 61.8 58.8 63.9 2h20' 50.7 50.6 51.5 49.7 49.2 57.2 57.7 57.7 50.3 2h30' 46.2 46.2 47.1 45.7 45.3 51.8 52.7 53.3 46.1 2h40' 42.5 42.8 43.7 42.4 42.1 47.5 48.3 48.9 42.7 2h50' 39.4 39.9 40.8 39.4 39.3 43.9 44.5 45.1 39.8 3h 37.4 37.7 38.4 37.1 37.2 40.8 41.4 41.8 37.6 3h10' 35.3 35.6 36.1 35.0 35.1 38.2 38.7 39.1 35.4 3h20' 33.6 33.8 34.2 33.5 33.0 36.0 36.4 36.8 33.6 3h30' 32.0 32.1 32.5 31.8 31.6 34.1 34.4 34.7 32.0 3h40' 30.8 30.8 31.0 30.4 30.3 32.4 32.7 32.9 30.6 3h50' 29.6 29.6 29.8 29.2 29.1 31.0 31.2 31.4 29.5 4h 28.5 28.4 28.6 28.1 28.2 29.7 29.9 30.1 28.4
58 WHITE pt1 pt2 pt3 pt4 pt5 pt6 pt7 pt8 Av.Sup.T 0' 21.0 20.7 20.4 20.4 20.4 20.3 20.3 20.3 20.6 10' 33.4 30.7 34.2 32.2 33.4 23.4 21.1 20.4 32.8 20' 37.8 34.8 38.6 37.3 37.5 27.6 24.5 23.4 37.2 30' 41.3 38.0 42.2 40.6 40.6 31.3 28.0 26.9 40.5 40' 43.5 40.3 44.1 42.7 42.7 34.1 30.9 29.8 42.7 50' 45.8 42.5 46.3 45.1 44.8 36.9 33.8 32.7 44.9 1h 47.5 44.2 48.2 46.8 46.4 39.2 36.2 35.1 46.6 1h10' 48.4 45.8 48.9 48.3 48.3 41.1 38.3 37.3 47.9 1h20' 50.2 46.9 50.8 49.8 48.9 42.7 39.9 38.9 49.3 1h30' 51.2 48.0 52.1 51.0 49.9 44.1 41.3 40.3 50.5 1h40' 51.7 48.8 52.6 51.9 50.6 45.2 42.4 41.5 51.1 1h50' 52.3 49.4 53.8 52.0 51.1 46.0 43.3 42.3 51.7 2h 53.0 50.3 54.4 52.7 51.6 47.0 44.3 43.4 52.4 2h10' 39.5 39.6 40.1 40.2 38.3 43.4 43.8 43.7 39.5 2h20' 37.2 37.5 37.6 37.4 36.7 40.7 41.3 41.5 37.3 2h30' 35.2 35.6 35.5 35.3 34.2 38.0 38.6 38.8 35.1 2h40' 34.2 34.5 34.2 34.0 33.2 36.5 37.1 37.2 34.0 2h50' 32.5 32.8 32.7 32.2 31.7 34.6 35.1 35.2 32.4 3h 31.6 31.8 31.8 31.3 30.9 33.3 33.7 33.8 31.5 3h10' 30.4 30.7 30.5 30.2 29.7 32.0 32.4 32.5 30.3 3h20' 29.3 29.5 29.4 29.0 28.5 30.5 30.9 30.9 29.1 3h30' 28.3 28.5 28.4 28.0 27.6 28.8 29.0 29.8 28.2 3h40' 27.4 27.5 27.5 27.1 26.6 26.9 27.8 28.1 27.2 3h50' 26.5 26.6 26.5 26.1 25.7 26.0 26.7 27.2 26.3 4h 25.5 25.6 25.6 25.3 24.7 24.9 25.4 26.4 25.4
59 RED pt1 pt2 pt3 pt4 pt5 pt6 pt7 pt8 Av.Sur.T 0' 21.3 21.0 20.5 20.3 20.3 20.2 20.3 20.2 20.7 10' 24.5 24.2 23.8 22.6 22.3 21.0 20.6 20.2 23.5 20' 38.3 38.7 39.5 37.3 37.5 27.4 24.0 22.7 38.3 30' 43.8 44.5 45.6 43.4 43.5 33.0 28.9 27.1 44.1 40' 45.3 46.8 47,3 45.4 45.7 35.2 30.5 29.6 45.8 50' 47.5 48.3 49.2 47.0 47.4 37.9 33.7 32.0 47.9 1h 50.2 50.8 51.7 50.5 49.8 41.7 37.7 36.0 50.6 1h10' 52.6 53.2 54.0 53.4 51.3 45.0 41.1 39.5 52.9 1h20' 54.9 55.2 55.7 54.3 53.9 47.9 44.1 42.5 54.8 1h30' 56.7 56.0 57.7 57.4 54.4 50.2 46.5 45.0 56.4 1h40' 58.1 57.6 58.7 58.6 56.1 52.1 48.6 47.1 57.8 1h50' 59.6 58.7 60.3 59.8 57.0 53.8 50.3 48.9 59.1 2h 61.3 60.3 60.2 62.2 58.6 56.5 53.1 51.8 60.5 2h10' 55.8 54.7 54.9 56.0 52.1 57.5 54.2 52.8 54.7 2h20' 44.5 42.5 44.9 44.6 41.9 50.5 51.2 51.5 43.7 2h30' 40.9 39.7 41.0 40.7 38.9 46.1 47.1 47.5 40.2 2h40' 38.7 37.7 38.0 38.5 37.1 42.9 43.8 44.2 38.0 2h50' 36.7 35.8 36.6 36.4 35.1 40.4 41.2 41.5 36.1 3h 34.6 33.9 34.7 34.5 33.2 37.7 38.5 38.7 34.2 3h10' 33.3 32.8 33.5 33.0 32.1 35.9 36.5 36.7 33.0 3h20' 32.0 31.5 32.0 31.5 30.6 34.1 34.7 34.8 31.5 3h30' 30.7 30.2 30.4 30.3 29.8 32.5 33.0 33.1 30.3 3h40' 29.8 29.5 29.7 29.3 28.9 31.3 31.7 31.8 29.4 3h50' 29.0 28.5 28.7 28.3 27.9 30.1 30.5 30.5 28.5 4h 27.6 27.3 27.3 27.0 26.6 28.3 28.6 28.6 27.1
60 YELLOW pt1 pt2 pt3 pt4 pt5 pt6 pt7 pt8 Av.T.Surf 0' 21.5 21.3 21 21 21 20.9 20.9 20.9 21.1 10' 24 23.6 23.1 21.9 22.4 21.4 21 20.9 23 20' 37.5 38.7 37.8 35.3 37.4 27.3 24.4 22.9 37.4 30' 40.3 39.6 41.6 38.4 40.2 29.9 25.8 24.3 40 40' 43.5 42.6 44.7 41.3 42.4 32.9 29.4 27.4 42.9 50' 47.3 46.6 48.6 45.2 46.5 37.9 34.3 32.2 46.8 1h 50.8 49.1 51.8 48.7 49.1 41.9 38.4 36.4 49.9 1h10' 53.5 51.7 54.6 51.1 51.7 45.5 42.2 40.3 52.5 1h20' 55.9 53.2 57.5 53.8 53.7 48.5 45.2 43.4 54.8 1h30' 56.9 55.3 58.4 54.9 55.4 50.7 47.5 45.7 56.2 1h40' 59.1 55.7 61.1 57.2 56.5 52.7 49.6 47.8 57.9 1h50' 59.5 57.3 61.4 57.8 57.8 54.3 51.3 49.6 58.8 2h 60.8 59.6 63.3 59.7 59.5 56.6 53.6 52 60.6 2h10' 55.7 53.4 58.3 56.3 53.5 58 55 53.4 55.4 2h20' 45.1 43.3 46.1 45.5 43.9 50.8 51.2 51.3 44.8 2h30' 42.1 40.6 43.4 42.2 40.3 46.7 47.3 47.7 41.7 2h40' 40 38.5 40.2 39.7 38.3 43.6 44.1 44.5 39.3 2h50' 37.5 36 38 37.1 36.2 40.8 41.3 41.6 37 3h 35.7 34.4 36.3 35.6 34.6 38.6 39.1 39.3 35.3 3h10' 34.2 33.2 34.6 34 33.2 36.6 37 37.2 33.8 3h20' 32.8 32.1 32.9 32.5 32 34.8 35.2 35.4 32.5 3h30' 31.4 30.8 31.8 31.1 30.8 33.2 33.5 33.7 31.2 3h40' 30.3 29.5 30.4 29.9 29.4 31.7 31.9 32 29.9 3h50' 29.4 28.9 29.6 29.3 28.9 30.8 31 31.2 29.2 4h 27.8 27.3 27.8 27.4 27.3 28.6 28.8 28.9 27.5
61
BRICKS SURFACE POINTS COMPARISON
Figure 41: average surface temperature for all bricks
Analysing the surface thermocouples measurements (fig.41) it is clearly visible that the black sample absorbed the greatest amount of heat, with a peak value of 67.4°C. This fact confirms how the darkest colours affects the thermal behaviour, determining how much energy will be stored and how much will be reflected. It is also clear that the white shiny paint on the white brick has a good cooling effect, reflecting a significant amount of heat. In fact, it reaches a peak of 52.4°C, a difference of 15°C with the black (22.3%). The red sample peak is 60.5°C, with a difference of 6.9°C (10.2%), the yellow is 60.6°C, with a difference of 6.8°C (10.1%).
The cooling part of the curves presents two distinct phases. The first one (immediately after turning off the lamp) shows a quick heat loss, due to the first layer of material cooling down. In this step, the samples lose, in 20 minutes, 17.1°C (25.4%) for the black, 16.8°C (27.8%) for the red, 15.8°C (26.1%) for the yellow and 12.9°C (24.6%) for the white. After this, a slower heat release in all the bricks is recorded, due to the progressive cooling down of the internal layers. It can be noticed how the yellow specimen and the red one show a pretty identical behaviour. Practically the intermediate colours do not significantly affect the thermal behaviour.
62
BRICKS INTERNAL POINTS COMPARISON
Figure 42: internal temperatures for all bricks
Looking at all the internal points temperature trends together (fig.42) it can be seen that the trends shape is similar for all the bricks, as the internal material is the same. The black one is the warmest, the white one the coolest. The red and yellow bricks have almost the same performance. It can be deducted that the black sample has the worst thermal behaviour, probably due to the high light absorbing capabilities of black colour. This means that the underlying layers would have a larger amount of heat received from the surface. Although choosing the yellow one or the red one could be the same, choosing the white one would give the best benefits.
![Fig. 1: UHI temperature profile [5]](https://thumb-eu.123doks.com/thumbv2/123dokorg/7448256.100839/11.892.143.767.692.1011/fig-uhi-temperature-profile.webp)
![Table 1: features of surface and atmospheric UHI [2]](https://thumb-eu.123doks.com/thumbv2/123dokorg/7448256.100839/13.892.136.759.514.784/table-features-surface-atmospheric-uhi.webp)
![Figure 3: comparison between air and surface temperature trends [2]](https://thumb-eu.123doks.com/thumbv2/123dokorg/7448256.100839/15.892.138.755.357.795/figure-comparison-air-surface-temperature-trends.webp)
![Figure 6: solar energy composition [16]](https://thumb-eu.123doks.com/thumbv2/123dokorg/7448256.100839/18.892.149.742.106.451/figure-solar-energy-composition.webp)
![Figure 14: FLIR B200 technical specification [20]](https://thumb-eu.123doks.com/thumbv2/123dokorg/7448256.100839/32.892.133.781.98.809/figure-flir-b-technical-specification.webp)
![Figure 15: radiation contribute: 1-surroundings; 2-object; 3-atmosphere; 4-camera [20]](https://thumb-eu.123doks.com/thumbv2/123dokorg/7448256.100839/33.892.154.742.111.385/figure-radiation-contribute-surroundings-object-atmosphere-camera.webp)
![Figure 24: schematic for a thermocouple/instrument connection [37]](https://thumb-eu.123doks.com/thumbv2/123dokorg/7448256.100839/42.892.154.755.417.642/figure-schematic-thermocouple-instrument-connection.webp)