Alma Mater Studiorum
· Universit`a di Bologna
SCUOLA DI SCIENZE
Corso di Laurea Magistrale in Astrofisica e Cosmologia
Dipartimento di Fisica e Astronomia
MULTIFREQUENCY VLBA OBSERVATIONS OF
TWO COMPACT SYMMETRIC OBJECTS
Tesi di Laurea Magistrale
Candidato:
Sara Rastello
Relatore:
Chiar.mo Prof.
Daniele Dallacasa
Co-Relatore:
Dott.sa Monica Orienti
Sessione I
This Thesis work was done as part of the research activity of
the Istituto di Radioastronomia - Istituto Nazionale di
“To strive, to seek, to find, and not to yield.” Alfred, Lord Tennyson
Contents
Sommario 10
Abstract 12
1 Introduction 13
1.1 Active Galactic Nuclei . . . 13
1.1.1 AGN Paradigm . . . 14
1.2 Radio Loud AGN . . . 18
1.2.1 Physical Structure . . . 18 1.3 Radio Galaxies . . . 19 1.4 Thesis project . . . 22 1.4.1 Thesis Outline . . . 22 2 CSS, GPS and HFP 25 2.1 Synchrotron Spectrum . . . 25
2.2 Compact Radio Sources . . . 31
2.3 Classification . . . 32
2.4 The Radio Spectra . . . 33
2.5 Radio Morphology . . . 35 2.6 Polarization . . . 36 2.7 Age . . . 38 2.7.1 Radiative Age . . . 38 2.7.2 Kinematic Age . . . 39 2.8 The Models . . . 40 2.8.1 Frustration Scenario . . . 40 2.8.2 Youth Scenario . . . 41 3 Radio Observations 47 3.1 VLBI . . . 47
3.1.1 Very Long Baseline Array . . . 48
3.2 The Dataset . . . 51
3.3 Introduction to Calibration . . . 53
3.4.1 A priori calibration . . . 55
3.4.2 Fringe fitting . . . 58
3.4.3 Bandpass Calibration . . . 59
3.4.4 Imaging and self calibration . . . 60
4 Data Analysis 65 4.1 Multifrequency Images . . . 65 4.1.1 J1944+5448 . . . 66 4.1.2 J0111+3906 . . . 69 4.2 Observational Parameters . . . 73 4.2.1 J1944+5448 . . . 74 4.2.2 J0111+3906 . . . 75 4.3 Morphological Description . . . 77 4.3.1 J1944+5448 . . . 77 4.3.2 J0111+3906 . . . 79 5 Discussion 81 5.1 Physical Parameters . . . 81 5.1.1 J1944+5448 . . . 83 5.1.2 J0111+3906 . . . 84 5.2 Multi-Epoch observations . . . 85 5.2.1 J1944+5448 . . . 85 5.2.2 J0111+3906 . . . 89 5.3 Age . . . 92 5.3.1 J1944+5448 . . . 92 5.3.2 J0111+3906 . . . 94 5.4 Symmetries . . . 95 5.4.1 J1944+5448 . . . 95 5.4.2 J0111+3906 . . . 97 5.5 Spectral Analysis . . . 98 5.5.1 J1944+5448 . . . 98 5.5.2 J0111+3906 . . . 99 5.6 J0111+3906, really young? . . . 114 Conclusions 120
A Physical parameters in radio sources 123
Bibliography 130
Acknowledgements 131
Sommario
Osservazioni radio ad alta risoluzione con tecniche “Very Long Baseline Interferometry” (VLBI) hanno portato alla scoperta di una sotto-classe di AGN Radio Loud (RL) chiamati “Oggetti Compatti Simmetrici” (CSO). Questi oggetti sono radio galassie estremamente compatte con dimensioni lineari minori generalmente del kpc e molto simili, morfologica-mente parlando, alle potenti radio galassie FRII. Un’ulteriore propriet´a di questi oggetti compatti riguarda lo spettro radio, che ´e solitamente convesso. In base alla frequenza di turnover nello spettro radio questi oggetti sono stati classificati come Compact Steep Spectrum (CSS), che hanno un turnover a frequenze minori di un GHz, Gigahertz Peaked Spectrum (GPS), con un turnover intorno al Gigahertz e infine High Frequency Peaker (HFP) che comprende sorgenti il cui turnover sta oltre il Gigahertz. Principalmente esi-stono due tipi di scenari che spiegano la natura di questi oggetti compatti ma molto simili a radio galassie evolute: il modello della Frustrazione e il modello della Giovinezza. Se-condo il primo scenario, le CSO sono sorgenti evolute come le FRII, con et´a di circa 106 7 anni ma la cui espansione attraverso il mezzo inter stellare (ISM) ´e stata ostacolata dalla presenza di un gas particolarmente denso. La crescita di questi oggetti ´e stata dunque limitata e la loro evoluzione ed espansione confinata nelle regioni interne delle galassie ospiti. Osservazioni IR e X del mezzo galattico non hanno per´o evidenziato nessuna anomalia nella densit´a del mezzo e inoltre le galassie ospiti delle CSO sono molto simili a quelle delle FRII, con le stesse propriet´a fisiche. Per questo motivo, il modello della frustrazione non viene pi´u adottato dato che non esiste prova dell’esistenza di un gas cos´ı denso, capace di confinare la crescita di questi oggetti. Il secondo modello, scenario della giovinezza, invece a↵erma che le CSO sono compatte perch´e sono giovani con una et´a di circa 103 4 anni e non si sono ancora evolute espandendosi nell’ISM. In particolare, le
CSO rappresentano la fase “appena nata” di FRII e sono galassie in cui l’attivit´a nucleare ´e stata attivata da poco. Col tempo le CSO si espanderanno prima attraverso il mezzo della galassia ospite e successivamente in quello inter galattico ed evolveranno come FRII. In questa tesi sono state analizzate le due CSO J1944+5448 e J0111+3906 con l’intento di studiare le loro propriet´a morfologiche e spettrali. I dati a disposizione sono relativi a osservazioni multi frequenza in banda L, C e X ottenute con il Very Long Baseline Array (VLBA) nel 2008. I dati sono stati analizzati col software AIPS tramite il quale ´e stato possibile eseguire le procedure di calibrazione, editing e infine di produzione delle immagini. La sorgente J1944+5448 ´e stata osservata in banda C e X, ed entrambe le
immagini prodotte mostrano che ´e una sorgente con struttura doppia/tripla e asimmetrica caratterizzata da due brillanti hot spot in direzione Est e Ovest, un nucleo centrale e due lobi estesi in direzione Est e Ovest. Anche J0111+3906 ´e una sorgente doppia/tripla e asimmetrica con due hot spot in direzione Nord Est e Sud Ovest, un nucleo e un getto molto brillante allineato con la hot spot di Nord Est. Questa sorgente ´e stata analizzata in banda L, C e X e in aggiunta sono stati scaricati dall’archivio i dati in banda U (da cui sono state ricavate le immagini) realizzati dal progetto MOJAVE. Una volta definita la morfologia e i parametri osservativi, sono stati ricavati i principali parametri fisici di entrambe le sorgenti come la luminosit´a, l’energia totale e il campo magnetico. Questo permette di arricchire la conoscenza delle principali propriet´a di questi oggetti compatti. Osservazioni multi epoca sono state analizzate per determinare la velocit´a di separazione delle hot spot e il rate di espansione per queste sorgenti. Un volta nota la velocit con cui queste sorgenti si espandono stato possibile ricavare le et´a per entrambe le sorgenti. Per la radio galassia J1944+5448 ´e stato possibile confrontare l’et´a cinematica con quella spettrale e il risultato mostra il buon accordo di questi valori. Per la sorgente J0111+3906 solo l’et´a cinematica ´e stata calcolata. Entrambi i risultati ottenuti relativi all’et´a di queste sorgenti mostrano che sono e↵ettivamente oggetti molto giovani con et´a di circa 102 3 anni, a conferma del modello della giovinezza. Per quanto riguarda le asimmetrie, una volta ottenuti i valori della velocit´a delle hot spot rispetto al nucleo centrale, tramite l’assunzione di equilibrio di pressione tra il mezzo esterno e le hot spot si ´e determinata la densit´a del mezzo esterno. Il risultato ottenuto per entrambe le sorgenti rispecchia l’idea che la disomogeneit´a del mezzo esterno sia la principale responsabile della forma asimmetrica di questi due oggetti, dal momento che essi sono completamente immersi nel gas della galassia ospite. Infine stato analizzato lo spettro radio della sorgente J0111+3906. Dal momento che lo spettro convesso di questi oggetti si ritiene sia dovuto principalmente ad auto-assorbimento di sincrotrone (SSA), il primo step ´e stato quello di modellare lo spettro di J0111+3906 con questo meccanismo. Dai risultati, quindi dalla frequenza di turnover e dal flusso di picco ottenuti si ´e ricavato il campo magnetico e si ´e confrontato il suo valore con quello di equipartizione precedentemente calcolato. Si ´e trovato che i valori erano in buon accordo tra loro. Successivamente lo spettro di J0111+3906 ´e stato modellato assumendo che il turn over spettrale sia dovuto ad assorbimento libero-libero (FFA), che pu´o in alcuni casi essere responsabile del profilo, nella regione otticamente spessa, dello spettro radio. I risultati del fit con FFA non sono stati particolarmente buoni e considerando anche il confronto tra i campi magnetici ottenuti utilizzando i parametri del SSA, nel nostro caso favoriamo il modello SSA per la sorgente J0111+3906, come principale responsabile del turnover osservato. Va comunque sottolineato che una combinazione dei due meccanismi potrebbe essere in atto in questa sorgente.
Abstract
Multifrequency observations of Radio Loud Active Galactic Nuclei (AGN) discovered a fraction of radio sources which are unresolved on the arc-second scale and with a char-acteristic convex radio spectrum. According to the frequency of the spectral peak they have been termed Compact Steep Spectrum (CSS), GigaHertz Peaked Spectrum (GPS) or High Frequency Peakers (HFP) radio sources. Given the small angular size, their radio morphology has been determined by means of Very Long Baseline Interferometry (VLBI). It turned out that most objects look like small scale version of the powerful extended (hundred of kpc) Fanaro↵-Riley type II (FRII) radio galaxies (O’Dea 1998). In particular those with a clear core detection are known as Compact Symmetric Ob-jects (CSO). Their intrinsically small size is interpreted either in the Frustration Scenario (where the source growth is prevented by an anomalously dense Interstellar Medium of the host galaxy), or, in terms of Youth: the radio galaxy is small because young (Fanti et al., 1995) and it will develop and become larger and larger as it expands and ages. No evidence for a particularly dense medium has been found so far (Siemiginowska et al., 2005). On the other hand estimates of the radiative age (obtained considering the break frequency in the synchrotron spectrum) and the kinematic age (the time taken by the source to expand) of a number of objects confirmed that they are young (t 103 4yr).
The analysis of Compact Symmetric Objects is important for understanding the evolution of radio galaxies since they probably represent the early stage of evolved FRII.
In this thesis, two CSO, J1944+543 and J0111+3906, were analyzed with the aim of estimating their expansion rate, their age and their spectral properties. The observations were performed with the Very Long Baseline Interferometry (VLBA) in L, C and X bands. The data calibration and the image production were made using the software package NRAO Astronomical Image Processing Software (AIPS).
The multifrequency images obtained were used to derive the main morphological and physical parameters of these sources. J0111+3906 may be defined as a double/triple source where a central component and two bright hot spot (in the North-East and South West direction) are clearly visible. In this source also a bright jet is observable in the North-West direction. J1944+5448 may be defined a double/triple source as well. In this case the core, two bright hot spots and the two lobes are visible in the West and East directions. J0111+3906 is a very compact radio source with a linear size of about ⇠ 40 pc, while J1944+5448 is more extended (⇠ 170 pc). They are both asymmetric sources,
in particular J1944+5448 which has an arm-length-ratio of about⇠2.
Multi epoch observations were taken into consideration in order to investigate the expansion rate of these source. I estimated the hot spots separation speed of each source and compared the results with those found in the literature. The hot spot advance speed was used to derive the kinematic age of the two CSO. For J1944+5448 I derived also the spectral age making use of the break frequency in the spectrum of the lobes found by Murgia (2003) and using the equipartition magnetic field that I calculated for this source. The kinematic age and the radiative age in J1944+5448 are in very good agreement. Both these radio sources are young (103 yr), and in particular J0111+3906 is the youngest.
The asymmetric shape of these source may be due to the inhomogeneity of the ambient medium embedding these objects. In order to confirm this hypothesis, an analysis of the density of the ambient medium, by ram pressure and equipartition argument was carry on. This approach confirms the presence of a high density medium that has slowed down the hot spot advance speed and produced the asymmetric shape of these sources. The radio spectrum of J0111+3906 was obtained by multifrequency observations, considering the L, C X bands analyzed in this thesis and the observations in U band data archive obtained by the MOJAVE project (Lister et al., 2009). The radio spectrum of J0111+3906 was fitted both with a synchrotron self absorption model (SSA) and a free free absorption model (FFA) in order to derive the main mechanism responsible for the spectral turnover. From this comparison we favour that the SSA plays the main role in shaping the radio spectrum of J0111+3906 The analysis of J1944+5448 and J0111+3906 suggest that they are young radio sources embedded in a not homogeneous medium. The results confirm the Youth Scenario.
Chapter 1
Introduction
The aim of this Chapter is to introduce the main features of an Active Galactic Nucleus (AGN) considering the physical model (Section 1.1); particular attention is then reserved to the Radio loud (RL) AGN (Section 1.2). A sub-class of RL AGN, namely the radio galaxies, is then discussed in Section 1.3. An outline of the topics discussed in each Chapter is presented in Section 1.4 where, in addition, the main goals of this thesis work are presented.
1.1
Active Galactic Nuclei
Among all types of the extragalactic objects, Active Galactic Nuclei (AGN) are probably the most fascinating and peculiar ones. As a first approximation, AGN is a galaxy where the emission is originated in a powerful central engine and often outshines the emission found in normal (inactive) galaxies, coming from stars and interstellar matter. The high luminosity is produced in a very concentrated volume through physical processes related to the presence of a super massive black hole (SMBH) which is accreting material.
As it is shown in Fig. 1.1 the resultant spectral shape of an AGN is generally complex, extends at various observing bandwidth and it is di↵erent from the spectrum of a normal elliptical galaxy (Fg. 1.2), which could be described as a Black Body radiation.
1.1. ACTIVE GALACTIC NUCLEI CHAPTER 1. INTRODUCTION
Figure 1.2: Example of the spectrum of a non-active elliptical galaxy (M063), which is mainly black body.
1.1.1
AGN Paradigm
The innermost AGN structure has been deeply investigated by multifrequency observa-tions. The commonly accepted intrinsic paradigm which describes the AGN structure is provided in Fig. 1.3, according to which the main AGN components are described as follows:
Figure 1.3: Internal structure of an AGN.
CHAPTER 1. INTRODUCTION 1.1. ACTIVE GALACTIC NUCLEI
• Central Engine
Whit this term we refer to the SMBH hosted in the central part of the AGN. Its typical mass is MBH ⇡ 107 9M . Accretion of gas and dust onto a SMBH is the
most efficient method to extract energy from normal matter. This is the foremost way to power the AGN.
• Accretion Disk
As the gas falling onto the AGN has some residual angular momentum, it will form an accretion disk around the black hole. The simplest model for an accretion disk is that of a geometrically thin and optically thick disk, so that its spectrum can be ap-proximated by a blackbody (Shakura & Sunyaev, 1973). Thermal emission from this accretion disk is responsible for most of the soft X-ray, UV and optical continuum emission, depending on the mass of the black hole and on the accretion rate. The accretion disk is also the region where some of the outflows are thought to originate.
• Torus
The emission ranging from the accretion disk, can be obscured by a dust torus ex-tending for few parsec, which surrounds the central region. The torus is also the main supply source for the gas which eventually accretes onto the black hole. The obscuring torus is heated by the incident UV and X-rays radiation from the accre-tion disk. It has a very high opacity and is visible at IR wavelengths (Krolik & Pier, 1992).
• Broad Line Region (BLR)
The BLR lies close to the central engine and is confined inside 1 pc. It is composed by high density clouds whose density is about nBLR
e ⇡ 108 1011 cm 3. Since
the BLR’s emission lines are produced close to the BH they su↵er broadening and Doppler e↵ects. Spectral lines are broadened from a minimum of ⌫ 500 km s 1
to ⌫ 104 km s 1 (Tthis value is related to the Full Width Half Maximum,
FWHM of the lines shape, (Peterson et al., 1993)). The structure of the BLR con-sists of a central source emitting ionizing radiation roughly spherically, surrounded by distribution of clouds. The side of the cloud facing the central engine is thus highly ionized, while depending on its column density, it results less ionized or mostly neutral on the opposite (back side). Thus we observe the front emitting high-ionization lines from ions such as HeII, HeI, OVI, NV, and CIV, while the back
emits low ionization lines from MgII, CaII, OI, and FeII. These are some examples
of broad ionized lines of an AGN, but we can find also broad neutral lines such as H↵and H . The BLR is also unresolved even in the nearest AGN, so we do not
have enough information about its structure. The emission of the central part of the AGN has a direct influence on the emission line of the BLR. Indeed, flux variations of the central engine cause variations on the broad line emission. Thus, the latter
1.1. ACTIVE GALACTIC NUCLEI CHAPTER 1. INTRODUCTION
are delayed by the time spent by the light to travel from the central part to the BLR. The knowledge of the time delay and of the gas kinematics allows us to estimate the Black Hole mass with an accuracy of about a factor of three, (Peterson, 2006). This method is called Reverberation Mapping (Peterson, 1993).
• Narrow Line Region (NLR)
The Narrow Line region marks the “borderline” region of direct influence of the AGN. The NLR probably extends for 102 3 pc, partially outside the torus. It
is optically resolved and is formed by clouds with an electron density nNLR
e ⇡
102 104cm 3 that is lower than that found in the BLR. Spectral lines from the
NLR do not shown variability, reflecting the fact that they come from a more ex-tended region than the BLR. [OIII] and [SII] show narrow emission lines. Finally the most particular feature of the NLR regards the so called ’Ionization cones’. These are regions confined by the collimation of light from the nuclear source. Inside these cones the excitation conditions are roughly uniform but drop very rapidly outside (Antonucci, 1993). The commonly accepted idea is that the ionizing radiation com-ing from the central region has an axial symmetric distribution. This causes the cone-shaped structure of the ionized region of gas cloud that we observe. This last aspect was one of the major evidence of the preferential emission direction of the AGN, and gives support to the idea of an anisotropic emission from these particular objects.
The Unified Model
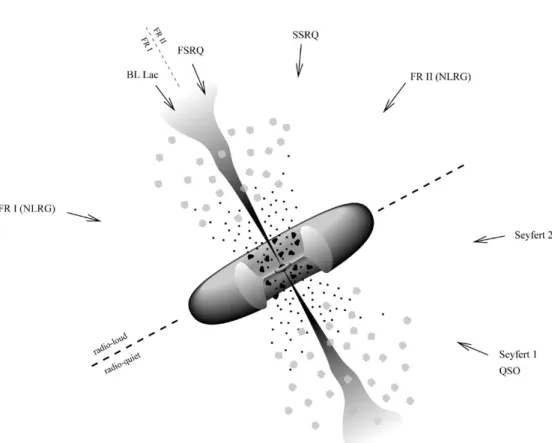
As discussed above, one of the key aspects of AGN is their anisotropic radiation, which derives from an anisotropic structure (Fig.1.3). This condition allows us to explain the di↵erent observational properties for the various zoology of AGN, under the assumption of an unique physical model: the Unified Model.
This geometrical model explains the di↵erences among Type 1 AGN (those with broad lines in the optical spectrum, and substantial UV and X-ray radiation) and Type 2 AGN (those with only narrow lines and little/no UV-Xrays) based on the line of sight (l.o.s.). In the latter the l.o.s crosses the molecular dusty torus which is optically thick to high energy radiation.
An illustration of this model is shown in Fig. 1.4 where in addition AGN are divided in two main classes depending on the radio and optical power. Based on the ratio between the emission at 5 GHz (radio) and the B-band (optical), AGN are classified as either Radio Loud (RL) or Radio Quiet (RQ) although this does not mean that they are radio silent. In fact, most of the more spectacular nearby radio sources (e.g. the Fanaro↵-Riley type I) would be classified as RQ despite being rather big and bright radio sources.
In the framework of this thesis we will focus our attention only on Radio Loud AGN, which we are going to describe in the following Section.
CHAPTER 1. INTRODUCTION 1.1. ACTIVE GALACTIC NUCLEI
Figure 1.4: AGN Unified Model (Urry & Padovani, 1995). In this cartoon the main classes of radio loud and radio quiet AGN are shown. FRI(NLRG) and FRII(NLRG): Fanaro↵-Riley tipe I and II (Narrow Line radio galaxy), FSRQ: Flat spectrum radio quasar, SSRQ: steep spectrum radio quasar.
1.2. RADIO LOUD AGN CHAPTER 1. INTRODUCTION
1.2
Radio Loud AGN
Radio Loud (RL) AGN represent a small fraction of all the AGN zoology. Roughly 15-20% of the observed AGN are Radio Loud (Urry & Padovani, 1995). The radio spectra of RL AGN is non thermal and is mostly due to the synchrotron emission and inverse compton of relativistic electrons.
The most characteristic feature in RL AGN is the presence of a bipolar outflow of relativistic plasma from the innermost regions which gives origin to two symmetric jets observed on scales ranging from the parsec up to the Mega-parsec.
1.2.1
Physical Structure
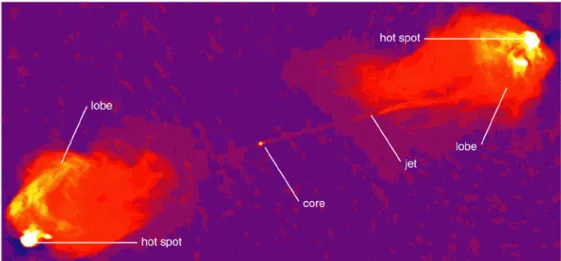
The physical structure of a RL AGN can be described by four main components, even if not all these components are present in all RL AGN. In addition, we have to take into account that the aspect of a source may depend on the angular resolution and the frequency of the observation. Considering Fig.1.5, the fundamental elements of the RL AGN structure are the following:
Figure 1.5: The di↵erent components of the RL AGN structure.
• JETS :
The jet is a collimated structure, often with a knotty aspect, where relativistic parti-cles and magnetic field ejected from the central region flow towards the surrounding medium. The spectral index is typically about ↵⇡ 0.7 (optically thin).
• CORE :
It is the central compact (sub-pc scale) component hosted in the central region of the optical host galaxy. It is interpreted as the place of origin of whole energy output of the source. The radio emission of the core is the closest to the SMBH. In addition,
CHAPTER 1. INTRODUCTION 1.3. RADIO GALAXIES
the core is the base of the jet in the transitional region between the optically thin and thick regime. Because its compact size the core spectrum is flat/inverted.
• LOBES :
They appear as large di↵use structures, symmetrically located with respect to the central core. They extend over tens of pc (Compact radio galaxies) up to Mpc (giant radio sources). Lobes usually show a low surface brightness compared to the other RL AGN components. Their radio spectra are steep with a spectral index (↵ 1), indicating the presence of old electron populations that are ageing in these structures without any re-acceleration (Murgia et al., 1999).
• HOT SPOTS :
In the powerful radio sources (see Section 1.3) as the jet collides with the surround-ing gas it drives a shock and creates the hot spots which appear as bright and compact regions located at the edge of the sources. They are usually well aligned with the central core. Hot spots have a typical power-law spectrum with spectral index ↵⇠ 0.5, ⇠ 0.8 indicating the presence of particle re-acceleration.
1.3
Radio Galaxies
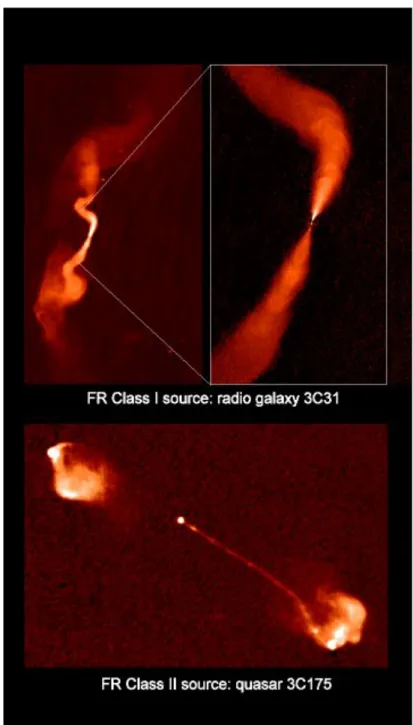
Radio galaxies represent an interesting sub-class of Radio Loud AGN. Taking into account their radio power and the physical components described in the previous section, radio galaxies are further divided into two sub-classes: Fanaro↵-Riley type I (FRI) and type II (FRII) as proposed by Fanaro↵ & Riley (Fanaro↵ & Riley, 1974). Classical FRI and FRII typically extend from a tens of kpc up to⇡ Mpc and their age is tAge⇡ 107yr. In order
to point out the morphological di↵erence between these two type of RL AGN, examples of FRI and FRII are shown in Fig. 1.6
• FRII: They show high radio power with P1.4Ghz 1024.5W Hz 1. Their lobes are
usually extended and with an elongated shape. They show bright and compact hot spots, so their luminosity increases towards the edge of the source. For this reason FRII are also called Edge Brightened radio galaxies (Fig.1.6 bottom). In the optical they are associated with either a galaxy or a quasar.
• FRI: They are radio sources with P1.4Ghz 1024.5W Hz 1. They show usually
two-sided jets, often symmetric, well visible and extremely bright. Usually FRI do not show hot spots, so their luminosity is more concentrated near the central region, and, for this reason, they are also called Edge Darkened radio galaxy. (Fig.1.6 top)
1.3. RADIO GALAXIES CHAPTER 1. INTRODUCTION
Figure 1.6: Two examples of RL AGN: a FRI (top) and a FRII (bottom).
CHAPTER 1. INTRODUCTION 1.3. RADIO GALAXIES
FRII usually show one-sided jet that is often weaker with respect to those of the FRI. Moreover the jet of FRII is relativistic with respect to the FRI. The di↵erence between the jet in FRI and FRII may be connected with a di↵erent energetic efficiency of the jet itself. This is strictly related to the BH efficiency of converting mass into energy (Owen & Ledlow, 1994). Either the particular ambient medium conditions with which the jets interact, or their initial energy power, or a combination of both, may produce observable di↵erences between the jets of FRII and FRI (Meliani et al., 2010).
The classification of FRII and FRI mentioned above, is completely independent of the source linear size. Alternatively, if we classify radio galaxies depending only on their linear dimension, we should find a sub-class of objects which extends on sub-galactic scales while sharing the same properties of the large extended radio galaxies.
These sub-class of radio sources includes compact radio loud AGN which will be the main topic of this thesis work.
1.4. THESIS PROJECT CHAPTER 1. INTRODUCTION
1.4
Thesis project
This thesis project focuses on the study of two compact radio loud AGN by using mul-tifrequency observations obtained with the VLBA. I will investigate the radio properties of these sources, estimate their kinematic age and, when possible, the spectral age. By multifrequency observations is possible to obtain the radio spectra of each component of these sources. In addition the analysis of the hot spot separation speed and the mor-phological features could help in order to investigate the ISM conditions. These pieces of information are important for improving our knowledge in their evolution within the host galaxy.
1.4.1
Thesis Outline
• Chapter 2 provides a detailed description of the main features of compact radio sources considering their radiative and morphological characteristics. In addition I explain the methods to compute the age of radio sources and I describe their mor-phology and their polarization properties. Finally I present the two models that try to explain the nature of these compact sources.
• Chapter 3 I give a description of the instrument used in this work, the VLBA, focusing on its main properties. Then I present the data sets used in this thesis work. The data underwent a series of process of calibration and reduction which is described in detail.
• Chapter 4 I present the multifrequency images obtained for each source. Then I show the main observational parameters estimated from the images of these compact sources. Then I describe the physical and morphological features of these source on the basis of the images and the parameters obtained.
• Chapter 5 I describe the physical parameters calculated for each source component such as the luminosity, the energy and the magnetic field. Then I describe the multi epoch observations analysis and discuss the results obtained from this approach.
CHAPTER 1. INTRODUCTION 1.4. THESIS PROJECT
The symmetries in the morphological structure of the two sources is discussed. Finally a detailed spectral analysis of one of the two radio galaxies is discussed with a comparison between two physical models.
Throughout all this thesis we assume H0= 71 km s 1Mpc 1, ⌦M= 0.27 and
1.4. THESIS PROJECT CHAPTER 1. INTRODUCTION
Chapter 2
CSS, GPS and HFP radio
sources
In this Chapter the key properties of intrinsically compact RL AGN are described. Section 2.1 gives a description of the properties of the synchrotron mechanism which is responsible for the radio emission of extragalactic radio sources. The general properties of compact radio loud AGN are described in Section 2.2. and Section 2.3 that gives a classification of these sources. Then the spectral and morphological features of compact objects are discussed (Section 2.4 and 2.5). The polarization features are described in Section 2.6. The method used to estimate the age are presented in Section 2.7. The models that explain the nature of these compact radio sources are presented in Section 2.8.
2.1
Synchrotron Spectrum
Synchrotron radiation is due to the acceleration of a population of relativistic particles in a magnetic field. The energy particle distribution is described by a simple power-law as:
N(E) = N0E (2.1)
N(E) is the number of particles with energy E, is the index of the power law and N0
is a constant. An electron population with this energy distribution produces a radio emission that is again a power law. The flux density S is directly related to the frequency ⌫ according to:
S(⌫)/ ⌫↵ (2.2)
In Eq.2.2, ↵ is the Spectral Index defined as ↵ = 1
2.1. SYNCHROTRON SPECTRUM CHAPTER 2. CSS, GPS AND HFP
Figure 2.1: Theoretical Synchrotron Spectrum
The radio spectra of radio sources usually are well represented by power-laws (Eq. 2.2), even if their spectra deviate from the theoretical one. In fact absorption becomes important when the photons transfer a large amount of their energy to the electrons. In this case the radio source becomes opaque to its own radiation. This process is called Synchrotron Self Absorption or SSA (see Fig. 2.1). It is related to the fact that the brightness temperature Te of the source becomes equal to the kinetic temperature Tk of
the electrons. In particular the kinetic temperature is: Tk⇡ E k / H 1/2 ? ⌫ 1/2 (2.3)
where E is the energy of the electrons, H? is the projection of the magnetic field along the velocity direction of the electrons and k is the Boltzmann constant. The brightness temperature is: Te= 1 2k B(⌫) c2 ⌫3 (2.4)
where B(⌫) is the synchrotron brightness, c is the speed of light. B(⌫) depends on the optical depth ⌧ as follows:
CHAPTER 2. CSS, GPS AND HFP 2.1. SYNCHROTRON SPECTRUM
B(⌫) / H?1/2⌫5/2 for ⌧ 1 (2.5)
in the optically thick regime, and
B(⌫) / ⌫↵ for ⌧
⌧ 1 (2.6)
in the optically thin region. B(⌫) is related to the flux density S(⌫) by B(⌫) = S(⌫)/ ⌦ where ⌦ is the solid angle under which the source is observed.
Therefore at low frequencies the flux density S increases with a spectral index/ ⌫2.5,
while in the optically thin part it decreases with S/ ⌫↵. However this is only a
theo-retical model in which the radio source are homogeneous components. However, radio sources consist of many sub-structures as jets, hot spots and lobes (Section 1.3), each of them with its own spectral properties. Therefore the observed overall spectrum is the superposition of the spectra of all the radio sources components, and so it does not match the theoretical ↵ = 2.5 slope (O’Dea, 1998).
As shown in Fig.2.1 the radio spectrum of the synchrotron emission can be divided into three regimes. At low frequencies, where the source is opaque, the spectrum rises as ⌫2.5 due to the self-absorption of the radiation, up to a peak frequency ⌫
towhich is called
turnover frequency, while at higher frequencies, in the optically thin region, the spectrum shows the classical power law. At even higher frequencies we usually find a break in the spectrum which is related to the rate of energy losses su↵ered by the electron population and to a continuos injection of new particles.
The main radiative processes causing energy losses to relativistic electrons are Syn-chrotron and Inverse Compton emission.
Inverse Compton (I.C) and Synchrotron (S.) losses can be described as follows: ✓ dE dt ◆ S. = 4 3 T 2cH2 8⇡ (2.7) ✓dE dt ◆ I.C. = 4 3 T 2c u f (2.8)
where Tis the Thomson cross section, is the Lorentz factor of the electrons, uf is the
mean energy density of the radiation field, H the magnetic field and c the speed of light.
Then, combining Eq. 2.7 and 2.8 we obtain: ✓dE
dt ◆
S+I.C.
= b E2(H2?+ 8⇡ uf) (2.9)
2.1. SYNCHROTRON SPECTRUM CHAPTER 2. CSS, GPS AND HFP
particle). Both IC and S losses depend on E2 so the most energetic particles su↵er the
highest energetic losses.
Integrating Eq. 2.9 we obtain:
E(t) = E0 1 + E0/E⇤
(2.10) where t is the time, E0is the energy of particles at t=0 and E⇤is the energy break defined
as:
E⇤= 1
b (H sin✓)2t (2.11)
where ✓ is the pitch angle defined as the angle between the magnetic field and the electron velocity direction.
Particles with smaller ✓ have larger E⇤. In the case of a re-isotropization of the pitch
angle (e.g. Ja↵e & Perola, 1973) the energy break is E⇤JP=
1.5
b H2t (2.12)
As Eq. 2.12 shows, the energy does not depend on ✓ so electrons with the same energy age similarly.
At any given epoch t corresponds an energy break E⇤below which the initial spectral
energy is substantially unchanged, while, for E > E⇤ the spectrum is modified. Similarly to the break energy we define a break frequency ⌫⇤. As the electron population ages, the
break frequency moves progressively to lower frequencies. For this reason, old relativistic electron populations show spectra with a break frequency lower than that of young objects. Therefore, if the magnetic field is known it is possible to calculate the Radiative Age of the source, from its break frequency (Murgia et al., 1999):
⌫⇤ / (E⇤)2H (2.13)
and
⌫⇤/ t 2H 3 (2.14) the value of the radiative age is1:
trad= 5.03⇥ 104· H 1.5[(1 + z)· ⌫⇤] 0.5 yr (2.15)
where z is the redshift, the magnetic field H is expressed in milligauss (mG) and the frequency ⌫ in GHz.
1In this case Inverse Compton losses are neglected and the magnetic field H is supposed to be constant
(Murgia 2003).
CHAPTER 2. CSS, GPS AND HFP 2.1. SYNCHROTRON SPECTRUM
To allow an appropriate understanding of the radio spectrum features, another im-portant situation should be considered.
Since the emission from an electron population with an initial power law energy distri-bution shows a steepening for E > E⇤, we must take into account two important boundary situations regarding the origin of these relativistic particles:
- single injection of relativistic particles. - continuous particles injection.
The evolution of a relativistic electron population can be described following three main paths, as summarized in (Murgia, 2003) and (Nagai et al., 2006) :
• KP model, by Kardashev & Pacholczyk (Pacholczyk, 1970). It assumes a single pitch angle ✓ for all the electrons with respect to the magnetic field lines which is preserved with time and a single burst of particle injection. According to KP model the electron density and the magnetic field are assumed homogeneous along the source depth.
Thus the break ⌫⇤ can be expressed as:
⌫⇤ (GHz) = 1.12⇥ 10 9 ✓ H mG ◆ 3✓ t yr ◆ 2 (2.16) The energy break in this case is the same as in Eq. 2.11.
This produces a tail of high energy particles in the energy spectrum which results “flatter” with respect to the JP.
• JP model, by Ja↵e and Perola (Ja↵e & Perola, 1973). Di↵erently from the KP model, the JP model assumes a continuos re-isotropization of the pitch angle of the relativistic particles. (The timescale for the continuos re-isotropization is assumed to be much shorter than the radiative lifetime so (H sin✓)2= (2/3 H2) ). In this
case the break is: ⌫b (GHz) = 2.52⇥ 10 9 ✓ H mG ◆ 3✓ t yr ◆ 2 (2.17) According to this model the energy does not depend on ✓ as shown by Eq. 2.11. This results in a sharp energy cuto↵ in the energy electron distribution, with a synchrotron spectrum showing an exponential drop at high frequencies. For this reason the spectrum results steeper than in the case of KP.
2.1. SYNCHROTRON SPECTRUM CHAPTER 2. CSS, GPS AND HFP
• CI model, from Kardashev (Kardashev, 1962). In this case the sources are expected to be continuously replenished by a constant flow of fresh relativistic particles. The energy distribution of these particles is well represented by : ⌫↵+0.5 instead of an
exponential drop as in the JP model.
Thus the CI model can be adopted for regions where it is hard to distinguish aged elec-trons from newly injected elecelec-trons. In particular an ensemble of di↵erent populations (e.g. the lobes and the hot spots) can be well fitted by the CI model. However, if we are considering resolved sources, the KP and JP models are adequate for fitting the lobes. In particular, the spectra of the hot-spots are well fitted by models predicting a continuous injection of fresh particles (CI) (Murgia, 2003), while lobes and extended structures are better fitted by single-injection models (JP and KP).
An example of the spectra of the lobes and the hot spots in two radio sources is shown in Fig. 2.2
926 M. Orienti et al.: Constraining the spectral age of very asymmetric CSOs
9 9.2 9.4 9.6 9.8 10 10.2 −2 −1.8 −1.6 −1.4 −1.2 −1 −0.8 Log Frequency (Hz) L o g J a n s k y B0147+400 North Lobe Model JP nu_break=14.2 (GHz) alpha_inj=0.637 Chi^2 =1.479 red. 9 9.2 9.4 9.6 9.8 10 10.2 −2.2 −2 −1.8 −1.6 −1.4 −1.2 −1 Log Frequency (Hz) L o g J a n s k y
B0147+400 North Hot Spot
Model JP nu_break=18.8 (GHz) alpha_inj=0.662 Chi^2 =0.845 red. 9 9.2 9.4 9.6 9.8 10 10.2 −1.4 −1.2 −1 −0.8 −0.6 −0.4 −0.2 Log Frequency (Hz) L o g J a n s k y
South Hot Spot B0147+400 Model POWERLAW alpha=0.352 Chi^2 =0.040 red. 0 0.02 0.04 0.06 0.08 0.1 ( JY/BEAM ) B0147+400 8.4 GHz 20 0 −20 −40 −60 −20 0 20 40 60 mas m a s C SH NL NH 0 0.05 0.1 0.15 ( JY/BEAM ) B0840+424 8.4 GHz 80 C NH SH SL 60 40 20 0 −20 −40 −60 −120 −100 −80 −60 −40 −20 0 20 40 mas m a s 9 9.2 9.4 9.6 9.8 10 10.2 −1.2 −1 −0.8 −0.6 −0.4 −0.2 0 Log Frequency (Hz) L o g J a n s k y
North Hot Spot B0840+424 Model JP nu_break=12.2 (GHz) alpha_inj=0.375 Chi^2 =0.363 red. 9 9.2 9.4 9.6 9.8 10 10.2 −2.2 −2 −1.8 −1.6 −1.4 −1.2 −1 Log Frequency (Hz) L o g J a n s k y
South Hot Spot B0840+424 Model JP nu_break=7.63 (GHz) alpha_inj= 0.47 Chi^2 =0.023 red. 9 9.2 9.4 9.6 9.8 10 10.2 −2.4 −2.2 −2 −1.8 −1.6 −1.4 −1.2 Log Frequency (Hz) L o g J a n s k y South Lobe B0840+424 Model JP nu_break=7.48 (GHz) alpha_inj= 0.47 Chi^2 =0.414 red.
Fig. 1. The spectral fits in the lobes and hot-spots of B0147+400 and B0840+424. On each fit we report the model, the injection spectral index,
the break frequency and reduced-chi-squared. The upper panel shows, clockwise, the local spectra in the Northern lobe (NL), Northern hot-spot (NH) and Southern hot-spot (SH) of the source B0147+400. The bottom panel shows, clockwise, the local spectra in the Norther hot-spot (NH), Southern hot-spot (SH) and Southern lobe (SL) of the source B0840+424. The spectra of the core components are not shown, since they can be found in Orienti et al. (2004). The restoring beam (HPBW) is 8.20 4.46 mas in PA –3.59 and 1.198 0.753 in PA –1.94 for B0147+400 and B0848+424 respectively.
Neither core shows any significant flux density variability in
the X band in our data. 4.4. Radiative ages and the nature of CSOs sources From Eq. (1), it is clear that the synchrotron age is strictly related to the break frequency br, which can be derived from the fits to
Figure 2.2: The local spectra in the lobes, and in the hot-spots of the sources B0147+400 and B0840+424 (Orienti et al., 2007).
CHAPTER 2. CSS, GPS AND HFP 2.2. COMPACT RADIO SOURCES
2.2
Compact Radio Sources
This class of objects includes either compact radio galaxies and compact radio quasars. They are luminous (L178 MHz 1026W Hz 1) radio sources, associated with an elliptical
galaxy. Extragalactic radio sources belonging to this class are quite similar to FRII but they have di↵erent linear size (LS).
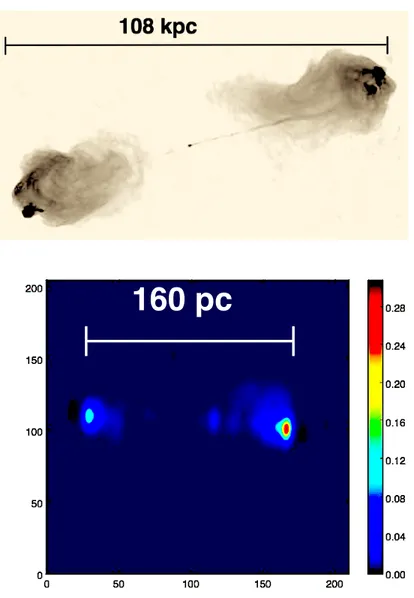
A morphological comparison between a compact galaxy and an extended FRII is shown in Fig. 2.3: on top panel we can see the FRII Cygnus A, extended for about 100 kpc, while the bottom panel shows the compact radio galaxy J1944+5448, extended for only a hundred of pc. The key component are about the same although some marginal di↵erences are related to the di↵erent physical conditions of the ambient medium surrounding the relativistic plasma.
160 pc
2.3. CLASSIFICATION CHAPTER 2. CSS, GPS AND HFP
Compact radio sources can be simply described as a scaled-down version (with physical size from 0.01 to⇠15 kpc) of the powerful, edge-brightened FRII (Snellen et al., 1998). In addition classical extend radio loud AGN, exceed by many times the size of the host elliptical galaxy. They interact mainly with the Inter Galactic Medium (IGM) or Intra Cluster Medium (ICM) if they belong to a cluster. On the contrary, compact sources result completely embedded in the host galaxy and interact only with its InterStellar Medium (ISM). This di↵erence about the ambient medium with which the relativistic plasma interacts, is a fundamental key to understand the growth and the evolution of the radio source. In fact, dense clouds could impact with the jets and slow down the source expansion. (This aspect will be discussed in more detail in Section 2.5).
2.3
Classification
In the following, I classify Compact Radio Loud AGN depending only on their spectral features derived from their radio spectrum. Three main spectral classes of compact ra-dio sources whose emission is fully within the ISM of the host galaxy are defined as follows:
• Compact Steep Spectrum radio sources (CSS) have the turnover frequencies be-tween ⇡ 100 500 MHz.
• Gigahertz Peaked Spectrum (GPS) radio sources have the spectral peak around 1 GHz.
• High Frequencies Peakers (HFP) have the spectral peaks at a few GHz ( 5 10GHz). The above classifications are the historical definitions of CSS and GPS (Fanti et al., 1990) and HFP (Dallacasa et al., 2000). As shown in Fig.2.4 the di↵erent turn over fre-quencies are a key property of these three classes of compact sources, although there is not a clear cut in this classification.
Thanks to the high spatial resolution provided by interferometric technique, it has been found that CSS have size between 1 and 20 kpc. They interact mainly with the ISM of the host galaxy. GPS have size lower than 1 kpc, while HFP usually extend one order of magnitude less than the GPS (Dallacasa et al., 2000). For this reason both GPS and HFP result completely embedded in the innermost part of the host galaxy, interacting mainly with the NLR.
In addition a morphological classification was proposed by Readhead et al. (1995). In this case the source size was taken into account as a tool to distinguish among the various type of radio sources. In particular it has been used in order to classify sources considering only two-sided objects in which two lobes of emission straddling the center of activity are clearly visible (Readhead, 1995).
CHAPTER 2. CSS, GPS AND HFP 2.4. THE RADIO SPECTRA
Figure 2.4: Di↵erent spectra of each class of compact radio sources (Dallacasa et al., 2000).
Readhead et al. (1995) defined Compact Symmetric Object (CSO), those sources with the lobe separations less than 1 kpc and, similarly, Medium Symmetric Object (MSO), those with the lobe separation in the range 1-15 kpc. As a consequence of this classifi-cation the most elongated radio sources as FR II or FR I, whose lobe separation is more than 15 kpc (i.e. outside the host galaxy) are called Large Symmetric Object (LSO). According to this classification, GPS and HFP are manly included in the CSO, while CSS belong to the MSO sources, even if a strict application of this definition is difficult. It is worth noting that this classification is purely arbitrary without a physical meaning, but it can be useful in order to distinguish between the various type of sources.
2.4
The Radio Spectra
The radio spectra of CSS, GPS and HFP usually are well represented by power-laws, even if their spectra deviate from the theoretical one. In fact, as mentioned in Section 2.1 a fundamental ingredient which usually influences the spectral shape of compact radio sources is the SSA. Altough there are some cases in which also Free Free absorption plays a role.
However observations suggest that the SSA is the most likely mechanism responsible for the observed spectral shape and turnover frequencies (Snellen et al., 2000b). In addi-tion to support this hypothesis, O’Dea et al. (1997) found a simple relaaddi-tion between the turn over frequency ⌫t.o. and the projected linear size, LS, of the radio sources, defining
a plane ⌫t.o. LS through which sources should evolve as:
2.4. THE RADIO SPECTRA CHAPTER 2. CSS, GPS AND HFP
The connection between the turnover frequency and the linear size suggests that the mechanism responsible for the ⌫t.o. is strictly connected with the source size (O’Dea &
Baum, 1997). For this reason SSA seems to be the most probable mechanism, if we assume a self similar growth of the sources.
COMPACT STEEP-SPECTRUM RADIO SOURCES
501
1998 PASP, 110:493–532
Fig. 5.—The intrinsic turnover frequency vs. linear size for the Fanti et al. CSS sample and the Stanghellini et al. GPS sample. The quasars are represented by crosses, and the galaxies by solid squares. Adapted from O’Dea & Baum (1997).
the
n
m-l plane. This suggests that the GPS and CSS sources are
simply scaled versions of each other. (2) The correlation is the
same for the galaxies and quasars. (3) There is a simple linear
relationship on the log-log plot. O’Dea & Baum (1997) find
log n
m. 20.21(50.05) 2 0.65(50.05) log l,
(4)
or
n
/ l
20.65. The fact that a simple physical relationship exists
msuggests that the physical properties of the GPS and CSS
sources are related and that the mechanism for the turnover
depends simply on the source size.
Note, however, that if the GPS sources evolve in luminosity
as they age (§ 12), the sources in the upper left part of the
plane may dim sufficiently that they leave the current flux
density–selected samples before they reach the lower right part
of the plane. Thus, Figure 5 does not necessarily imply that
sources evolve along the locus of points of the observed
cor-relation. O’Dea & Baum show that assuming the turnover is
due to synchrotron self-absorption, the evolution model of
Be-gelman (1996) produces plausible evolution on the
n
m-l plane.
Bicknell et al. (1997) show that the assumption of free-free
absorption can also reproduce similar evolutionary tracks on
the
n
m-l plane.
3. RADIO MORPHOLOGY
Because the radio sources are on the arcsecond scale or
smaller, the development of a clear picture of the radio
prop-erties awaited the ability to image these sources with high
fidelity at subarcsecond resolution (the VLA, MERLIN, the
EVN and global VLBI networks, and finally the VLBA).
Ex-amples of GPS and CSS radio morphology are shown in Figure
6, and statistics are given in Table 4. Pioneering VLBI work
on the GPS sources (see, e.g., Phillips & Mutel 1980, 1981,
1982; Phillips & Shaffer 1983; Mutel, Phillips, & Skuppin
1981; Hodges et al. 1984; Jones 1984; Mutel et al. 1985;
Pear-son & Readhead 1984, 1988) revealed simple, relatively
sym-metric structure in the radio sources associated with galaxies.
These structures were dubbed “compact doubles” by Phillips
& Mutel (1982). Deeper images have revealed additional details
in the structure of the GPS radio galaxies (see, e.g., Conway
et al. 1990a, 1990b, 1992, 1994; Wilkinson et al. 1994;
Read-head et al. 1996a, 1996b; Dallacasa et al. 1995; Stanghellini
et al. 1996, 1997b; Polatidis et al. 1995; Thakkar et al. 1995;
Taylor et al. 1994). The new observations revealed multiple
components in the sources, including in some cases the “core”
of the radio source. In a growing number of sources, e.g.,
07101439 and 23521495 (Wilkinson et al. 1994; Readhead
et al. 1996b), it seems that the radio structure is “triple” with
radio jets and lobes on both sides of a core. These sources with
two-sided radio structures have been called compact triples by
Conway et al. (1990a, 1990b) and CSOs by Wilkinson et al.
(1994) and Readhead et al. (1996b). The term “symmetric” is
used by Readhead et al. to mean “two-sided,” i.e., there is
emission on both sides of the core, rather than implying exact
symmetry between the two sides. Although many of the GPS
radio galaxies are two-sided, in many cases the morphologies,
arm ratios, and flux density ratios are not especially symmetric.
This asymmetry may be due to strong interactions of the radio
source with the ambient medium.
From Table 4, it is clear that nearly all GPS galaxies have
either compact double (CD) or triple (CSO) morphology. The
current data suggest that the GPS quasars can have a mixture
of morphologies, including compact sources, triples, and
core-jet (Hodges et al. 1984; Hummel et al. 1988; Spangler, Mutel,
& Benson 1983; Gurvits et al. 1992, 1994; Dallacasa et al.
1995; Stanghellini et al. 1996, 1997b).
A large body of data on the radio structures of the CSS
sources has been accumulated (Pearson, Perley, & Readhead
1985; van Breugel et al. 1984b, 1992; Fanti et al. 1985, 1989;
Simon et al. 1990; Wilkinson et al. 1984a, 1984b, 1991b;
Spen-cer et al. 1989, 1991; Zhang et al. 1991, 1994; Mantovani et
al. 1994; Akujor, Spencer, & Wilkinson 1990; Akujor, Spencer,
& Saikia 1991a; Akujor et al. 1991b, 1993; Akujor &
Gar-rington 1995; Nan et al. 1991a, 1991b, 1992; Sanghera et al.
1995; Cotton et al. 1997a, 1997b). The CSS galaxies tend to
be (sometimes asymmetric) doubles and triples, while the
qua-sars tend to be triple with a single bright jet (Spencer et al.
1989; Fanti et al. 1990b; Sanghera et al. 1995). Based on early
low-fidelity images, the quasars were often thought to be
core-jets, but recent observations have shown that they are mostly
triples (Sanghera et al. 1995). A similar situation may hold for
the GPS quasars. The CSS quasars tend to have brighter jets
This content downloaded from 192.167.174.25 on Fri, 30 Jan 2015 11:15:08 AM All use subject to JSTOR Terms and Conditions
Figure 2.5: Turn over frequency vs the projected linear size of two samples of GPS (Stanghellini et al., 2001) and CSS (Fanti et al., 1995). Quasars are marked by crosses while galaxies are represented by squares. (O’Dea & Baum, 1997)
According to the previous relationship, Fig.2.5 shows the distribution of the sources in the ⌫t.o. LS plane. As the source expands its turnover frequency decreases and each
source moves downward and right. This is the result of a decreased energy density within the radio emitting region.
However, Bicknell et al. (1997) could reproduce the relationship shown in Fig. 2.5 assuming a FFA model (Bicknell et al., 1997a). In this case the relation is ⌫t.o./ LS 0.96.
For this reason, the main mechanism that could explain the observed turnover frequencies in compact sources, still remains uncertain and a combination of SSA and FFA may be at work.
CHAPTER 2. CSS, GPS AND HFP 2.5. RADIO MORPHOLOGY
2.5
Radio Morphology
Because of their small size CSS, GPS and HFP can be studied with the high resolution interferometry technique which allows an angular resolution of a sub-arcsecond scale. Given their small linear and angular size, the morphological classification of these sources strictly depends on the resolution, the frequency and the sensitivity of the observations, making the correct morphological classification of individual sources rather difficult.
Therefore considering their morphological features, compact radio sources can be di-vided into four main groups (Fanti et al., 1990):
• DOUBLE: sources which show two well separated components. Sometimes in deep observations a weak flat-spectrum unresolved component is found in between. This is probably the core, usually observable at high frequencies ( 5 GHz).
• TRIPLES: three well separated components are visible in these sources. They are not necessary aligned. Deep observations revealed that the central component may host the core.
• JET LIKE: they are elongated structure, usually with a visible flat spectrum core located at one end of the source.
• COMPLEX: this group includes sources whose morphology cannot be classified in any of the previous classes.
The comparison between CSS galaxies and quasars indicate that they have di↵erent morphology. CSS quasars show a brighter core and are usually dominated by their bright jets. Most of the CSS/GPS quasars can be included in the Jet-like or Complex group.
On the contrary CSS galaxies are more often Double or Triple sources, with a weak core and, sometimes weak jets. They are usually lobe dominated or hot spot dominated. Fanti et al., (1990) examined the possibility that CSS morphology could be the result of projection e↵ects of large sources. This was excluded by their statistical studied. They concluded that the majority of CSS are intrinsically small radio sources, and that only a small fraction of their sample (roughly 10%) may be large-size source shortened by projection e↵ects. This e↵ect is observed when the relativistic jet is aligned to the line of sight, making the source brighter as a consequence of Doppler boosting and foreshortened due to projection e↵ects.
Another important aspect of compact radio sources is that they often show distorted morphologies. This could be explained by considering the interaction with local dense cloud (Wilkinson et al., 1984). In agreement with this hypothesis, X-ray and IR obser-vations confirmed the existence of di↵erent ISM phases inside the host galaxy (Siemigi-nowska et al., 2005). Also polarization and faraday rotation measures confirm the presence
2.6. POLARIZATION CHAPTER 2. CSS, GPS AND HFP
of such a dense gas (Cotton et al., 2003) which however is not dense enough to confine the source growth. Additionally, in the standard source model, the hot spot more distant to the core, should be the brighter one. This is due simply to path delay and beaming e↵ects. If we assume that the jet plasma is symmetrically ejected from the central region, we should observe the two hot spots symmetrically placed with respect to the core. This is true only for those radio sources that lay on the plane of the sky and only if the ambient medium has a homogeneous distribution. If these conditions do not hold, the two hot spots would result located at di↵erent distance from the central region, resulting in an asymmetric structure of the radio source.
Moreover, even if a geometrical e↵ect could produce quite small observable asymme-tries (Orienti et al. 2007) due mainly to the large orientation angle between the radio axis and the l.o.s., in the most cases, compact galaxies, as CSS and GPS result asymmetric because of the ambient medium.
An example of asymmetric GPS is the source J1944+5443. In this case the brighter hot spot is the closer to the core which is contrary to the geometrical model explained above and asymmetry is likely due to the dense, inhomogeneous ambient medium (Polatidis et al., 1999).
660 A. Polatidis et al. / New Astronomy Reviews 43 (1999) 657 –661
Fig. 2. Contours: Global VLBI image of 19431546 at 4 cm from epoch 1997.73. The restoring beam is 0.85 mas and the contours are 4 mJy / beam 3 (21,1,2,4,8,16,64,256). The grey scale represents the difference between the 1997.73 and the 1993.17 images, where white is the negative and black is the positive values.
consistent with those derived by multiple epoch presented here and elsewhere conclude the census of observations at 6 cm by Owsianik & Conway CSOs in the complete PR and CJ1 sample. There are (1998), Owsianik et al. (1998) and Owsianik et al. 15 confirmed CSOs in this 200 source sample, (these proceedings) and will not be discussed further. amounting to 7.5% of the total. Another 5% of the Here we present the results for the radio galaxy sample, 10 sources in all, are MSOs, having struc-19431546 (z 5 0.263). The structure of the source tures with sizes between 1 kpc and 15 kpc. Finally, (Fig. 2) is, more than any other CSO, strikingly 68 sources (34%) are large ( . 15pc), lobe-domi-similar to the 1000 times larger FR II lobe–domi- nated radio sources, with a Fanaroff-Riley type I or nated sources. The overall angular size is 42 mas, II morphology.
21
yielding a projected linear size of | 105h pc The relative lack of MSO objects in the sample is
21 21
(H 5100h km s0 Mpc and q 50.5). Between0 intriguing. Given that CSOs are expanding quite fast the two epochs it appears that the separation between (a few tenths of c) they probably spend only a short the hotspots has increased by 0.189 mas, yielding a time in the CSO phase and hence we would expect proper motion of 41.5 mas / yr and a hotspot sepa- more MSOs in the sample than what we find.
21
ration velocity of v 50.419h c. Dividing the dis-h Theoretical models (Readhead et al., 1996;
Begel-21
tance between the hotspots of 105h pc by their man, 1996), invoke negative luminosity evolution observed separation velocity we estimate that 19431 with increasing size to explain the relative abundance 546 is 1020 years old. Both the measured velocity of CSOs.
and the estimated kinetic age of 19431546 are in agreement with those derived for the other four sources mentioned above.
References
Begelman, M.C., 1996, in: Carilli, C.L., & Harris, D.E., (Eds.),
4. Conclusions Cygnus A – Study of a radio galaxy, Cambridge University
Press, p. 209.
The combined PR and CJ1 sample of 200 sources Conway, J.E., Pearson, T.J., Readhead, A.C.S., Unwin, S.C., Xu, W., & Mutel, R.M., 1992, ApJ, 396, 62.
is large enough to allow meaningful studies, but not
Conway, J.E., Myers, S.T., Pearson, T.J., Readhead, A.C.S.,
so large as to preclude a comprehensive
understand-Unwin, S.C., & Xu, W., 1994, ApJ, 425, 568.
ing of individual sources and their radio structures at Fanti, C., Fanti, R., Dallacasa, D., Schilizzi, R.T., Spencer, R.E., all angular scales. & Stanghellini, C., 1995, A&A, 302, 317.
The recent multi-frequency VLBI observations Owsianik, I. & Conway, J.E., 1998, A&A, 337, 69.
Figure 2.6: The asymmetric GPS J1944+5443 (Polatidis et al., 1999).
2.6
Polarization
The synchrotron radiation is known to be linearly polarized with the orientation of the electric vector perpendicular to the orientation of the local magnetic field H. The polar-ization is strictly related to the wavelength, in particular they are inversely proportional each other. The decreasing polarization (Depolarization) is probably due to the Faraday screen that depolarizes and rotates the polarization vector.
CHAPTER 2. CSS, GPS AND HFP 2.6. POLARIZATION
The Rotation Measure (RM) depends on the ambient medium density and it can be defined as follows:
RM = 0.81 Z
neHkdl rad m 2 (2.19)
where ne is the electron density expressed in (cm 3), Hk is the magnetic field (expressed
in (µG) along the line of sight and dl is the depth of the Faraday screen. From Eq. 2.19 is possible to obtain the electron density of thermal plasma which produces the observed RM, if Hkis known.
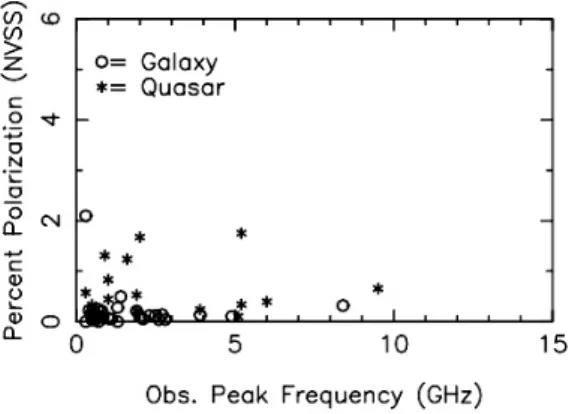
CSS and GPS sources are known to have little or no polarized emission. Due to their small size, the relativistic plasma is completely embedded within the ISM of the parent galaxy. Such ISM may be responsible for the lack of polarization. Cotton et al. (2003) found that small radio sources are unpolarized in the NVSS at 1.4 GHz (Fig. 2.7), while at higher frequencies sources with size of about a few kpc start to show some fractional polarization at progressively smaller projected linear sizes (Fanti et al., 2004).
Figure 2.7: Fractional polarization at 1.4 GHz plotted versus the frequency of the peak in the spectrum for a GPS sample (Cotton et al., 2003).
This is consistent with the picture of a small radio source with normal polarization properties whose radio emission is subject to severe Faraday rotation with inhomogeneities on very small scales, producing depolarization.
In addition, an alternative explanation considers either beam depolarization on small scales as a result of a complex magnetic field topology, or, finally, that the source radia-tion is unpolarized as a result of a tangled magnetic field on very small scales.
In the few cases where it has been possible to achieve polarization detection of CSS/GPS galaxies and quasars, very high ( 1000 rad m 2) intrinsic Rotation Measures have been
found. This implies that these compact radio sources are generally surrounded by a very dense ionized medium (Fanti, 2004).
2.7. AGE CHAPTER 2. CSS, GPS AND HFP
2.7
Age
The various classes of compact sources can be interpreted assuming an evolutionary model, known as Self Similar Evolution Model. According to this model each radio source pre-serves its overall morphology as the radio source expands. HFP will evolve into GPS, which, in turn, will become CSS whose fate is to eventually grow up to reach the size of the extended radio galaxies, like the FR I and FR II. In this model HFP are the youngest radio sources, where the radio activity has just switched on.
In order to demonstrate the validity of the evolutionary model, it is necessary to deter-mine the age of these radio sources, in order to understand if they really are the young phase of old and extended FR I or FR II. To this aim two main approaches are explained in some details.
2.7.1
Radiative Age
As previously discussed in Section 2.1, the radiative age can be computed using Eq. 2.15. One disadvantage of this method is that the contributions of the di↵erent source com-ponents to the overall spectrum, each one with its own spectral shape, are all mixed together. The age determination may be more influenced by the brighter components (as the hot spot). Thus, if we consider a source where the hot spot emission is the dominant one, the source age cannot be directly correlated to the spectral age because inside the hot spot electrons are likely to be re-accelerated.
For this reason considering sources with symmetric shape (emission) we should esti-mate the spectral age of the source in the following way. We should take into account only those components where probably electrons were not re-accelerated during the source lifetime and where we find a break on the spectral shape. These regions can be found in the innermost edges of the lobes, where electrons were deposited by the hot spot, as the radio activity of the source has just switched on. In addition, in compact objects the magnetic field is more intense if compared to that of the largest radio sources. Indeed the radiative age, according to Eq. 2.15, in compact objects is shorter.
From earlier works about spectral ageing of CSO (Murgia 2003) it has been found that the break frequency decreases from the the hot spot to the source center in the core direction. Particles found in the inner part of the lobes are older because they have been accelerated in the hot spots at an early time. The hunt for the determination of the radiative age is the search for the earliest/oldest relativist particles.
In conclusion, the lobes are the best place to investigate the spectral age.
CHAPTER 2. CSS, GPS AND HFP 2.7. AGE
2.7.2
Kinematic Age
Another method to compute the age of radio sources is related to the measure of the separation speed between the hot spots, thus considering their proper motion: this is called the Kinematic Age method. The kinematic age tkin can be easily estimated as:
tkin=
✓ LS vsep
◆
(2.20) assuming LS as the total linear size of the source and vsepthe advance speed of the two
hot spots.
As a first approach we could estimate the source age by dividing its overall projected size by the corresponding measured hot spot separation rate known as expansion speed. However, this value can be measured by comparing observations separated by a few (tens) of years. We assume that the source growth happens at a roughly constant speed, but we should keep in mind that it may not represent the true growing rate of the source. For example, there is a phenomenon called ’dentist’s drill ’ (Scheuer, 1982) according to which the hot spots follow a ”corkscrew” like path as they move among the ISM and the resulting advance speed is much smaller than the instantaneous value. These may produce an unreliable estimate of the age of the source (Polatidis, 2003). Moreover inhomogeneities of the external medium and hydrodynamical mechanisms could induce other several changes in the source expansion. For example if the external gas is inhomogeneous on the two sides explored by the jets, it may slow down the advance of one hot spot resulting in an asymmetric shape of the source (as described in Section 2.3).
In order to obtain the age of the source, an important tool is the comparison between the spectral and the kinematic age. An example is reported in Murgia (2003). By mea-suring the spectral break of the CSO J1943+546, Murgia (2003) obtained a spectral age of about trad⇠ 1500 yr which is in good agreement with the kinematic age tkin = 1400 yr
2.8. THE MODELS CHAPTER 2. CSS, GPS AND HFP
2.8
The Models
Two di↵erent models have been proposed to explain the nature of CSS, GPS and HFP. These models should describe all radiative and morphological features of these class of small radio sources, such as their radio luminosity, small size, and the fact that they represent a large fraction of the radio source population in flux density limited samples.
The models explaining the nature of compact radio sources are the Frustration Sce-nario and the Youth SceSce-nario. They are discussed in the following paragraphs.
2.8.1
Frustration Scenario
This model is based on the idea that intrinsically small radio sources will never become large since they will be confined to sub-galactic size by an anomalously dense ambient medium which prevents any growth (van Breugel et al., 1984).
For this reason it is useful to set constrains on the characteristics of the ambient medium, as shown for examples by De Young (1993). Through simple numerical hydro-dynamical simulations of a jet propagating in a smooth medium with a constant density, De Young (1993) found that the total gas mass required to confine the radio source is:
M = 109M ⇣ n0 10 cm 3 ⌘✓ R 1 kpc ◆3 (2.21) where R is the radius of the medium with density n0.
For n0⇡ 1 cm 3 the necessary gas mass is ⇡ 108M inside 1 kpc. Then De Young
(1993) computed that typical CSS/GPS sources, with low-medium luminosity, can be confined only in the case in which the average ISM density is between 1 n 10 cm 3
(De Young, 1993). The mass of the gas required to confine the sources is about⇡ 1012M
which should extends out to 10 kpc.
Subsequently, Carvalho et al., (Carvalho, 1994) ,(Carvalho, 1998) presented a simple analytical model of jet interaction with the ambient medium. Carvalho (1998) obtained that interactions with dense clouds could slow down the jet more than a smooth medium with the same average density. GPS sources could be confined by a clumpy medium with a mass of⇡ 109 1010M , on the scales of hundred pc. However such a dense gas should
be observed.
Fanti et al., (2000) analyzed IR observations from the ISO satellite on a representative sample of GPS and CSS sources comparing their IR properties with those of a sample of extended radio sources with similar range of redshift and luminosity. No evidence of dif-ferent FIR luminosity between the CSS/GPS and extended objects was found, indicating that the gas possibly frustrating the growth of small radio sources is not in the form of cold molecules and dust (Fanti et al., 2000).
Relying on ram pressure studies, the gas mass required to support this hypothesis is about 2· 1010M within a volume of ⇡ 10 kpc. It corresponds to a dust mass of
2⇥ 108M which should produce an IR excess of GPS and CSS emission which has
never been observed. In addition some studies in the X-ray band (Siemiginowska et al. 40