RESEARCH ARTICLE
Esophageal microbiome signature in patients
with Barrett’s esophagus and esophageal
adenocarcinoma
Loris Riccardo LopetusoID1,2,3☯, Marco Severgnini4☯, Silvia Pecere5,6, Francesca
Romana Ponziani1,7, Ivo BoskoskiID5,6, Alberto Larghi5,6, Gianluca Quaranta8,
Luca Masucci8, Gianluca Ianiro1,7, Tania Camboni4, Antonio Gasbarrini1,7, Guido Costamagna5,6, Clarissa Consolandi6☯, Giovanni Cammarota1,7☯*
1 Dipartimento di Scienze Mediche e Chirurgiche, UOC Medicina Interna e Gastroenterologia, Fondazione
Policlinico Universitario A. Gemelli IRCCS, Roma, Italia, 2 Department of Medicine and Ageing Sciences,”G. d’Annunzio” University of Chieti-Pescara, Chieti, Italia, 3 Center for Advanced Studies and Technology (CAST), “G. d’Annunzio” University of Chieti-Pescara, Chieti, Italia, 4 Institute of Biomedical Technologies, Italian National Research Council, Segrate (Milano), Italia, 5 Digestive Endoscopy Unit, Fondazione Policlinico Universitario A. Gemelli IRCSS, Roma, Italia, 6 Centre for Endoscopic Research Therapeutic and Training CERTT, UniversitàCattolica del Sacro Cuore, Roma, Italia, 7 Istituto di Patologia Speciale Medica, UniversitàCattolica del Sacro Cuore, Roma, Italia, 8 Dipartimento di Microbiologia, Fondazione Policlinico Universitario A. Gemelli IRCCS, Roma, Italia
☯These authors contributed equally to this work. *[email protected]
Abstract
Preliminary studies suggested a possible correlation of microbiota with Barrett’s esophagus (BE) and esophageal adenocarcinoma (EAC), where the need for tools to ameliorate its poor prognosis is mandatory. We explored the potential signature of esophageal microbiota and its predicted functional profile along the continuous spectrum from BE to EAC. We analyzed through 16S-based amplicon sequencing the mucosal microbiota and the microbiota-related functional predictions in 10 BE and 6 EAC patients compared with 10 controls, exploring also potential differences between the metaplastic mucosa (BEM) and the adjacent normal areas of BE patients (BEU). BEM and EAC showed a higher level ofαandβ-diversity. BEM evidenced a decrease of Streptococcus and an increase of Prevotella, Actinobacillus, Veillonella, and Leptotrichia. EAC displayed a striking reduction of Streptococcus, with an increase of Prevo-tella, Veillonella and Leptotrichia. LefSe analysis identified Leptotrichia as the main taxa distin-guishing EAC. BEM showed a decreasedα-diversity compared with BEU and a reduction of Bacteroidetes, Prevotella and Fusobacterium. Functional predictions identified peculiar profiles for each group with a high potential for replication and repair in BEM; an upregulated energy, replication and signaling metabolisms, with the fatty-acids biosynthesis and nitrogen and D-ala-nine pathways down-regulated in EAC. Our pilot study identifies a unique microbial structure and function profile for BE and EAC, as well as for metaplastic and near-normal areas. It pro-poses a new concept for BE, which could be intended not only as the histological, but, also, as the microbial closest precursor of EAC. This requires further larger follow-up studies, but opens intriguing horizons towards innovative diagnostic and therapeutic options for EAC.
a1111111111 a1111111111 a1111111111 a1111111111 a1111111111 OPEN ACCESS
Citation: Lopetuso LR, Severgnini M, Pecere S, Ponziani FR, Boskoski I, Larghi A, et al. (2020) Esophageal microbiome signature in patients with Barrett’s esophagus and esophageal
adenocarcinoma. PLoS ONE 15(5): e0231789.
https://doi.org/10.1371/journal.pone.0231789
Editor: Nicholas Clemons, Peter MacCallum Cancer Centre, AUSTRALIA
Received: December 16, 2019 Accepted: March 31, 2020 Published: May 5, 2020
Copyright:© 2020 Lopetuso et al. This is an open access article distributed under the terms of the
Creative Commons Attribution License, which permits unrestricted use, distribution, and reproduction in any medium, provided the original author and source are credited.
Data Availability Statement: All relevant data are within the manuscript and its Supporting Information files.
Funding: The author(s) received no specific funding for this work.
Competing interests: The authors have declared that no competing interests exist.
Introduction
Esophageal cancer is the eight most commonly diagnosed cancer worldwide and represents one of the most frequent causes of cancer-related death [1]. The prevalent histological type in the West Countries is the adenocarcinoma (EAC) of the distal esophagus, harboring peculiar molecular characteristics, different from the squamous cell carcinoma that predominates in the Eastern Nations [2]. The only established precursor of EAC is Barrett’s esophagus (BE), a condition in which the normal stratified epithelium is replaced with a metaplastic columnar layer, functioning as a protective shield against gastroesophageal acid reflux. However, persis-tent acid stress and consequent inflammation have been proposed to cause proliferation of BE cells that may lead to the progression towards EAC [3]. Despite the introduction of innovative therapies such as surgery, chemo- and radio-therapy, the prognosis in patients with EAC remains poor [4]. Therefore, a deeper knowledge of the pathogenesis that drives the transition from normal epithelium to BE and EAC is the cornerstone to obtain new therapeutic alterna-tives, improving diagnostic and prognostic tools to accurately refine the individual risk.
Interestingly, the gastrointestinal (GI) microbiota has been demonstrated to exert a crucial role in health, as well as in several GI [5–8] and extra-intestinal diseases [9–12], and, also, in various types of cancers [13,14]. The GI microbiota is considered a dynamic system living in a synergistic relationship with its host, involved in the maintenance of immunological homeo-stasis. Emerging evidences have linked tumor initiation and progression in the GI tract with microbiota through DNA damage, activation of oncogenic signaling pathways, production of tumor-inducing metabolites and suppression of the immune response [14–19]. To date, important improvements in culture-independent molecular techniques have allowed the iden-tification of the potential main bacterial actors involved in these processes, which could be use-ful markers to stratify cancer risk [20–23]. At the same time, since GI microbiota can be modulated by a rational application of therapeutic tools [24], a better knowledge of the rela-tionship between BE, EAC and the microbiota may have clear clinical implications.
In the present study, we characterized the esophageal microbiota composition and inferred functional profile in patients with BE and EAC compared with control individuals. We also investigated whether microbial structure and function could differentiate the metaplastic mucosa from the adjacent normal esophageal areas in BE patients. Taken together, our data indicate that BE and EAC mucosal samples, as well as metaplastic and near-normal areas, can be differentiated by a peculiar gut microbiota profile, suggesting that it can represent one of the predisposing factors of BE, which could be not only the histological, but, also, the microbial closest precursor of EAC.
Material and methods
Study design and sample collection
From September 2016 to January 2018, consecutive patients with symptoms requiring upper GI endoscopy at the Fondazione Policlinico A. Gemelli in Rome were evaluated for the inclusion in this observational prospective study. Exclusion criteria were the following: previous endoscopic or surgical treatment on the stomach and/or the esophagus; active infection of the oral cavity; hepatitis B virus, hepatitis C virus or human immunodeficiency virus infection; unable to suspend anticoagulation therapy; unable to perform or intolerant to upper endoscopy; history of antibiot-ics and/or probiotantibiot-ics use in the 4 weeks preceding sampling; history of proton pump inhibitors or Histamine 2 Receptor Antagonist use in the 2 months before endoscopic biopsies.
BE was diagnosed by the presence of at least 1 cm of columnar-lined mucosa in the esopha-gus with the microscopical presence of intestinal metaplasia. EAC of the distal esophageal/
esophagogastric junction was diagnosed histologically. During single endoscopy, bioptic mucosal samples were obtained for microbiological assessment with the following pattern: • healthy controls (CTRL): 2 biopsies from the normal esophageal mucosa;
• patients with BE: 2 biopsies from the esophageal metaplastic lesion (BEM) and 2 from the normal esophageal mucosa (BEU);
• patients with EAC: 2 biopsies from the neoplastic lesion.
In order to avoid contamination, each biopsy was taken at the time of insertion with differ-ent disposable forceps. Samples were immediately stored at -80˚C.
All enrolled subjects provided their written informed consent. The study protocol was con-ducted in accordance with the principles of the Declaration of Helsinki and approved by the “Università Cattolica del Sacro Cuore” Ethic Committee.
DNA extraction and library preparation
Genomic DNA was isolated from one mucosal biopsy for each condition using High Pure PCR Template Preparation Kit (Roche, Basel, Switzerland) according to manufacturer’s instructions. 200μl of Tissue Lysis Buffer and 40 μl of Proteinase K were added to 25–50 mg of sample material. This suspension was incubated for 3 hours at 55˚C until tissue was completely digested. Then, 200μl of Binding Buffer were added and incubated for 10 minutes at 70˚C. Finally, samples were washed with 500μl of Washing Buffer using a column (High pure filter tube) and eluted with 200μl of Elution Buffer.
DNA concentration and quality were determined using a NanoDrop ND-1000 spectropho-tometer (NanoDrop Technologies, Wilmington, DE, USA) and a TapeStation 2200 (Agilent Technologies, Santa Clara, CA, USA). The V3-V4 hypervariable regions of the 16S ribosomal RNA (rRNA) gene were amplified according to the 16S Metagenomic Sequencing Library Preparation protocol (Illumina, San Diego, CA, USA) and sequenced on a MiSeq platform (Illumina), in a single 2× 300 bp paired-end run.
Bioinformatic analysis
Raw sequencing reads were trimmed down to 250 nt, due to quality, and processed by merging overlapping pairs with PandaSeq software (v2.5, “PAired-eND Assembler for DNA
sequences”) [25], discarding fragments of length outside 250–900 bases range, non-overlap-ping sequences and sequences having more than 25% nucleotides with a phred score �3. Qual-ity-filtered reads were analyzed by QIIME suite (release 1.8.0) [26], grouped into OTUs (Operational Taxonomic Units) by UCLUST [27] at 97% similarity and taxonomically classi-fied against the 13.8 release of the Greengenes database (ftp://greengenes.microbio.me/ greengenes_release/) by RDP classifier [28] at 50% confidence. Singleton OTUs (i.e., clusters made up of only 1 read) were discarded as likely chimeric sequences. Sample biodiversity (i.e.,
α-diversity) was estimated according to different microbial diversity metrics (i.e., chao1, Shan-non index, observed species and Faith’s phylogenetic distance), whereas inter-sample diversity (i.e., β-diversity) analysis was conducted using weighted and unweighted Unifrac [29] and Bray-Curtis distances and Principal Coordinates Analysis (PCoAs). Data separation was tested with a permutation test with pseudo F-ratios using "adonis" function from R package "vegan" (version 2.0–10) [30] with 999 random permutations. For beta distances evaluation, the dis-tance between each BEM sample and the corresponding BEU sample from the same patient was calculated and compared to the median of distances between each BEM sample and the BEU samples from other individuals. When comparing paired samples, a Wilcoxon signed
rank test was used for both relative abundance and beta-distances comparisons. Otherwise, for relative abundance analysis, a Mann–Whitney U-test was used. A p-value <0.05 was chosen as the threshold for statistical significance. LEfSe (Linear discriminant analysis Effect Size) [31] was employed to search for features most likely to explain differences between EAC, BEM and CTRL.
Species-level characterization of the four main genera present in the samples (i.e., Strepto-coccus, Prevotella, Veillonella and Leptotrichia) was performed by BLAST-aligning all reads
belonging to these genera to a custom reference database of all available reference sequences in NIH-NCBI database (ftp://ftp.ncbi.nlm.nih.gov/genomes/refseq/bacteria/). Potential matches were filtered in order to retrieve an unequivocal classification for each read [32–34].
Co-abundance network analysis was performed as previously described [35], using Ken-dall’s correlation between taxa and building hierarchical clusters of co-abundant groups (CAGs) at genus level by Spearman’s correlation metric and Ward linkage. Cytoscape (v 3.0) [36] was used to graphically represent CAGs, as well as relative abundance of bacterial genera and strength of correlation. For full description, seeSupplemental Information Appendix,
Materials and Methods.
Finally, the Phylogenetic Investigation of Communities by Reconstruction of Unobserved States (PiCRUST) [37] pipeline and the Kyoto Encyclopedia of Genes and Genomes pathways database (KEGG) [38] were used to perform a functional prediction based on the 16S taxo-nomic profiles of each sample.
Raw reads from this experiment are available in NCBI Short-read Archive (SRA) under accession number PRJNA553177 (https://www.ncbi.nlm.nih.gov/bioproject/PRJNA553177).
Results
A total of 16 patients, 10 of whom with a new diagnosis of BE and 6 with a new diagnosis of distal esophageal/esophagogastric junction cancer, and 10 CTRL without any endoscopic sign of mucosal disease were enrolled. Demographic characteristics of the study population are shown inTable 1. No statistical significant age differences were found among groups.
Microbiota composition across esophageal disease stages
Gut microbiota biodiversity and composition for each group were analyzed viaα- and β-diver-sity values. BEM and EAC samples showed an overall higher level ofα-diversity compared with CTRL, although the difference was not statistically significant (Fig 1A).
On the other hand, when evaluatingβ-diversity, a significant difference was observed between CTRL and EAC using unweighted Unifrac (p = 0.02) and Bray-Curtis distances (p = 0.018), as well as between BEM and EAC at Bray-Curtis evaluation (p = 0.034) (Fig 1B). No significant differences were registered considering weighted UniFrac distance.
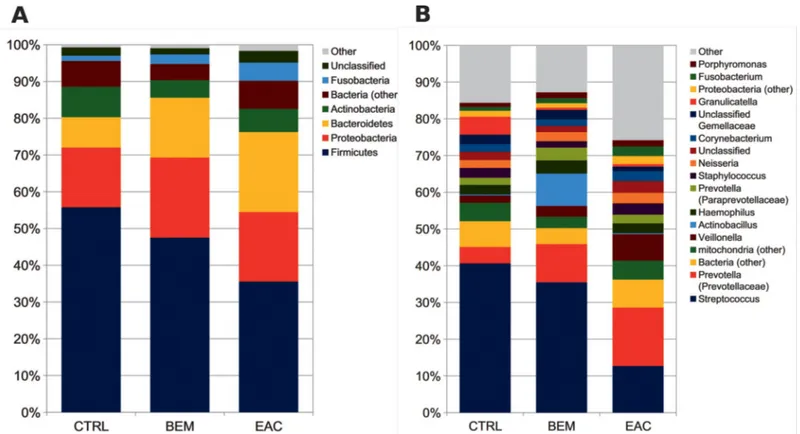
In order to reveal distinctive characteristics of each group, taxa distribution was explored at the phylum and genus level. Normal esophageal mucosa was composed mainly byFirmicutes
(55.7% average relative abundance, rel. ab.),Proteobacteria (16.2%), Bacteroidetes and Actino-bacteria (8.2% each), FusoActino-bacteria (1.4%), plus another ~7% of unidentified Actino-bacteria. At the
genus level,Streptococcus (40.6% average rel. ab.) was the main contributor to the microbiota
profile, followed byGranulicatella and Prevotella (rel. abs. 4.9% and 4.5%, respectively); other
subdominant genera wereHaemophilus, Staphylococcus, Veillonella, Propionibacterium and Rothia, accounting for about 2% each. Notably, we also found about 5% of mitochondrial 16S
DNA (Fig 2A and 2B).
BEM mucosa showed a tendency towards a decrease ofStreptococcus, Granulicatella and Propionibacterium and towards an increase of Prevotella, Actinobacillus and Veillonella,
together with a statistically significant (p = 0.007) robust increase ofLeptotrichia and its
corre-sponding phylumFusobacteria (p = 0.038).
EAC mucosa, on the other hand, displayed profound alterations in its microbial composi-tion, as compared to CTRL samples, such as a striking reduction inStreptococcus (12.7% rel.
ab., p = 0.016vs. both CTRL and BEM) and Granulicatella (0.7%) abundance, with a
corre-sponding increase inPrevotella (15.9%, p = 0.031), as well as of the corresponding phylum (i. e., Bacteroidetes, p = 0.031), Veillonella (7.2%, p = 0.028), and Leptotrichia (2.3%) (Fig 2A and 2B). These results were also concordant with those from LefSe analysis, suggesting that the main bacterial taxa distinguishing EAC wereLeptotrichia (phylum: Fusobacteria), members of
familyVeillonellaceae, and Clostridium and Moryella from family Lachnospiraceae. On the
other hand, CTRL samples were characterized by an increased abundance of the genusBacillus
andStreptococcus and their respective families (all within class: Bacilli) (seeS1 Fig).
BEM and EAC mucosa samples were characterized also by a shift in the proportion of the different species belonging toVeillonella and Prevotella genera, compared with CTRL. In
par-ticular, BEM and EAC showed a tendency towards a decrease ofV. dispar and V. tobetsuensis,
and an increase ofV. atypica and of other unclassified members of Veillonella genus. Within
Table 1. Demographic characteristics of the study population.
Clinical Condition Number of samples M F Mean age± SD
Barrett’s esophagus 10 6 4 50.6±6.4
Esophageal adenocarcinoma 6 4 2 55.8±3.2
Controls 10 6 4 51.6±7.2
SD: standard deviation.
https://doi.org/10.1371/journal.pone.0231789.t001
Fig 1. (A) Alpha-diversity rarefaction curve for Faith’s phylogenetic diversity (PD_whole_tree) metric for BEM, EAC or healthy control samples. Curves represent the average value of all the samples within the experimental category; error bars represent standard deviations. (B) PCoA plot of the Bray-Curtis distances among samples; each point represents a sample, centroids are calculated as the mean coordinate of all samples per experimental category (BEM, EAC or CTRL); ellipses represent the SEM-based estimation of the variance. The first and second components of the variance are shown. BEM: esophageal metaplastic samples; EAC: esophageal adenocarcinoma samples; CTRL: healthy control samples.
Prevotella genus, evident shifts were registered for P. melaninogenica (decreased in both EAC
and BEM) and the unclassified members of the genus (increased in both EAC and BEM). Moreover, BEM samples were characterized by a higher presence ofP. histicola, whereas EAC
seemed to have a slightly higher proportion ofP. nigrescens (seeS2 Fig).
Taken together, these findings identify peculiar microbial characteristics for each group of samples, which share particular features, but can be differentiated at various levels in terms of phylogenetic diversity and relative abundance of specific phyla and genera.
Taxonomic co-abundances clusters
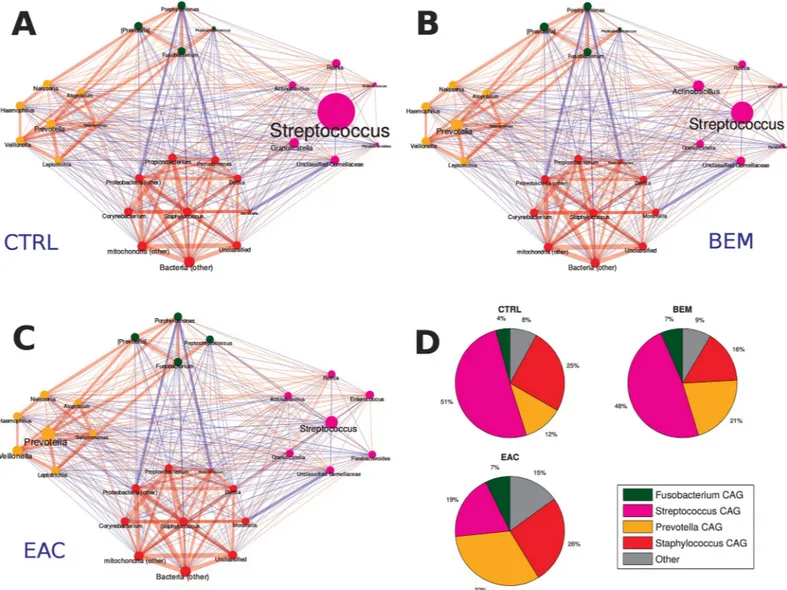
To identify patterns of co-expression among bacterial genera of esophageal microbiota, we determined co-abundances associations on the whole dataset and clustered them into four CAGs, whose names were assigned according to the most abundant or representative genera (Fig 3A, 3B and 3C).
Three groups were composed by networks of strongly positively correlated bacteria: Staphy-lococcus CAG (summing up to 21.7% rel. ab. on average) included, among all, Propionibacter-ium, Pseudomonas and Corynebacterium; Fusobacterium CAG (5.8% average rel. ab.), which
comprised alsoPorphyromonas and Peptostreptococcus; and Prevotella CAG (20.1% average
rel. ab.), includingLeptotrichia and Veillonella genera. The last CAG (i.e., Streptococcus CAG,
accounting for 42.5% rel. ab.) was composed, beside the genus itself, by others, such as Granu-licatella, Actinobacillus and Parabacteroides, all showing a substantial non-correlation among
themselves or to the other CAGs. Bacterial genera not belonging to the four aforementioned CAGs summed up to 9.9% rel. ab. on average. (seeS3 Fig).
Fig 2. Barplots of the relative abundance of the main bacterial taxa at (A) phylum or (B) genus level for BEM, EAC or healthy control samples. Data represent the average of the relative abundance of all samples per experimental category. Only groups with an average rel. ab �1.5% are plotted. BEM: esophageal metaplastic samples; EAC: esophageal adenocarcinoma samples; CTRL: healthy control samples.
In control subjects,Streptococcus and Staphylococcus CAGs dominated the microbiota,
summing up to 75.9% of rel. ab., withPrevotella and Fusobacterium CAGs accounting for
11.8% and 4.0% rel. ab., respectively. BEM group showed a tendency, although not statistically significant, towards the reduction ofStaphylococcus CAG (15.6% rel. ab.) and the increase in Prevotella CAG (21.1% rel. ab.), as well as of its members Prevotella, Veillonella and Leptotri-chia. EAC samples were characterized by a marked significantly decrease (p = 0.03) of Strepto-coccus CAG down to 19.3% of rel. ab. and an increase of Prevotella CAG (p = 0.04). Notably,
this CAG comprised bothPrevotella and Veillonella, which resulted significantly increased
compared to CTRL. Finally, EAC group also showed a higher contribution by bacterial taxa not belonging to the four main CAGs as compared to CTRL (15.1%vs. 8.1%, p = 0.03) (Fig 3D).
Fig 3. Taxonomic correlations among co-abundant groups (CAGs) in (A) healthy (CTRLS), (B) BEM and (C) EAC individuals. Red edges indicate a positive
correlation, while blue edges a negative one. Edge size is proportional to the correlation coefficient. Node and label size represent taxonomy abundance, while the colour indicates the belonging cluster:Streptococcus CAG in magenta, Fusobacterium CAG in green, Staphylococcus CAG in red, and Prevotella CAG in yellow. (D) Pie-charts
showing the average cumulative relative abundance per CAG and experimental group. CAGs: co-abundant groups; BEM: esophageal metaplastic samples; EAC: esophageal adenocarcinoma samples; CTRL: healthy control samples.
Differences in the microbiota of Barrett patients’ metaplastic and
unaffected mucosa
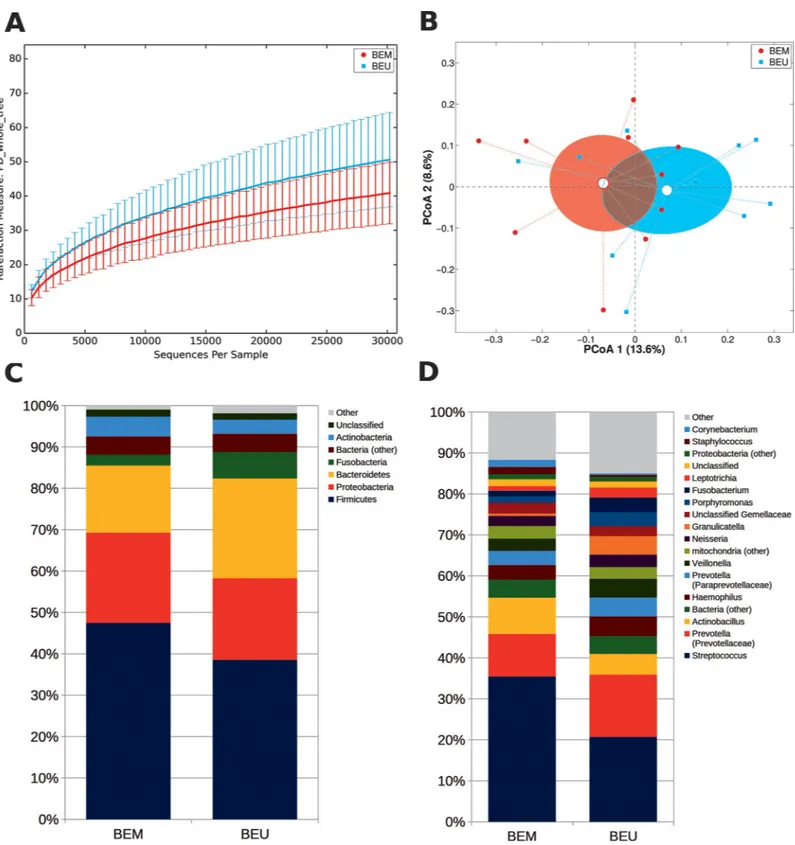
We further explored if microbiota compositional differences may reflect the division between metaplastic and adjacent healthy tissue. This resulted in a trend towards a decreased α-diver-sity in BEM areas (p = 0.102, PD_whole_tree metric) and a close clustering between BEM and BEU samples (Fig 4A and 4B). However, metaplastic tissue showed a reduced abundance of several groups, compared to adjacent healthy areas, including:Bacteroidetes (p = 0.049) and TM7 (p = 0.002) at the phylum level; Prevotellaceae (p = 0.027), Veillonellaceae (p = 0.014), Fusobacteriaceae (p = 0.027), Lachnospiraceae (p = 0.048) and Campylobacteraceae (p = 0.008)
at the family level; andPrevotella (p = 0.027), Fusobacterium (p = 0.04), Campylobacter
(p = 0.008) andSelenomonas (p = 0.006) at the genus level (Fig 4C and 4D). As expected, phy-logenetic distances were more similar between samples from the same patient than across dif-ferent individuals (p<0.05 for all distances, seeS4 Fig).
Microbiota-related functional profiles across esophageal disease stages
We finally investigated microbiota-related functional predictions of EAC and BEM compared to those of healthy controls (Fig 5). Patients with EAC showed a significant upregulation of microbial genes related to energy metabolism, metabolism of cofactors and vitamins, cellular processes and signaling, while fatty-acids biosynthesis and nitrogen and D-alanine pathways were consistently down-regulated compared to CTRL (Fig 5A). Microbiota associated to BEM was characterized by a higher potential for replication and repair, genetic information process-ing, metabolism of cofactors and vitamins, energy metabolism, amino acids, nucleotides, lipids and glycan metabolisms, while showed robustly reduced xenobiotics biodegradation and metabolism, carbohydrates and lipoic acid metabolism compared with control-associated microbiota (Fig 5B).
Finally, when comparing EAC and BEM samples, EAC-associated microbiota showed a sig-nificantly increased amino acid metabolism, energy metabolism, porphyrin, beta-alanin, D-arginine and D-ornithine metabolism. Conversely, it displayed a consistently decreased, car-bohydrate metabolism, glycan biosynthesis and metabolism, folate biosynthesis and nucleotide metabolism pathways (Fig 5C).
Microbiota-related functional profiles in Barrett patients’ metaplastic and
unaffected mucosa
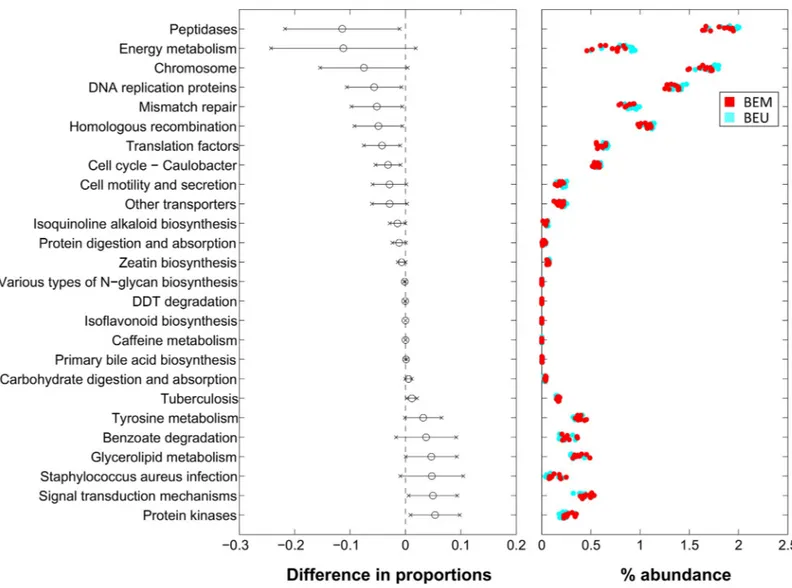
Differences in the microbial composition reflected also in a different predicted functional pro-file between BEM and BEU samples coming from the same individual (Fig 6). In particular, BEM mucosa samples showed a significant depletion of pathways belonging to replication and repair and translation (i.e., chromosome, DNA replication proteins, mismatch repair,
homolo-gous recombination and translation factors), while DDT degradation, benzoate degradation (belonging to xenobiotics degradation and metabolism L2-pathway), primary bile acid biosyn-thesis and glycerolipid metabolism (belonging to lipid metabolism L2-pathway) were
increased. Other notable differences involved enzyme families, with peptidases decreased and protein kinases increased in BEM as compared to BEU. Finally, isoflavonoid biosynthesis, caf-feine metabolism and tyrosine metabolism were augmented in BEM, whereas isoquinoline alkaloid biosynthesis, N-glycan biosynthesis and zeatin biosynthesis were depleted.
Fig 4. (A) Alpha-diversity rarefaction curve for Faith’s phylogenetic diversity (PD_whole_tree) metric for BEM and BEU samples from BE patients. Curves represent the average value of all the samples within the experimental category; error bars represent standard deviations. (B) PCoA plot of the Bray-Curtis distances among samples; each point represents a sample, centroids are calculated as the mean coordinate of all samples per experimental category (BEM or BEU); ellipses represent the SEM-based estimation of the variance. The first and second components of the variance are shown. (C,D) Barplots of the relative abundance of the main bacterial taxa at phylum or genus level for BEM or BEU samples. Data represent the average of the relative abundance of all samples per experimental category. Only the 7 most abundant phyla and the 20 most abundant genera are plotted. BEM: esophageal metaplastic samples; BEU: normal esophageal samples obtained from patients with Barrett’s esophagus.
Discussion
Increasing evidence has supported a critical role of microbiota in GI [5–8] and extra-intestinal diseases [9–12], and also in various types of cancers [13,14]. However, few information exist on upper GI, while the majority of studies have focused on sites easier and less invasive to sam-ple. Moreover, the available studies have not been designed to comprehensively evaluate through 16S-based amplicon sequencing the whole normal-BE-EAC human mucosal spec-trum and thus have yielded mixed results [24,39,40]. In the present study, we report not only
Fig 5. Level-3 KEGG pathways significantly different between (A) EAC and CTRL, (B) BEM and CTRL (C) EAC and BEM samples from PiCRUST functional prediction. Pathways are represented on the basis of increasing difference between average proportions in the experimental categories (Black circles, leftmost panel); for each pathway, the 95% confidence interval is also represented. Rightmost panel shows the % abundance of each sample; colors indicate the experimental categories. BEM: esophageal metaplastic samples; EAC: esophageal adenocarcinoma samples; CTRL: healthy control samples.
https://doi.org/10.1371/journal.pone.0231789.g005
Fig 6. Level-3 KEGG pathways significantly different between BEM and BEU samples from PiCRUST functional prediction. Pathways are represented on the basis of increasing difference between average proportions in the experimental categories (Black circles, leftmost panel); for each pathway, the 95% confidence interval is also represented. Rightmost panel shows the % abundance of each sample; colors indicate the experimental categories. BEM: esophageal metaplastic samples; BEU: normal esophageal samples obtained from patients with Barrett’s esophagus.
a thorough characterization of the microbial signature that differentiates BE and EAC, but also underline the microbial regional differences between BEU and BEM mucosa. Firstly, we found that a higher number of OTUs distinguishes BE and EAC from control samples. Indeed, α-bio-diversity analysis showed higher values for BE and EAC, although the difference was not statis-tically significant.β-diversity assessment suggested a trend towards a clusterization of three groups with a different phylogenetic composition between controls and EAC, as well as between BEM and EAC. This indicated a potential relationship between the disease and the local microbial community. In order to reinforce this hypothesis, we, then, explored taxo-nomic characteristics for each group. At the phylum level, a progressive reduction of Firmi-cutes:Bacteroidetes ratio was registered from BE to EAC. Members of the phylum Firmicutes
are known to be the major components of the microbiota of the normal esophagus [24]. Of note, this is in contrast with the composition of intestinal microbiota whereBacteroidetes
rep-resent the predominant phylum and a dysbiotic increase ofFirmicutes:Bacteroidetes ratio is
correlated with intestinal and extra-intestinal diseases [41].Firmicutes:Bacteroidetes ratio
reduction was mainly explained by a progressive reduction ofStreptococcus relative abundance
followed by a corresponding increase ofPrevotella in BEM, which appeared even more marked
and significant in EAC. A co-exclusion association between the two dominant taxa Streptococ-cus and Prevotella is constantly detected in the studies on esophaegeal microbiome [23]. A pre-vious report on reflux esophagitis and BE characterized distal esophagus microbiota into two types. Type I microbiome was correlated with normal esophagus and, mainly, contained Gram-positive bacteria, primarilyFirmicutes, and especially Streptococcus. Type II
micro-biome, mainly associated with reflux esophagitis and BE, was predominated by Gram-negative anaerobes and microaerophiles (phylaBacteroidetes, Proteobacteria, Fusobacteria, and Spiro-chaetes) [41]. Further studies established that the dominant taxon within the healthy esophagus isStreptococcus [42] and that the EAC cascade is depicted by a shift towards a prevalence of Gram-negative species [22]. While following analyses have not replicated these observations [43], others have included the increase enrichment of specific Gram-negative species such as
Campylobacter and Fusobacterium in the EAC process [44,45]. Our data confirm the charac-teristics of normal microbiota at esophageal level, withStreptococcus representing the main
component. Beside this, it portrays EAC as an extreme dysbiotic perturbation of BEM micro-biota, which is dominated by Gram-negative anaerobes. Among these,Leptotrichia (phylum: Fusobacteria), despite being a subdominant member of the community, emerges as the
princi-pal discriminating genus for EAC.Fusobacteria are anaerobic, non-spore-forming,
Gram-neg-ative bacilli with two major families,Leptotrichiaceae and Fusobacteriaceae usually identified
in the human oral cavity [46]. Although a broad genetic diversity characterizesLeptotrichia,
with six species belonging to this genus identified so far [47], its exact involvement in human physiology is still not well established. It is considered an opportunistic pathogen, which is more prone to trigger disease concomitantly with local or systemic predisposing conditions. It has been described in several human infections [47–49] and human cancers, such as colon [50], gastric [51] and pancreatic neoplasia [52].Leptotrichia stimulates a human immune
response and serum anti-Leptotrichia antibodies are common [47]. We can speculate that the immune activity provoked byLeptotrichia, rather than Leptotrichia itself, may facilitate
esoph-ageal tumorigenesis.
Moreover,Leptotrichia increase in BEM and EAC is followed by a corresponding elevation
ofVeillonella and Prevotella, other bacteria commonly found in the oral cavity, which could be
plausible pro-oncogenic partners, as they have been reported to be associated with different cancers [51,53–57]. The enrichment of oral organisms is increasingly being shown across sev-eral types of tumor [58,59]. This is in line with the theory that EAC cascade may be linked to
an enrichment of a diverse group of microorganisms with common features rather than spe-cific microorganisms [23].
Interestingly, these genera are forming a network of positively correlated bacteria ( Prevo-tella CAG) strictly linked to BEM and EAC. Their growth is balanced by a corresponding
sig-nificant reduction of clusters linked to the healthy condition. Indeed, BEM group showed a tendency, although not statistically significant, towards the reduction ofStaphylococcus CAG
and an increase ofPrevotella CAG. EAC samples were characterized by a marked decrease of Streptococcus CAG and an increase of Prevotella CAG. The enrichment of networks of oral
organisms has been reported in gastric cancer [51] and colorectal cancer [60] and it has been associated with inflammation in the gut [61].
The variation of these main clusters could sustain crucial physio-pathological consequences at mucosal level and promote a pro-inflammatory environment. Firstly, we can hypothesize that the increase and co-aggregation of Gram-negative organisms could lead to the formation of a biofilm and to the activation of the innate immune response through specific molecules, such as lipopolysaccharide (LPS) [41], with consequent stimulation of the nuclear factor kappa-B (NF-kB) expression and the release of inflammatory cytokines (i.e., interleukin-1β, -6,
-8, and tumor necrosis factor-α). At the same time, Bacteroidetes could contribute to the main-tenance of other microbial members by providing essential factors such as short fatty acids and the CO2and H2gas [22]. This could sustain the inflammatory and tumorigenic process
along the BE-EAC spectrum [21,62,63]. Indeed, our predictive functional analysis confirmed this hypothesis and also pointed out peculiar functional profiles for each group of samples. Microbiota associated to BEM was characterized by a high potential for replication and repair. Similarly, patients with EAC showed significantly upregulated microbial genes related to energy metabolism, replication and signaling, with, interestingly, the fatty-acids biosynthesis and nitrogen and D-alanine pathways consistently down-regulated, also when compared with BEM.
Finally, we explored potential regional microbiota variations among BE samples by distin-guishing the metaplastic areas from those with normal mucosa. Our data underlined not only a clearly different microbial structure between BEM and BEU, but also an unexpected impor-tant distinction at the microbiological and inferred functional level between the normal mucosa obtained from BE patients and that biopsied from controls, reinforcing the innovative concept that microbiota could represent a predisposing factor of BE. At the same time, this dis-tinction could be due to a potential influence exerted on BEU by the microbiota inhabiting the near metaplastic areas.
Overall, our study describes peculiar microbial compositional and functional differences using 16S-based amplicon sequencing to compare normal, BEU, BEM and EAC mucosa in humans. This study is not without limitations. Despite the significant alterations identified, this is a pilot study with a low number of patients. Additional studies with a larger cohort of subjects are warranted. However, although the number of mucosal samples collected was small, patients’ selection and sample processing were conducted in order to reduce confound-ing factors.
Other studies have indicated that genetic tests could characterize BE and EAC and predict the disease progression [64,65]. Our data show that specific microbial markers can, further, differentiate BEU, BEM and EAC. The identification of the microbial communities associated with cancer is of crucial importance in order to find risk factors and to hypothetically guide surveillance protocols. Thus, if coupled, genetic and microbial markers may help to prevent EAC or detect it at earlier, treatable stages, reducing the need for repeated surveillance proce-dures on large number of patients who never progress to cancer, thus ameliorating the man-agement of this debilitating disease.
Supporting information
S1 File. (PDF)
S1 Fig. Cladogram from LefSE (Linear discriminant analysis Effect Size) analysis on EAC, BEM and healthy controls. Cladogram shows taxa likely to distinguish experimental classes. Phylum, classes and orders are reported on the cladogram, whereas differential families and genera are named in the legend. No feature was found for BEM samples. BEM: esophageal metaplastic samples; EAC: esophageal adenocarcinoma samples; CTRL: healthy control sam-ples.
(TIF)
S2 Fig. Boxplots showing the relative abundance of some (A) Veillonella and (B) Prevotella species. The contribution of each species is reported as a proportion on the total reads in the corresponding genus. Only samples with �0.5% rel. ab. in the specific genus were considered. Each point represents a sample; median values are reported as yellow lines, whereas means are in cyan. BEM: esophageal metaplastic samples; EAC: esophageal adenocarcinoma samples; CTRL: healthy control samples.
(TIF)
S3 Fig. Definition of bacterial co-abundance groups (CAGs). (A) Heatmap used to define CAGs, showing the Kendall correlation coefficient between genera and hierarchically clustered on the basis of Euclidean distance and Ward linkage. Only genera present at least at 1% relative abundance in at least 30% of the samples per experimental condition (i.e., CTRL, BEM, EAC)
are shown. Clustering is performed only on genera whose correlation is statistically different from 0 (p-value of the linear model <0.05). (B) Network plot highlighting correlation
relation-ships of CAGs for the whole dataset (n = 26). Circle sizes indicate genus abundances and line thickness is proportional to correlation value. Red lines indicate a positive correlation value; blue lines a negative one. (C) Bar plots showing the average cumulative relative abundance of each CAG in the microbiota of the subjects for each experimental group. In grey, the portion of genera not belonging to the identified CAGs due to the initial filtering is represented. BEM: esophageal metaplastic samples; EAC: esophageal adenocarcinoma samples; CTRL: healthy control samples.
(TIF)
S4 Fig. Analysis of distances between paired BEM and BEU samples. (A) PCoA plot based on the Bray-Curtis distances among samples. Paired data from BEU and BEM mucosal biop-sies from the same BE patient (n = 10) are shown. (B) Boxplot of intra- (within) and inter-sam-ple (between) distances. “Within” are the distances between each paired BEM-BEU saminter-sam-ple from the same patient; “Between” samples distances are calculated as the median of all the dis-tances between each BEM sample and the BEU sample from other patients. BEM: esophageal metaplastic samples; BEU: normal esophageal samples obtained from patients with Barrett’s esophagus.
(TIF)
S5 Fig. Boxplots showing the relative abundance of the main (A) phyla and (B) genera in BEM, EAC and CTRL samples. Each point represents a sample; median values are reported as yellow lines, whereas means are in cyan. BEM: esophageal metaplastic samples; EAC: esoph-ageal adenocarcinoma samples; CTRL: healthy control samples.
S6 Fig. (TIFF)
Author Contributions
Conceptualization: Loris Riccardo Lopetuso, Ivo Boskoski, Alberto Larghi, Luca Masucci, Antonio Gasbarrini, Giovanni Cammarota.
Data curation: Loris Riccardo Lopetuso, Marco Severgnini, Silvia Pecere, Francesca Romana Ponziani, Alberto Larghi, Gianluca Quaranta, Luca Masucci, Gianluca Ianiro, Tania Cam-boni, Clarissa Consolandi, Giovanni Cammarota.
Formal analysis: Loris Riccardo Lopetuso, Marco Severgnini, Luca Masucci, Tania Camboni. Funding acquisition: Giovanni Cammarota.
Investigation: Loris Riccardo Lopetuso, Marco Severgnini, Silvia Pecere, Ivo Boskoski, Alberto Larghi, Gianluca Quaranta, Gianluca Ianiro, Tania Camboni, Giovanni Cammarota.
Methodology: Loris Riccardo Lopetuso, Marco Severgnini, Francesca Romana Ponziani, Gianluca Quaranta, Luca Masucci, Gianluca Ianiro, Tania Camboni, Clarissa Consolandi. Resources: Antonio Gasbarrini, Guido Costamagna, Clarissa Consolandi, Giovanni
Cammarota.
Software: Marco Severgnini.
Supervision: Antonio Gasbarrini, Guido Costamagna, Clarissa Consolandi, Giovanni Cammarota.
Validation: Loris Riccardo Lopetuso, Marco Severgnini, Clarissa Consolandi, Giovanni Cammarota.
Writing – original draft: Loris Riccardo Lopetuso, Marco Severgnini, Francesca Romana Ponziani, Clarissa Consolandi.
Writing – review & editing: Loris Riccardo Lopetuso, Marco Severgnini, Francesca Romana Ponziani, Antonio Gasbarrini, Guido Costamagna, Clarissa Consolandi, Giovanni Cammarota.
References
1. Parkin DM, Bray F, Ferlay J, Pisani P. Global cancer statistics, 2002. CA Cancer J Clin. 2005; 55(2):74– 108.https://doi.org/10.3322/canjclin.55.2.74PMID:15761078.
2. Cancer Genome Atlas Research N, Analysis Working Group: Asan U, Agency BCC, Brigham, Women’s H, Broad I, et al. Integrated genomic characterization of oesophageal carcinoma. Nature. 2017; 541 (7636):169–75.https://doi.org/10.1038/nature20805PMID:28052061; PubMed Central PMCID: PMC5651175.
3. Lao-Sirieix P, Corovic A, Jankowski J, Lowe A, Triadafilopoulos G, Fitzgerald RC. Physiological and molecular analysis of acid loading mechanisms in squamous and columnar-lined esophagus. Dis Esophagus. 2008; 21(6):529–38.https://doi.org/10.1111/j.1442-2050.2007.00807.xPMID:18840137.
4. Baba Y, Watanabe M, Yoshida N, Kawanaka K, Yamashita Y, Baba H. Radiofrequency ablation for pul-monary metastases from gastrointestinal cancers. Ann Thorac Cardiovasc Surg. 2014; 20(2):99–105.
https://doi.org/10.5761/atcs.ra.13-00343PMID:24583709.
5. Rostami Nejad M, Ishaq S, Al Dulaimi D, Zali MR, Rostami K. The role of infectious mediators and gut microbiome in the pathogenesis of celiac disease. Arch Iran Med. 2015; 18(4):244–9. doi: 015184/ AIM.0010 PMID:25841946.
6. Ohkusa T, Okayasu I, Ogihara T, Morita K, Ogawa M, Sato N. Induction of experimental ulcerative coli-tis by Fusobacterium varium isolated from colonic mucosa of patients with ulcerative colicoli-tis. Gut. 2003; 52(1):79–83.https://doi.org/10.1136/gut.52.1.79PMID:12477765; PubMed Central PMCID: PMC1773498.
7. Kostic AD, Xavier RJ, Gevers D. The microbiome in inflammatory bowel disease: current status and the future ahead. Gastroenterology. 2014; 146(6):1489–99.https://doi.org/10.1053/j.gastro.2014.02.009
PMID:24560869; PubMed Central PMCID: PMC4034132.
8. Lopetuso LR, Petito V, Graziani C, Schiavoni E, Paroni Sterbini F, Poscia A, et al. Gut Microbiota in Health, Diverticular Disease, Irritable Bowel Syndrome, and Inflammatory Bowel Diseases: Time for Microbial Marker of Gastrointestinal Disorders. Digestive diseases. 2018; 36(1):56–65.https://doi.org/ 10.1159/000477205PMID:28683448.
9. Ley RE, Turnbaugh PJ, Klein S, Gordon JI. Microbial ecology: human gut microbes associated with obesity. Nature. 2006; 444(7122):1022–3.https://doi.org/10.1038/4441022aPMID:17183309.
10. Hotamisligil GS. Inflammation and metabolic disorders. Nature. 2006; 444(7121):860–7.https://doi.org/ 10.1038/nature05485PMID:17167474.
11. Cani PD, Osto M, Geurts L, Everard A. Involvement of gut microbiota in the development of low-grade inflammation and type 2 diabetes associated with obesity. Gut microbes. 2012; 3(4):279–88.https://doi. org/10.4161/gmic.19625PMID:22572877; PubMed Central PMCID: PMC3463487.
12. Fujimura KE, Lynch SV. Microbiota in allergy and asthma and the emerging relationship with the gut microbiome. Cell host & microbe. 2015; 17(5):592–602.https://doi.org/10.1016/j.chom.2015.04.007
PMID:25974301; PubMed Central PMCID: PMC4443817.
13. Vogtmann E, Goedert JJ. Epidemiologic studies of the human microbiome and cancer. British journal of cancer. 2016; 114(3):237–42.https://doi.org/10.1038/bjc.2015.465PMID:26730578; PubMed Central PMCID: PMC4742587.
14. Garrett WS. Cancer and the microbiota. Science. 2015; 348(6230):80–6.https://doi.org/10.1126/ science.aaa4972PMID:25838377; PubMed Central PMCID: PMC5535753.
15. Yang Y, Jobin C. Novel insights into microbiome in colitis and colorectal cancer. Curr Opin Gastroen-terol. 2017; 33(6):422–7.https://doi.org/10.1097/MOG.0000000000000399PMID:28877044; PubMed Central PMCID: PMC5826583.
16. Zitvogel L, Ayyoub M, Routy B, Kroemer G. Microbiome and Anticancer Immunosurveillance. Cell. 2016; 165(2):276–87.https://doi.org/10.1016/j.cell.2016.03.001PMID:27058662.
17. Johnson CH, Spilker ME, Goetz L, Peterson SN, Siuzdak G. Metabolite and Microbiome Interplay in Cancer Immunotherapy. Cancer research. 2016; 76(21):6146–52.https://doi.org/10.1158/0008-5472. CAN-16-0309PMID:27729325; PubMed Central PMCID: PMC5093024.
18. Elinav E, Nowarski R, Thaiss CA, Hu B, Jin C, Flavell RA. Inflammation-induced cancer: crosstalk between tumours, immune cells and microorganisms. Nat Rev Cancer. 2013; 13(11):759–71.https:// doi.org/10.1038/nrc3611PMID:24154716.
19. Dzutsev A, Goldszmid RS, Viaud S, Zitvogel L, Trinchieri G. The role of the microbiota in inflammation, carcinogenesis, and cancer therapy. Eur J Immunol. 2015; 45(1):17–31.https://doi.org/10.1002/eji. 201444972PMID:25328099.
20. Weaver JM, Ross-Innes CS, Fitzgerald RC. The ’-omics’ revolution and oesophageal adenocarcinoma. Nature reviews Gastroenterology & hepatology. 2014; 11(1):19–27.https://doi.org/10.1038/nrgastro. 2013.150PMID:23982683.
21. Yang L, Francois F, Pei Z. Molecular pathways: pathogenesis and clinical implications of microbiome alteration in esophagitis and Barrett esophagus. Clinical cancer research: an official journal of the Amer-ican Association for Cancer Research. 2012; 18(8):2138–44. https://doi.org/10.1158/1078-0432.CCR-11-0934PMID:22344232; PubMed Central PMCID: PMC3725293.
22. Yang L, Lu X, Nossa CW, Francois F, Peek RM, Pei Z. Inflammation and intestinal metaplasia of the dis-tal esophagus are associated with alterations in the microbiome. Gastroenterology. 2009; 137(2):588– 97.https://doi.org/10.1053/j.gastro.2009.04.046PMID:19394334; PubMed Central PMCID:
PMC2963147.
23. Deshpande NP, Riordan SM, Castano-Rodriguez N, Wilkins MR, Kaakoush NO. Signatures within the esophageal microbiome are associated with host genetics, age, and disease. Microbiome. 2018; 6 (1):227.https://doi.org/10.1186/s40168-018-0611-4PMID:30558669; PubMed Central PMCID: PMC6297961.
24. Baba Y, Iwatsuki M, Yoshida N, Watanabe M, Baba H. Review of the gut microbiome and esophageal cancer: Pathogenesis and potential clinical implications. Ann Gastroenterol Surg. 2017; 1(2):99–104.
25. Masella AP, Bartram AK, Truszkowski JM, Brown DG, Neufeld JD. PANDAseq: paired-end assembler for illumina sequences. BMC Bioinformatics. 2012; 13:31.https://doi.org/10.1186/1471-2105-13-31
PMID:22333067; PubMed Central PMCID: PMC3471323.
26. Caporaso JG, Kuczynski J, Stombaugh J, Bittinger K, Bushman FD, Costello EK, et al. QIIME allows analysis of high-throughput community sequencing data. Nat Methods. 2010; 7(5):335–6.https://doi. org/10.1038/nmeth.f.303PMID:20383131; PubMed Central PMCID: PMC3156573.
27. Edgar RC. Search and clustering orders of magnitude faster than BLAST. Bioinformatics. 2010; 26 (19):2460–1.https://doi.org/10.1093/bioinformatics/btq461PMID:20709691.
28. Wang Q, Garrity GM, Tiedje JM, Cole JR. Naive Bayesian classifier for rapid assignment of rRNA sequences into the new bacterial taxonomy. Appl Environ Microbiol. 2007; 73(16):5261–7.https://doi. org/10.1128/AEM.00062-07PMID:17586664; PubMed Central PMCID: PMC1950982.
29. Lozupone C, Knight R. UniFrac: a new phylogenetic method for comparing microbial communities. Appl Environ Microbiol. 2005; 71(12):8228–35.https://doi.org/10.1128/AEM.71.12.8228-8235.2005PMID:
16332807; PubMed Central PMCID: PMC1317376.
30. Oksanen J, Blanchet FG, Kindt R, Legendre P, Minchin PR. Package “Vegan”. R Package Version 2.0– 102013. Available from:https://cran.r-project.org/src/contrib/Archive/vegan/vegan_2.0-10.tar.gz.
31. Segata N, Izard J, Waldron L, Gevers D, Miropolsky L, Garrett WS, et al. Metagenomic biomarker dis-covery and explanation. Genome Biol. 2011; 12(6):R60.https://doi.org/10.1186/gb-2011-12-6-r60
PMID:21702898; PubMed Central PMCID: PMC3218848.
32. Diviccaro S, Giatti S, Borgo F, Barcella M, Borghi E, Trejo JL, et al. Treatment of male rats with finaste-ride, an inhibitor of 5alpha-reductase enzyme, induces long-lasting effects on depressive-like behavior, hippocampal neurogenesis, neuroinflammation and gut microbiota composition. Psychoneuroendocri-nology. 2019; 99:206–15.https://doi.org/10.1016/j.psyneuen.2018.09.021PMID:30265917.
33. Borghi E, Borgo F, Severgnini M, Savini MN, Casiraghi MC, Vignoli A. Rett Syndrome: A Focus on Gut Microbiota. International journal of molecular sciences. 2017; 18(2).https://doi.org/10.3390/
ijms18020344PMID:28178201; PubMed Central PMCID: PMC5343879.
34. Ceccarani C, Foschi C, Parolin C, D’Antuono A, Gaspari V, Consolandi C, et al. Diversity of vaginal microbiome and metabolome during genital infections. Scientific reports. 2019; 9(1):14095.https://doi. org/10.1038/s41598-019-50410-xPMID:31575935; PubMed Central PMCID: PMC6773718.
35. Claesson MJ, Jeffery IB, Conde S, Power SE, O’Connor EM, Cusack S, et al. Gut microbiota composi-tion correlates with diet and health in the elderly. Nature. 2012; 488(7410):178–84.https://doi.org/10. 1038/nature11319PMID:22797518.
36. Shannon P, Markiel A, Ozier O, Baliga NS, Wang JT, Ramage D, et al. Cytoscape: a software environ-ment for integrated models of biomolecular interaction networks. Genome research. 2003; 13 (11):2498–504.https://doi.org/10.1101/gr.1239303PMID:14597658; PubMed Central PMCID: PMC403769.
37. Langille MG, Zaneveld J, Caporaso JG, McDonald D, Knights D, Reyes JA, et al. Predictive functional profiling of microbial communities using 16S rRNA marker gene sequences. Nat Biotechnol. 2013; 31 (9):814–21.https://doi.org/10.1038/nbt.2676PMID:23975157; PubMed Central PMCID:
PMC3819121.
38. Kanehisa M, Sato Y, Kawashima M, Furumichi M, Tanabe M. KEGG as a reference resource for gene and protein annotation. Nucleic Acids Res. 2016; 44(D1):D457–62.https://doi.org/10.1093/nar/ gkv1070PMID:26476454; PubMed Central PMCID: PMC4702792.
39. Lv J, Guo L, Liu JJ, Zhao HP, Zhang J, Wang JH. Alteration of the esophageal microbiota in Barrett’s esophagus and esophageal adenocarcinoma. World journal of gastroenterology: WJG. 2019; 25 (18):2149–61.https://doi.org/10.3748/wjg.v25.i18.2149PMID:31143067; PubMed Central PMCID: PMC6526156.
40. Elliott DRF, Walker AW, O’Donovan M, Parkhill J, Fitzgerald RC. A non-endoscopic device to sample the oesophageal microbiota: a case-control study. Lancet Gastroenterol Hepatol. 2017; 2(1):32–42.
https://doi.org/10.1016/S2468-1253(16)30086-3PMID:28404012; PubMed Central PMCID: PMC5656094.
41. Kahrstrom CT, Pariente N, Weiss U. Intestinal microbiota in health and disease. Nature. 2016; 535 (7610):47.https://doi.org/10.1038/535047aPMID:27383978.
42. Pei Z, Bini EJ, Yang L, Zhou M, Francois F, Blaser MJ. Bacterial biota in the human distal esophagus. Proc Natl Acad Sci U S A. 2004; 101(12):4250–5.https://doi.org/10.1073/pnas.0306398101PMID:
15016918; PubMed Central PMCID: PMC384727.
43. Amir I, Konikoff FM, Oppenheim M, Gophna U, Half EE. Gastric microbiota is altered in oesophagitis and Barrett’s oesophagus and further modified by proton pump inhibitors. Environ Microbiol. 2014; 16 (9):2905–14.https://doi.org/10.1111/1462-2920.12285PMID:24112768.
44. Blackett KL, Siddhi SS, Cleary S, Steed H, Miller MH, Macfarlane S, et al. Oesophageal bacterial biofilm changes in gastro-oesophageal reflux disease, Barrett’s and oesophageal carcinoma: association or causality? Alimentary pharmacology & therapeutics. 2013; 37(11):1084–92.https://doi.org/10.1111/ apt.12317PMID:23600758.
45. Macfarlane S, Furrie E, Macfarlane GT, Dillon JF. Microbial colonization of the upper gastrointestinal tract in patients with Barrett’s esophagus. Clinical infectious diseases: an official publication of the Infec-tious Diseases Society of America. 2007; 45(1):29–38.https://doi.org/10.1086/518578PMID:
17554697.
46. Dewhirst FE, Chen T, Izard J, Paster BJ, Tanner AC, Yu WH, et al. The human oral microbiome. Journal of bacteriology. 2010; 192(19):5002–17.https://doi.org/10.1128/JB.00542-10PMID:20656903; PubMed Central PMCID: PMC2944498.
47. Eribe ER, Olsen I. Leptotrichia species in human infections. Anaerobe. 2008; 14(3):131–7.https://doi. org/10.1016/j.anaerobe.2008.04.004PMID:18539056.
48. Couturier MR, Slechta ES, Goulston C, Fisher MA, Hanson KE. Leptotrichia bacteremia in patients receiving high-dose chemotherapy. Journal of clinical microbiology. 2012; 50(4):1228–32.https://doi. org/10.1128/JCM.05926-11PMID:22205794; PubMed Central PMCID: PMC3318514.
49. Cooreman S, Schuermans C, Van Schaeren J, Olive N, Wauters G, Verhaegen J, et al. Bacteraemia caused by Leptotrichia trevisanii in a neutropenic patient. Anaerobe. 2011; 17(1):1–3.https://doi.org/10. 1016/j.anaerobe.2010.12.002PMID:21184838.
50. Kim K, Castro EJT, Shim H, Advincula JVG, Kim YW. Differences Regarding the Molecular Features and Gut Microbiota Between Right and Left Colon Cancer. Ann Coloproctol. 2018; 34(6):280–5.https:// doi.org/10.3393/ac.2018.12.17PMID:30630301; PubMed Central PMCID: PMC6347335.
51. Castano-Rodriguez N, Goh KL, Fock KM, Mitchell HM, Kaakoush NO. Dysbiosis of the microbiome in gastric carcinogenesis. Scientific reports. 2017; 7(1):15957. https://doi.org/10.1038/s41598-017-16289-2PMID:29162924; PubMed Central PMCID: PMC5698432.
52. Fan X, Alekseyenko AV, Wu J, Peters BA, Jacobs EJ, Gapstur SM, et al. Human oral microbiome and prospective risk for pancreatic cancer: a population-based nested case-control study. Gut. 2018; 67 (1):120–7.https://doi.org/10.1136/gutjnl-2016-312580PMID:27742762; PubMed Central PMCID: PMC5607064.
53. Geng J, Song Q, Tang X, Liang X, Fan H, Peng H, et al. Co-occurrence of driver and passenger bacteria in human colorectal cancer. Gut pathogens. 2014; 6:26.https://doi.org/10.1186/1757-4749-6-26PMID:
24995042; PubMed Central PMCID: PMC4080773.
54. Guerrero-Preston R, Godoy-Vitorino F, Jedlicka A, Rodriguez-Hilario A, Gonzalez H, Bondy J, et al. 16S rRNA amplicon sequencing identifies microbiota associated with oral cancer, human papilloma virus infection and surgical treatment. Oncotarget. 2016; 7(32):51320–34.https://doi.org/10.18632/ oncotarget.9710PMID:27259999; PubMed Central PMCID: PMC5239478.
55. Yan X, Yang M, Liu J, Gao R, Hu J, Li J, et al. Discovery and validation of potential bacterial biomarkers for lung cancer. Am J Cancer Res. 2015; 5(10):3111–22. PMID:26693063; PubMed Central PMCID: PMC4656734.
56. Bundgaard-Nielsen C, Baandrup UT, Nielsen LP, Sorensen S. The presence of bacteria varies between colorectal adenocarcinomas, precursor lesions and non-malignant tissue. BMC cancer. 2019; 19 (1):399.https://doi.org/10.1186/s12885-019-5571-yPMID:31035942; PubMed Central PMCID: PMC6489238.
57. Karpinski TM. Role of Oral Microbiota in Cancer Development. Microorganisms. 2019; 7(1).https://doi. org/10.3390/microorganisms7010020PMID:30642137; PubMed Central PMCID: PMC6352272.
58. Hieken TJ, Chen J, Hoskin TL, Walther-Antonio M, Johnson S, Ramaker S, et al. The Microbiome of Aseptically Collected Human Breast Tissue in Benign and Malignant Disease. Scientific reports. 2016; 6:30751.https://doi.org/10.1038/srep30751PMID:27485780; PubMed Central PMCID: PMC4971513.
59. Li S, Konstantinov SR, Smits R, Peppelenbosch MP. Bacterial Biofilms in Colorectal Cancer Initiation and Progression. Trends in molecular medicine. 2017; 23(1):18–30.https://doi.org/10.1016/j.molmed. 2016.11.004PMID:27986421.
60. Flemer B, Warren RD, Barrett MP, Cisek K, Das A, Jeffery IB, et al. The oral microbiota in colorectal cancer is distinctive and predictive. Gut. 2018; 67(8):1454–63. https://doi.org/10.1136/gutjnl-2017-314814PMID:28988196; PubMed Central PMCID: PMC6204958.
61. Atarashi K, Suda W, Luo C, Kawaguchi T, Motoo I, Narushima S, et al. Ectopic colonization of oral bac-teria in the intestine drives TH1 cell induction and inflammation. Science. 2017; 358(6361):359–65.
https://doi.org/10.1126/science.aan4526PMID:29051379; PubMed Central PMCID: PMC5682622.
62. Macfarlane S, Macfarlane GT. Regulation of short-chain fatty acid production. Proc Nutr Soc. 2003; 62 (1):67–72.https://doi.org/10.1079/PNS2002207PMID:12740060.
63. Konturek PC, Nikiforuk A, Kania J, Raithel M, Hahn EG, Muhldorfer S. Activation of NFkappaB repre-sents the central event in the neoplastic progression associated with Barrett’s esophagus: a possible link to the inflammation and overexpression of COX-2, PPARgamma and growth factors. Digestive dis-eases and sciences. 2004; 49(7–8):1075–83.https://doi.org/10.1023/b:ddas.0000037790.11724.70
PMID:15387324.
64. O’Riordan JM, Abdel-latif MM, Ravi N, McNamara D, Byrne PJ, McDonald GS, et al. Proinflammatory cytokine and nuclear factor kappa-B expression along the inflammation-metaplasia-dysplasia-adeno-carcinoma sequence in the esophagus. The American journal of gastroenterology. 2005; 100(6):1257– 64.https://doi.org/10.1111/j.1572-0241.2005.41338.xPMID:15929754.
65. Abdel-Latif MM, Kelleher D, Reynolds JV. Potential role of NF-kappaB in esophageal adenocarcinoma: as an emerging molecular target. J Surg Res. 2009; 153(1):172–80.https://doi.org/10.1016/j.jss.2007. 12.755PMID:18533190.