1 La presente tesi è cofinanziata con il sostegno della Commissione Europea, Fondo Sociale Europeo (FSE 2007-2013) e della Regione Calabria. L’autore è il solo responsabile di questa tesi e la Commissione Europea e la Regione Calabria declinano ogni responsabilità sull’uso che potrà essere fatto delle informazioni in essa contenute.
This thesis has been co-funded with support of the European Commission, the European Social Fund (ESF 2007-2013) and the Calabria Region. Author is the only responsible for this work and both European Commission and Calabria Region decline any responsibility for the use that may be done with the information contained therein.
2 I hereby certify that this submission is my own work. Any quotation from, or description of, the work of others is acknowledged herein by reference to the sources, whether published or unpublished.
3
Acknowledgments
I would foremost like to thank my supervisor, Professor Patrizia Piro for her support, patience, and wisdom throughout this process. I have grown professionally by being challenged to think independently and have gained confidence in my own judgment. I would like to express my sincere gratitude to Prof. Čedo Maksimović and Prof. Ana Deletić whose guidance, recommendations and suggestions have been invaluable for the development of this research project.
I would also like to thank Dr. Marco Carbone and Dr. Daniele Biagio Laucelli for reading and providing helpful comments as a second readers for this thesis.
I would like to thank my Italian colleagues and friends who accompanied and supported me during these three years of hard work.
Special thanks to my colleagues from Imperial College London and Monash University of Melbourne who helped me in many ways.
Finally, to my parents, who first suggested that I pursue engineering more than seven years ago; I am forever grateful for your encouragement and belief in me which has led to some of the best years of my life. Really thanks to them, and also to my sister Francesca, for having been always close to me.
4 These events for their heavy impact are called ‘extreme rainfall events’. The actual management of urban waters is unsustainable thus, foregoing reasons lead to an imperative need to develop new urban ecosystems, requiring a rethink of traditional development techniques. Traditional urban drainage systems are designed to rapidly collect and convey overland flows to the treatment plants, without taking into account of their qualitative characteristics. In order to reach the aim of the qualitative and quantitative control of stormwater in urban areas, a possible way is the widespread implementation in urban areas of ‘blue-green infrastructure’ that provide an holistic and integrated approach to the problem. They are one step beyond other ‘classic’ sustainable urban drainage measures such as LID (Low Impact Development), SUDS (Sustainable Urban Drainage Systems) or BMPs (Best Management Practices), allowing to emphasize their beneficial effects. Use of BGC as a part of sustainable drainage system concept is a winning approach, that allow managing and treatment of stormwater runoff within urban areas, using practices made of green and blue components. Generally green components are represented by any kind of existing vegetation (floral plants, grass, hedges) while the blue one by lakes, ponds, rivers and canals (natural or artificial). Together, these infrastructures allow to create a network between them at regional scale. The real behaviour of these structures is not yet properly modelled. Most of the software currently used in urban hydrology (SWMM by EPA, Music by eWater CRC, etc…) model in a reasonable way the hydraulic behaviour of infiltration practices (such as bioretention cells, infiltration trenches, vegetated filter strips, porous pavement) using a simple mass balance approach. Generation, inflow and transport of pollutants are, instead, determined by the land use assigned to each subcatchments, namely through buildup and washoff laws describing accumulation and washout by either a mass per unit of subcatchment area or per unit of curb length. This approach completely lack of quality algorithms within LID models that take into account of their quality
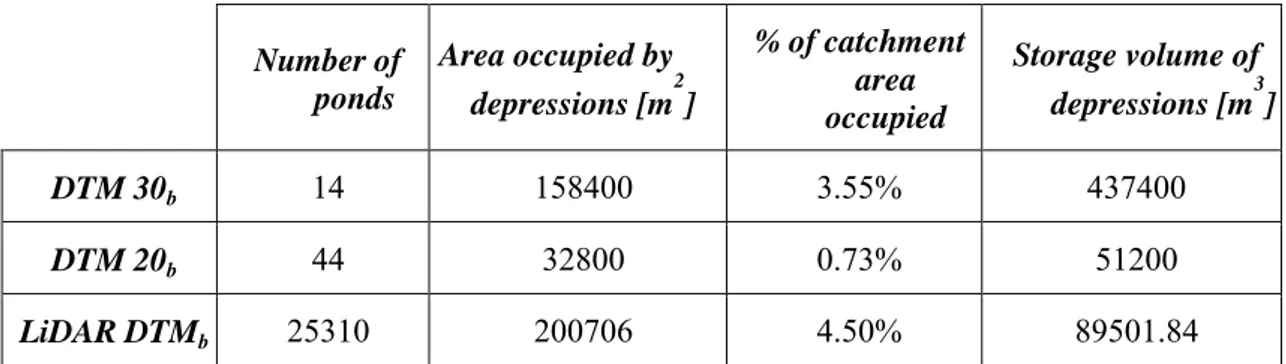
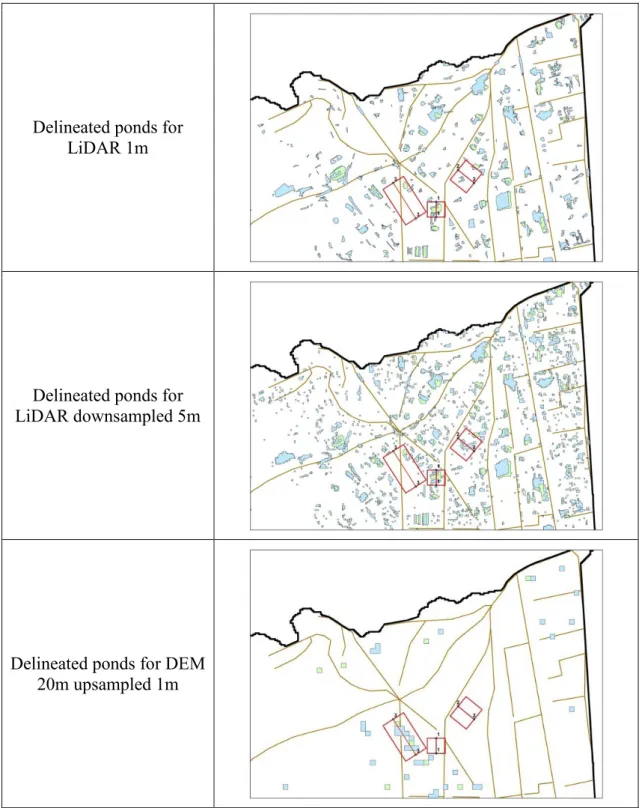
5 performances as, for instance, reduction of efficiency due to the clogging effect. The clogging phenomenon, described as the decrease in infiltration rate of the soil due to the reduction in soil porosity and hydraulic conductivity, occurs for the majority within infiltration practices such as bioretention cells, infiltration trenches, vegetated swales and permeable pavers. Precisely these latter practices are one of the easiest to implement into urban environment, being aimed to reduce impervious areas and work as ‘link’ within BGCs networks. From these premises the research in the following thesis is developed, whose main objective is to study the implementation of 'blue and green' elements in urban areas and their effect on pollutant loads reduction. Initially, a study of common errors retrieved within a DTM (Digital Terrain Model) has been faced because, if not corrected, they will affect the overland flow network generation and the subsequent hydraulic modelling. DEMs (Digital Elevation Models) can include both terrain elevation data, which commands flow direction of floodwater, and land cover information, which dictates resistance to floodwater distribution. Very often DTMs originate from a variety of ground observations supplemented by various remote sensing techniques (aerial and satellite measurements, total stations, dGPS, aerial LiDAR, terrestrial laser scanning) thus, containing systematic or random errors to individuate and eliminate. A study were carried out to evaluate how DTM resolutions and presence of building affect overland flow network delineation in the Liguori Channel basin, situated in Cosenza (Italy). To achieve this aim, three different DEMs of the study area, generated from different sources, were used: two contour-based DTMs with contour interval respectively of 30 m (DTM 30) and 20 m (DTM 20), and one LiDAR-based DEM, with horizontal resolution of 1 m (LIDAR DTM). Moreover, for a more in depth analysis, LIDAR DTMb (with buildings) cell size has been down sampled from 1 to 5 meters coarse resolution, in order to evaluate also, how cell size affect ponds delineation. Individuation of likely flood areas (ponds) has been carried out using Arc Hydro Tools developed at Centre for Research in Water Resources at University of Texas at Austin. Research highlighted how the correction of DEM generated from LiDAR data and other sources overlapping the buildings (i.e. retrieved from cadastral maps) help to diminish the total accumulated water volume into surface ponds, real or spurious, and also that their number does not depend by the raster cell size, but from the accuracy of the source data. Afterwards, a first attempt of best management practices implementation has been carried out within the Liguori Channel situated in Cosenza,
6 to the two previous cases, of a third scenario where LIDs may deal with clogging phenomenon. In order to perform the EPA SWMM modelling, a ‘residential’ land use has been defined, characterised by build-up and wash off laws for the considered pollutant (Total Suspended Solids – TSS). As regards the green roof and porous pavement simulation parameters, currently these values has been gathered from literature. Within SWMM, the clogging phenomenon is taken into account through a parameter called ‘clogging factor’ that considers the possible decay of LID performance due to the fine material carried by infiltration waters. The empirical formulation is affected by some parameters such as the number of years it takes to fully clog the system (Yclog), the annual rainfall amount over the site (Pa), the pavement's capture ratio CR (area that contributes runoff to the pavement divided by area of the pavement itself), the system's void ratio (VR), the Impervious Surface Fraction (ISF) and the pavement layer thickness (T). The yearly simulation performed show how the percentage reduction of volumes into the network is around 35% on average each year, the mass of Total Suspended Solids is around 30% on average while the relative concentration undergoes an increment around 15%. The latter result can be explained looking at the SWMM runoff quality algorithm. In fact, currently SWMM takes into account of the reduction of pollutants only in terms of reduction of overland flow, due to the lacking of quality algorithms for LIDs simulation. Consequently, the presence of BMPs increases the amount of stormwater that infiltrates, decreasing runoff, therefore the mass of pollutants reaching the sewer outlet. The lower is the volumes of water reaching the sewer, keeping constant the total mass of pollutant over the catchment, the higher is the average outlet concentrations. The results of the continuous simulation are, also, very interesting. While during the annual simulations the trend of volumes for the scenario ‘LIDs with clogging’ ranges always between the other two cases, without and with LIDs, when the continuous simulation is considered, the volumes of the clogged
7 LID are even higher than the volumes occurring without any BMP implemented. The efficiency tends to decrease during time, from 50% when simulation starts to almost 0% at the end of the second year, continuing then to swing around zero per cent for the remaining part of the simulation. In this case, in fact, during the first two simulated years the trend is similar to what it has been found during the annual simulation, while starting from the third year (January 2010), volumes generated for the case ‘LIDs with clogging’ are equal or even higher than those ones generated when no LIDs are used. Although EPA SWMM results are interesting and indicative of LID operation, they are not very accurate, especially concerning the qualitative simulation of the stormwater management practices. For this reason, later, the research has been focused on improving the qualitative simulation algorithms, with particular attention to porous pavements. Data collected into an experimental laboratory rig of three different and widely used permeable pavement types has been analysed. The investigated systems were: monolithic porous asphalt (PA), modular Hydrapave (HP), and monolithic Permapave (PP). The rig, made of three vertical compartments in which the three porous pavers stratigraphies has been rebuilt, has been subjected to a semi-synthetic hyetograph, made of five different rain intensities (wetting regime) plus several drying periods. From the frequency curve typical of Brisbane (AU), in correspondence of different percentile ranges four flow rates has been chosen (A, B, C, D). In addition, a 1 in 5 year storm of 5 min duration was selected; this represents the typical design storm where the porous pavers are likely to be developed. The accelerated laboratory test allowed to simulate 26 years of operation under Melbourne climate. About the water quality monitoring, an intense sampling regime has been conducted in which samples were collected from inflow and outflow and analysed for Total Suspended Solids (TSS), Total Phosphorus (TP) and Total Nitrogen (TN). Afterwards, a correlation analysis has been performed in order to individuate the key variables affecting the porous pavement functioning. According to these results, the key variables identified to affect the pollutant concentration values were: the cumulative flow every 6, 12 and 24 hours before the sampling time, the cumulative inflow volume in each time step and the cumulative trapped mass. Initially, it has been tried to analyse the phenomenon through the ‘k-C* model’, that is a conceptual model used to simulate the pollutant behaviour through the system, based on a first-order kinetic decay equation. Notwithstanding the wide popularity and tested applicability on various other treatment practices such as
8 −∞ and 1.0 (1 inclusive), with NSE = 1 being the optimal value. Values between 0.0 and 1.0 are generally viewed as acceptable levels of performance, whereas values < 0.0 indicates that the mean observed value is a better predictor than the simulated value, which indicates unacceptable performance. Considering this, the concentration data collected has been processed, also taking into account of the correlation analysis previously carried out, which allowed to estimate the concentrations of the main pollutants such as TSS (Total Suspended Solids), TP (Total Phosphorous) and TN (Total Nitrogen) to the output section of the porous pavements. The reliability of the new proposed formulas has been demonstrated both by high values of the Nash-Sutcliffe coefficients, always positive, and also by very low errors (between 10% and 25%) among modelled and measured concentrations.
9
Sommario
I cambiamenti climatici sempre più frequenti hanno accresciuto nei ricercatori l’interesse nelle cause ma, soprattutto, sulle opere strutturali e non, da offrire al problema. Lo sviluppo economico e la rapida crescita della popolazione produce una domanda sempre maggiore di beni e servizi. L’estensione dei fenomeni siccitosi e, dall’altro lato, un aumento dell’intensità e della frequenza delle piogge, anche di breve durata causano eventi che per il loro alto potere devastante, vengono indicati col termine ‘eventi di pioggia estremi’. L’attuale gestione delle acque in ambiente urbano risulta dunque insostenibile, quindi diviene estremamente importante sviluppare dei nuovi ecosistemi urbani che richiedono, però, il completo ripensamento delle tecniche di sviluppo convenzionale. I sistemi di drenaggio urbano tradizionali sono pensati per favorire il rapido allontanamento delle acque di scorrimento superficiale e fognarie verso gli impianti di trattamento e i corpi idrici recettori, senza assolutamente tener conto delle loro caratteristiche qualitative. Per raggiungere l’obiettivo del controllo quali-quantitativo delle acque superficiali in ambiente urbano una possibile strada è rappresentata dalla vasta applicazione in queste aree dei cosiddetti “Blue-Green Corridors” (BGC) che forniscono un approccio olistico e integrato alla soluzione del problema. Tali sistemi sono ancora più avanzati delle classiche misure di drenaggio urbano sostenibile come LID (Low Impact Development), SUDS (Sustainable Urban Drainage Systems) o BMPs (Best Management Practices), di cui consentono di massimizzare gli effetti benefici. L’uso dei BGC come parte del sistema di drenaggio urbano rappresenta un approccio vincente, che permette la gestione e il trattamento delle acque meteoriche di dilavamento, utilizzando delle componenti blu e verdi. Le componenti verdi sono rappresentate dalla vegetazione di qualsiasi tipo presente (piante floreali, prati, siepi) mentre quelle blu da laghi, ristagni, fiumi e canali (artificiali o naturali). Queste consentono insieme di creare una rete di collegamento tra le varie misure di controllo a livello locale. Il reale comportamento di questi sistemi però, non è ancora correttamente modellato. Molti dei software correntemente utilizzati nell’idrologia urbana (EPA SWMM, eWater CRC Music, ecc…) modellano in maniera abbastanza efficace il comportamento idraulico di tali strutture di infiltrazione utilizzando un semplice bilancio di masse, mentre la generazione, l’accumulo e il trasporto degli inquinanti vengono determinati assegnando delle categorie di uso del
10 inquinanti presenti nelle acque, si verifica in misura maggiore nelle pratiche infiltranti quali celle di bioritenzione, trincee infiltranti, fasce filtro e pavimentazioni permeabili. Proprio queste ultime pratiche sono facilmente inseribili all’interno di contesti urbani esistenti col duplice scopo di diminuire le aree impermeabili e funzionare da ‘rami’ delle reti di BGC. Da questi presupposti si sviluppa la ricerca affrontata nella seguente tesi, il cui principale obiettivo è rappresentato dallo studio dell’implementazione degli elementi ‘blu e verdi’ nelle aree urbane e dell’effetto che questi hanno sulla riduzione dei carichi inquinanti. All’inizio è stato affrontato lo studio degli errori più comunemente riscontrabili all’interno dei DTM (Digital Terrain Models) che finiscono, se non corretti, per influenzare la delineazione della rete di scorrimento superficiale e la conseguente modellazione idraulica. I DEM possono includere sia i dati di elevazione, che regolano la direzione del deflusso, che le informazioni sulla copertura del suolo. Molto spesso i DTM sono generati da informazioni sul terreno provenienti da diverse tecniche di rilievo (remote sensing, LiDAR, rilievi aerofotogrammetrici e immagini satellitari) e contengono perciò degli errori (sistematici, random) che necessitano di essere individuati ed eliminati. Si è effettuato uno studio relativamente all’influenza della risoluzione del DEM sulla generazione della rete di scorrimento superficiale per il bacino del Canale Liguori, situato nella città di Cosenza. La ricerca è servita anche a valutare come la presenza degli edifici possa influenzare la delineazione dei ponds, ovvero delle potenziali aree allagabili. A tal fine sono stati considerati per l’area studio tre DTM generati da diversi dati sorgente: due basati su carta a curve di livello con equidistanza di 30m e 20m ed uno basato su dati LiDAR con risoluzione orizzontale di 1m. Inoltre, per un’analisi più approfondita, è stato effettuato il downsampling del DTM LiDAR con edifici, passando da una risoluzione di 1m ad una di 5m, al fine di valutare l’influenza della dimensione della cella del raster sulla delineazione delle depressioni (ponds). La determinazione dei ponds è stata effettuata con software Arc Hydro Tool
11 sviluppato presso il Centre for Research in Water Resources all’Università di Austin, Texas. Dallo studio è emerso come la correzione di DEM generati da dati LiDAR e da altre fonti sovrapponendo la presenza degli edifici, ottenuti ad esempio da mappa catastale, può portare alla riduzione dei volumi accumulati nelle depressioni superficiali (ponds), siano esse reali oppure fittizie e che il numero di queste ultime dipende non tanto dalla dimensione delle celle del raster utilizzato, quanto dall’accuratezza del dato originale. In seguito, è stato effettuato un primo tentativo di implementazione di pratiche sostenibili sempre all’interno del bacino del Canale Liguori nella città di Cosenza. La rete di drenaggio superficiale di una sottoarea del bacino densamente urbanizzata è stata potenziata ipotizzando l’inserimento di una certa percentuale di tetti verdi e di pavimentazioni permeabili. Sono state effettuate quindi delle simulazioni, utilizzando in input la serie storica delle precipitazioni annuali (per gli anni 2008 - 2011) e considerando i due scenari dello stato attuale (senza alcun intervento) e con l’implementazione delle nuove superfici permeabili. In seguito la stessa simulazione è stata effettuata in continuo, considerando cioè un’unica serie storica di 4 anni di precipitazioni (dal 2008 al 2011) e considerando oltre ai due casi precedenti, anche lo scenario in cui le LID fossero soggette a fenomeno di clogging. Per la modellazione con software EPA SWMM è stato inizialmente necessario definire una copertura del suolo ‘residenziale’, caratterizzata dalle leggi di build up e wash off degli inquinanti da modellare (in questo caso TSS). Per quanto riguarda i parametri da assegnare alle due LID (tetti verdi e pavimentazioni permeabili), al momento sono stati scelti dei valori di letteratura, mentre in futuro si prevede di utilizzare dei parametri progettuali provenienti da installazioni sperimentali all’interno dell’Unical. All’interno dello SWMM, per tener conto del fenomeno di clogging, si utilizza un parametro noto col termine di ‘clogging factor’, che tiene conto della possibilità di decadimento delle prestazioni di una LID, dovute all’intasamento dello strato di accumulo inferiore per opera del materiale fine trasportato dalle acque di infiltrazione. La formulazione, di natura empirica, è influenzata da alcuni parametri quali il numero di anni necessario per il completo intasamento (Yclog), la pioggia media annua sul bacino (Pa), il ‘capture ratio’ (CR) ovvero il rapporto tra l’area che contribuisce al runoff e l’area totale della pavimentazione, dall’indice dei vuoti (VR), dalla frazione di pavimentazione impermeabile (ISF) e dallo spessore della pavimentazione (T). Dall’analisi effettuata considerando le serie storiche di precipitazioni annuali risulta una riduzione dei volumi
12 fognatura: i minori volumi d’acqua presenti, al mantenersi costante della massa totale di inquinante sul bacino, fanno si che le concentrazioni in uscita risultino in media più elevate. I risultati della simulazione pluriennale mostrano altresì dei risultati molto interessanti. Mentre infatti nelle simulazioni annuali l’andamento dei volumi nella sezione di chiusura nel caso di scenario con presenza di clogging risulta sempre compreso tra i casi senza LID e con LID, quando si considera la simulazione pluriennale, si nota come a partire dal 2° anno simulato, i volumi nel caso di clogging tendono ad essere addirittura superiori del caso senza LID, evidenziando un intasamento in atto delle BMPs. L’efficienza tende infatti a diminuire nel tempo, da un massimo del 50% ad inizio simulazione fino ad azzerarsi quasi completamente alla fine del 2° anno, per poi continuare ad oscillare con degli scarti minimi intorno allo 0% per la restante parte della simulazione. In questo caso, infatti, per i primi due anni l’andamento qualitativo è analogo a quello che si è riscontrato per le simulazioni annuali, mentre a partire dal terzo anno (gennaio 2010), i volumi generati dal caso “LID con clogging” risultano uguali se non in alcuni casi superiori ai volumi che si generano quando tali pratiche non sono applicate, indice ciò del completo intasamento dei pori della pavimentazione e conseguente mancato fenomeno di infiltrazione che non ha più la possibilità di avvenire. I risultati forniti dallo SWMM, seppur interessanti e indicativi del funzionamento delle LID, non risultano molto precisi specie riguardo la simulazione qualitativa delle pratiche di gestione. Per tale motivo la ricerca è stata nel prosieguo orientata al miglioramento degli algoritmi di simulazione qualitativa, con particolare riguardo alle pavimentazioni drenanti. Sono stati analizzati i dati raccolti da un’installazione sperimentale di laboratorio delle tre più diffuse tipologie di pavimentazione permeabile: asfalto poroso, mattoncini porosi e calcestruzzo poroso. L’impianto, costituito da tre compartimenti nei quali è stata ricostruita la stratigrafia per le 3 tipologie di pavimentazione, è stato sottoposto ad uno ietogramma di pioggia
semi-13 sintetico, costituito cinque differenti intensità (portate di tempo bagnato) ed un periodo di tempo asciutto. Dalla curva di frequenza tipica di Brisbane (AU) sono state selezionate 4 portate (denominate A,B,C,D), ognuna corrispondente ad un determinato percentile di intensità di pioggia; a queste è stata aggiunta una quinta pioggia di progetto con tempo di ritorno di 5 anni. Ogni anno simulato è stato composto da una sequenza random delle 4 portate A,B,C,D; ogni 4 anni simulati è stata intervallata la pioggia di progetto con tempo di ritorno di 5 anni. In totale, dunque, si è riusciti a simulare 26 anni di funzionamento delle tre pavimentazioni con circa 1 anno di funzionamento in laboratorio. Alcuni campioni per l’analisi qualitativa delle acque sono stati collezionati in ingresso ed in uscita alla pavimentazione al fine di analizzare le concentrazioni di Solidi Sospesi Totali (TSS), Fosforo Totale (TP) e Azoto Totale (TN). In seguito sono state effettuate delle analisi di correlazione tra le diverse variabili in gioco, al fine di comprendere quali di esse influenzassero maggiormente i valori di concentrazione in uscita per ciascun inquinante. Le grandezze maggiormente correlate con la concentrazione in uscita misurata sono state: concentrazione in ingresso, portata, portate cumulate ogni 6, 12 e 24 ore, volumi cumulati e masse cumulate. Inizialmente si è cercato di interpretare il fenomeno utilizzando il ‘modello k-C*’, modello concettuale utilizzato per simulare il comportamento degli inquinanti attraverso il sistema, basato sull’equazione cinetica di decadimento del primo ordine. Nonostante la vasta popolarità e l’applicabilità testata per altre pratiche quali filtri sabbiosi, aree umide, bacini di sedimentazione, biofiltri e trincee infiltranti, il modello non ha mostrato risultati soddisfacenti quando applicato alle pavimentazioni permeabili, specialmente riguardo la modellazione dei metalli pesanti e del fosforo totale. Il potere predittivo del modello è stato misurato facendo riferimento all’Indice di Nash-Sutcliffe (NSE) largamente adottato, specie nel mondo anglosassone, per la valutazione prestazionale dei modelli idrologici. L’NSE indica quanto bene il grafico dei punti osservati verso quelli simulati interpola la bisettrice dell’angolo retto. Tale indice varia tra –∞ ed 1 (incluso), dove NSE=1 rappresenta la condizione ottimale. Valori tra 0 ed 1 sono generalmente visti come accettabili, mentre valori negativi dell’indice esprimono prestazioni non ammissibili. Tenendo conto di ciò, i dati di concentrazione collezionati sono stati elaborati, anche in considerazione dell’analisi di correlazione precedentemente effettuata, riuscendo ad individuare tre nuove formulazioni capaci di predire la concentrazione di inquinante in uscita dalle tre tipologie di pavimentazione
15
Table of Contents
ACKNOWLEDGMENTS ... 3 ABSTRACT... 4 SOMMARIO ... 9 TABLE OF CONTENTS ... 15CHAPTER 1 - BACKGROUND AND THESIS OBJECTIVE ... 17
PROBLEM DESCRIPTION ... 17 1.1 CLIMATE CHANGES ... 20 1.2 URBANIZATION ... 24 1.3 1.3.1 Urban flooding ... 26 SUSTAINABLE SOLUTIONS ... 27 1.4 AIM OF THE RESEARCH ... 29 1.5 THESIS OUTLINE ... 30 1.6 REFERENCES ... 32 1.7 CHAPTER 2: DTM PROCESSING ... 37 2.1 INTRODUCTION ... 37
2.2 LIDAR AND INPUT DATA ... 39
2.3 IMPORTANCE OF INPUT DATA QUALITY ... 43
2.4 DEM ERRORS AND ENHANCEMENT METHODS ... 45
2.5 OVERLAND FLOW NETWORK DELINEATION ... 48
2.5.1 AOFD ... 49
2.5.2 Arc Hydro ... 51
2.6 PONDS DELINEATION IN LIGUORI CHANNEL BASIN ... 53
2.6.1 Influence of DEM’s resolution and buildings on the major system ... 57
2.6.2 Section 1... 61
2.6.3 Section 2... 62
2.6.4 Section 3... 63
2.7 RESULTS ... 64
2.8 REFERENCES ... 67
CHAPTER 3: BLUE-GREEN CORRIDORS ... 73
3.1 INTRODUCTION ... 73
3.2 SUDS,WSUD,BMP,LID PRACTICES ... 75
3.3 NON-STRUCTURAL PRACTICES ... 76
3.3.1 Cluster Development ... 79
3.3.2 Minimize Soil Compaction ... 80
3.3.3 Minimize Total Disturbed Area ... 81
3.3.4 Protect Natural Flow Pathways ... 81
3.3.5 Protect Riparian Buffer Areas ... 82
3.3.6 Protect Sensitive Areas ... 83
3.3.7 Reduce Impervious Surfaces ... 84
3.3.8 Stormwater Disconnection... 84
3.4 STRUCTURAL PRACTICES ... 85
3.4.1 Vegetated swales ... 88
3.4.2 Vegetated filter strips ... 90
3.4.3 Bioretention areas ... 91
3.4.4 Green Roofs... 92
3.4.5 Detention Basins ... 95
3.4.6 Infiltration systems ... 97
16 4.2.3 KCRTS ... 125 4.2.4 MGSFlood ... 126 4.2.5 MUSIC ... 127 4.2.6 PC-SWMM ... 128 4.2.7 P8 ... 129 4.2.8 PURRS ... 130 4.2.9 RECARGA ... 131 4.2.10 SUSTAIN ... 132 4.2.11 SWAT... 133 4.2.12 SWMM ... 134
4.2.13 WATER BALANCE MODEL ... 137
4.2.14 WinDES ... 138 4.2.15 WINSLAMM ... 140 4.2.16 WWHM ... 141 4.2.17 XP-SWMM ... 143 4.3 CONCLUSIONS ... 143 4.4 REFERENCES ... 147
CHAPTER 5: BMPS MODELLING: POROUS PAVEMENTS ... 151
5.1 INTRODUCTION ... 151
5.2 SWMMBMPS MODELLING ... 151
5.2.1 Experimental Site ... 151
5.2.2 Annual Simulations ... 154
5.2.50 Continuous Simulations (4 years) ... 164
5.3 POROUS PAVEMENT MODELLING ... 171
5.3.1 Laboratory experiment and data collection ... 172
5.3.2 Data Analysis ... 175
5.3.3 k-C* Model... 177
5.3.4 New proposed shapes ... 186
5.4 RESULTS AND DISCUSSION ... 188
5.5 REFERENCES ... 199
CHAPTER 6: CONCLUSIONS AND FURTHER RESEARCH ... 203
6.1 CONCLUSIONS ... 203
17
Chapter 1 - Background and Thesis objective
Problem description 1.1
The Earth's climate always keeps changing, but it is the recent acceleration of this change that has caused concern to many scientists, authors and also to common people, leading to increased interest in our environment. In geological period of the Holocene (approximately the last 11000 years) has occurred in a situation of rather stable climate that has also facilitated the wide spread of our species on the planet (Jansen et al., 2007). This situation is currently changing, due to economic development together with population growth and its constantly increasing demand of goods and services like freshwater, food, electricity and much more.
Beyond that, another factor affecting climate changes is raise of global temperatures, causing an upheaval of seasons, and more generally, of climatic worldwide conditions. In this regard, it is worth considering a couple of important distinctions. The terms ‘weather’ and ‘climate’ are frequently considered to be interchangeable, but weather and climate refer to different things. Weather is the brief, rapidly changing condition of the atmosphere at a given place and time, influenced by the movement of air masses. Climate, on the other hand, should more accurately be the term applied to the average weather conditions over longer periods of years to decades. Thus, climate change refers to any long-term trends in climate over many years or decades, around which climate variability may be evident year on year. Hence, a single warmer or cooler year on its own is not sufficient evidence to assert that climate is changing (Cleugh H. et al., 2011). According to a study conducted by Giannakopoulos et al. (2009) in the Mediterranean region, between 2030 and 2060, may occur an increase in average annual temperatures from one to three degrees centigrade, with a significant impact on the timing of growth and maturation of crops. As for precipitation, experts of IPCC provide in Mediterranean countries radical changes with reductions from 4 to 27%. Finally, all the studies conducted up to now, despite uncertainties about climate variability, agree on an increase in extreme events: drought in the countries to the west of the Mediterranean region and throughout southern Europe.
As the same as drought, also precipitation became more intense and frequent, even with more ever short duration. These events that for its heavy impact are called ‘extreme rainfall events’ (Fig. 1. 1) are frequently followed by flash floods and sometimes
18 Fig. 1. 1 - Hurricane Gordon seen last 20-Aug-2012 between the Azores and mainland Europe (CNN website - http://edition.cnn.com/2012/08/20/world/europe/hurricane-gordon).
Their danger is due not only to their strong impact on cities, rural areas and, generally, to the entire humankind, but also to the fact they are very uneven and hardly predictable (Jones et al., 2004). Many studies (Berz, 2001; Frich et al., 2002; Milly et al., 2002; Kostopoulou and Jones, 2005; Tebaldi et al., 2006; Casas et al., 2007) in fact, testify how these events are extremely dangerous and how they can have extreme consequences especially in urban areas where, very often, existing drainage systems are unable to handle high peak flows due to these ones, causing occurrence of surface water flooding.
The actual management of urban waters is unsustainable for the world of tomorrow thus, foregoing reasons lead to an imperative need to reduce vulnerability to meteorological extremes, as essential part of the complex adaptation to climate change. Development, climate change and ecosystem sustainability issues are increasingly interlinked, requiring a rethinking of traditional development assistance in order to remain relevant to human needs (Min et al., 2011).
A possible way to reach these objectives is the widespread implementation in urban areas of ‘blue-green infrastructure’ that provide an holistic and integrated approach to the problem. They are one step beyond other ‘classic’ sustainable urban drainage
19 measures such as LID (Low Impact Development), SUDS (Sustainable Urban Drainage Systems) or BMPs (Best Management Practices), allowing to emphasize their beneficial effects. The foregoing measures in fact, if stand-alone applied, are only partially effective (Benedict & McMahon, 2002). The Blue-Green Corridors (BGCs) concept, further discuss in Chapter 3, integrate the role of SUDS with urban planning, fluvial redevelopment and flooding management. It allows to develop spatial planning strategies to increase value of urban environments, including therein blue-green components. These elements allow impervious areas, largely present in our cities, to be converted to more permeable areas reducing stormwater runoff. The excessive runoff generated during a storm event, in fact, is responsible of urban floods because existing drainage systems are unable to handle peak flows and, moreover, they deliver contaminants to receiving waters (lakes, rivers and creeks). This aim is reached, for instance, through the utilization of porous pavements. Porous pavers are a type of SUDS made of a structure that is permeable to water, consisting on a pervious layer sits on the top of a reservoir storage layer. These systems reduce both flood peak and contaminants concentration, improving the quality of stormwater at source before it reach receiving waters. The real behaviour of these structures yet is not properly modelled. Most of the software currently used in urban hydrology (SWMM by EPA, Music by eWater CRC, etc…) model in a reasonable way the hydraulic behaviour of infiltration practices (such as bioretention cells, infiltration trenches, vegetated filter strips, porous pavement) using a simple mass balance approach. Generation, inflow and transport of pollutants are, instead, determined by the land use assigned to each subcatchments, namely through buildup and washoff laws describing accumulation and washout by either a mass per unit of subcatchment area or per unit of curb length. The presence of BMPs in the basin, increases the infiltration rate, decreasing runoff, thus the mass of pollutants. This approach completely lack of quality algorithms within LID models that allow to take into account of their quality performances as, for instance, reduction of efficiency due to the clogging effect. The clogging phenomena is described as the decrease in infiltration rate of the soil due to the reduction in soil porosity and hydraulic conductivity. Many studies shown that clogging of the porous pavements happens between 15 and 20 years after construction (Yong, 2011; Yong and Deletić, 2012). How this process works is not still clear thus, further studies are required to predict porous paver efficiency over time.
20 Climate Change (IPCC) and the National Research Council (NRC) have independently concluded that “changes observed over the last several decades are likely mostly due to human activities”, but that “a causal linkage between the buildup of greenhouse gases in the atmosphere and the observed climate changes during the 20th century cannot be unequivocally established” (NRC, 2001). The fourth report of the Intergovernmental Panel on Climate Change (IPCC) in his 2007 detection studies estimated that the average temperature of the Earth's surface has increased by 0.74 ± 0.18 ° C during the twentieth century (IPPC, 2007). This slow but constant increment of temperature has lots of negative effect, such as ozone depletion (Fig. 1. 2).
Fig. 1. 2 - Ozone concentrations over the mid-latitudes of the Western Hemisphere, based on months of calculations by the Goddard Earth Observing System Chemistry-Climate Model (NASA Earth Observatory, 2009 - http://earthobservatory.nasa.gov/IOTD/view.php?id=38685).
Ozone depletion describes two distinct but related phenomena observed since the late 1970s: a steady decline of about 4% per decade in the total volume of ozone in Earth's stratosphere (the ozone layer), and a much larger springtime decrease in stratospheric
21 ozone over Earth's polar regions. The latter phenomenon is referred to as the ozone hole. In addition to these well-known stratospheric phenomena, there are also springtime polar tropospheric ozone depletion events (Wikipedia, 2012). As it can intuitively understood, hydrologic cycle play also an important role within global warming mechanism together with greenhouse gases emission. A traditional water cycle starts with precipitation flows along naturally flow paths to eventually reach the sea (or other receiving bodies) and then it returns to the atmosphere (or infiltrate into the soil) (Fig. 1. 3).
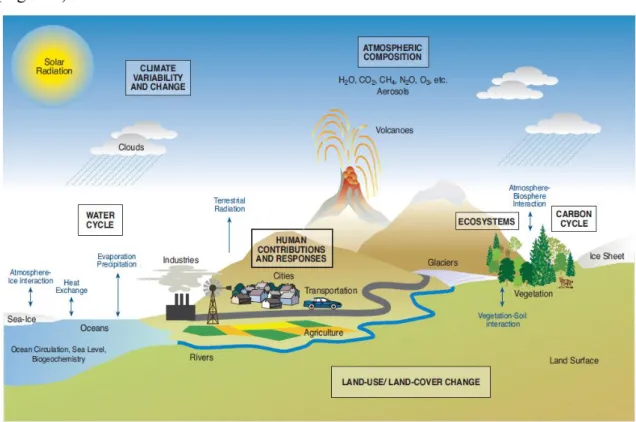
Fig. 1. 3 - Major components needed to understand the climate system and climate change (Adapted from IPCC, 2001).
Due to the recent changes in worldwide climate, traditional hydrologic cycle has been altered, because of the urbanization (that reduces availability of green spaces and lead to the overland flow network modification) and, more generally, of human activities. Alteration of the water cycle has an impact on: warming of the atmosphere, soil drying up, the process of desertification, loss of biodiversity, flora and fauna of the land, impact on the economies based on fishing fresh water, changes in the balance of marine flora and fauna. At the same time changes on the balance of ecosystem due to human intervention or natural changes due to the evolution of spontaneous ecosystem processes have an impact on the water cycle (Fig. 1. 4).
22 Fig. 1. 4 - Schematic of chemical and transport processes related to atmospheric composition. These processes link the atmosphere with other components of the Earth system, including the oceans, land, and terrestrial and marine plants and animals (Strategic Plan for the U.S. Climate Change Science Program, 2003).
The composition and geographical distribution of many ecosystems (forests, grasslands, deserts, mountain systems, lakes, wetlands, oceans, etc..) will tend to transform depending on how individual species respond to climate changes. Global warming will trigger desertification processes in temperate areas of the planet, threatening organisms that, even today, live nearly limit of heat tolerance. During transitional and adaptation stage, likely a lot of biological diversity that currently exists will be lost. The forest systems may undergo changes in species composition, with the disappearance of entire forest types and the establishment of new plant species associations, and hence new ecosystems. Due to change in sea level, marine-coastal ecosystems (salt marshes, mangroves, coastal wetlands, sandy beaches, cliffs reefs, atolls, and river deltas) will be seriously damaged. Certainly the most prevalent factor of natural habitat alteration it has
23 been (and still it is) human worldwide spread. The need for human beings to live together and take advantage of basic services (water, food, etc...) has led them, from the beginning, to create cities and venues. Growth of population and expansion of cities are two effects strictly related one each other. The presence of more amenities and services all gathered together, has allowed an improvement in hygienic and sanitary conditions, and consequently, an increase of the population. But more population implies more places to live, thus more houses and buildings to realize, then city growth. Problems began when this development became fast and uncontrolled, taking no longer in account the environment that was destroyed to make space for new artefacts, therefore, the impact over nature and surrounding ecosystems. The dominance of economic issues in the development of urban form has led people forget that nature, a day, could take her revenge, as it is happening now. Although contemporary cities are on apex of their economic, social and industrial progress, they are more exposed and vulnerable to many risks than in the past such as extreme events, air and water pollution, urban flooding, heat island effect (Imhoff et al., 2010; Peng et al., 2012), drought, high energy consumption and carbon footprint.
24 Urbanization
1.3
It is now clear that one of driving forces causing changes in the environment at local, regional, and even global scales is the human activity. Social, economic, and cultural systems are changing in a world that is more populated, urban, and interconnected than ever. Available statistics show that more than half (51%) of the world’s 7 billion people live in urban areas, value rising to 68% in Italy (Population Reference Bureau, 2012). Main effect of the urbanisation process is certainly the increasing use of virgin lands destined for urban use, making them ever more impervious (Paoletti, 1997; Cannata, 1993). The growth and spread of impervious surfaces within urbanizing watersheds pose significant threats to the quality of natural and built environments. These threats include increased stormwater runoff, reduced water quality, higher maximum summer temperatures, degraded and destroyed aquatic and terrestrial habitats, and the diminished aesthetic appeal of streams and landscapes (Barnes et al., 2002). Impervious surfaces like roads, parking lots, rooftops and sidewalks are made of asphalt, concrete or stones, and their presence change water cycle in urban areas (Fig. 1. 6). When landscapes are natural, the falling rain can easily infiltrate to the soil or be absorbed by vegetation. The latter also slow down the surface runoff, increasing watershed time of concentration. Moreover water infiltrated into soil is naturally filtered of impurities before it supplies groundwater or it reaches lakes, streams, rivers and sea. Conversely when a site is developed, it becomes less permeable and therefore less water can infiltrate back into the ground. As a consequence, rainfall is converted quickly into storm water runoff that can lead to increasing flooding events in our cities. Other negative effects of imperviousness are:
weather alteration at local scale; parking lots and other hard surfaces (such as
-buildings), which often dominate urban areas, tend to absorb solar energy more easily and then release it more slowly, causing the well-known “heat island effect”.
25 Fig. 1. 6 - Water Balance pre and post-development (Centre for Watershed Protection, 2003).
transport of pollutant emphasis; impervious surfaces accumulate pollutants
-(fertilizers, automotive fluids, animal waste, deicers, and dirt) that are carried into surface waters by stormwater runoff. The initial half-inch of stormwater tends to carry the most pollution as it washes into the street and down the gutter. These pollutants degrade habitat for aquatic species and can also affect drinking water quality and limit recreational opportunities.
river habitat degradation; high stormwater flows cause erosion. Small stream
-channels in particular cannot accommodate the unnaturally high flows of water that occur as impervious surface increases. As a result of flash flows, the stream bank and stream bed erode more frequently, degrading the habitat quality for aquatic organisms.
Definitively, hydrological worst effects from urbanization are increased surface runoff volumes and velocities during storms events, involving emphasis of peak flow rate in catchment hydrograph when comparing situations before and after development has occurred (Fig. 1. 7).
Fig. 1. 7 - Hydrologic alteration due to site development (Giacomoni et al., 2011)
26 failure, ice jam)” (NWS Manual, 2012). Usually the spatial effect is localized and, within urban areas, can be a major cause of erosion and damages for human artefact and loss of human lives (Fig. 1. 8). While natural areas are not much affected by this phenomenon thanks to the vegetation that ensure more resilience of the overall landscape, conversely, arid, semi-arid, cultivated (where a high portion of the land is fallow), urban or steep drainage basins are much more prone to modification by flash floods because of their potential to generate the highest maximum probable rainfalls.
Fig. 1. 8 – Inundation of Cedar Creek urban area, Iowa, 2008 (Wikipedia, 2013).
Several different types of floods can occur, depending on the cause that generated them. It is possible to distinguish between:
Coastal flooding, when the coast is flooded by the sea. This is due to a severe storm that, together with storm wind action, allow water waves to move inland on an undefended coast or overtop or breach the coastal defences.
27 Fluvial flooding, maybe the most common flooding event that people associate with the term “flood”. Due to the increase in volume of water within a river channel and the overflow of water from the channel onto the adjacent floodplain.
Pluvial flooding, occurs when the precipitation intensity exceeds the infiltration rate of the ground and soil, when the soil is saturated and cannot absorb any more water, or when extensive impermeable surfaces are present (Lancaster et al., 2004).
Sewer flooding, occurs when surface water drains or combined sewers become overwhelmed with heavy rainfall, have inadequate capacity or are blocked (DCLG, 2010).
Each of them can happen in a urban environment but particularly latter two types are very dangerous in a city, because can lead to overwhelm of sewage system resulting in an excess of flow visible on the surface. Frequent flooding causes problems for residents and also the local authorities which has to clean up the sand deposited on the road, and also had to install the drainage pipe to move water off the roadway.
In addition to augmented flood risk, the water quality of the receiving water course is often reduced due to pollutants and sediments running off impermeable urban surfaces (Roy et al., 2008). The rapid runoff of stormwater is likely to cause pollutants and sediments to be washed off the surface or scoured by the river. In an artificial environment, there are likely to be more pollutants on the catchment surface and in the air than there would be in a natural environment. Also, drainage systems in which there is mixing of wastewater and stormwater may allow pollutants from the wastewater to enter the river (Butler & Davies, 2011).
It is evident, therefore, that current water management practices are not robust enough to cope with the increasing rainfall variability associated with climate change, thus the necessity to develop integrated approaches to surface water flood management (Bates et al., 2008).
Sustainable Solutions 1.4
In order to reduce impact that impervious surfaces have on urban catchments traditional solutions have been adopted until now (Carter & Jackson, 2007), such as storage tanks or ponds, where water can be temporarily stored during flooding event (White R., 2002). These solutions, extremely good on peak flow reduction, require lot of space to store temporary captured volume, not readily available on cities and developed
28 Design. Porous pavements are very popular structures for the management of both urban runoff quality and quantity. As their name implies, they promote the infiltration of rainfall and urban runoff, either to the underlying soil, or to a storage reservoir. Compared to other stormwater management measures, porous pavements are easily retrofitted in existing dense urban environments and are capable of reducing the hydraulic connectivity of the drainage system. They also trap pollutants and therefore can meet common stormwater management objectives (Yong et al., 2013). Despite of the many positive effects, use of permeable paving is often hampered by its high likelihood of failure due to clogging. Clogging is defined as the processes of reducing porosity and permeability (and hence decreasing the infiltration rate of the system) due to physical, biological and chemical processes (Bouwer, 2002). In stormwater systems, clogging occurs primarily due to the deposition of sediments. Several studies has been conducted in the past to evaluate clogging phenomena in porous pavement laboratory installation or when they are new (Fwa et al., 1999; Abbott & Comino, 2003; Kuang et al., 2007; Haselback, 2010), but only recently these studies has been extended trying to evaluate long-term performance of latters (Welker et al., 2012; Sansalone et al., 2012; Kuang & Fu, 2013; Yong et al., 2013). The key mechanisms that govern clogging in different systems are also poorly understood. A better understanding of this process would have several beneficial effects: cost reductions due to better design (choosing an optimal soil and configuration, requiring an appropriate capacity due to infiltrated volumes); policy changes to allow for “dynamic” routing of stormwater, evapotranspiration, and groundwater recharge; and increased understanding of stormwater control measure longevity.
Summarizing, literature review show as to cope with significantly increase of urbanization (thus increasing of stormwater runoff, peak flow rates, flooding and water pollution), a new way to manage stormwater in urban areas it is being implemented.
29 Use of WSUD, LID or BMP to adequately address the cause of urban stormwater problems seems promising, but some questions still remain unanswered especially about meet of stormwater requirements, implementation costs and long-term performances. Overcoming of this doubts will encourage a widespread implementation of this practices, actually hindered by technical, social and legislative impediments, even though the benefits lead to a more sustainable environment. Major barriers on their implementation are, in fact, defragmented local jurisdictions, extensive maintenance and uncertainty in selection, modelling and performance (Ellis et al., 2010; DCLG, 2010).
Aim of the Research 1.5
The major objective of this study can be summarised as follows:
Qualitative and quantitative assessment of SUDS implementation in urban areas (within ‘Blue Green Corridors’ concept), through the overland flow network enhancement and the reduction of the relative water pollution.
By going into detail, the main aim of the research is to study how the implementation of blue-green elements (such as green roofs, porous pavements or swales) in urban areas can be a cost-effective solution to improve water management, in terms of flooding reduction as well as water pollutant decrement. At the beginning, the most common “errors” in Digital Elevation Models (DEM) (such as “pit cells” and “ponds” ─ see Ch. 2) were analysed as well as influence of resolution and human artefacts (such as curbs and buildings) on major system delineation. After that, a first attempt to implement Best Management Practices (BMPs) in urban area were conducted, doing a simulation by assuming presence of a certain percentage of green roofs and porous pavement in a subarea of Liguori’s Catchment. This simulation, previously performed in EPA SWMM for 1-year rainfall, was repeated using 4-year rainfall in continuous. Behavioural differences were found (see Ch. 5), especially about sensibility to clogging efficiency. Because of the poor modelling of porous pavements in SWMM, particularly in regard of water quality, three new porous pavement formulations have been proposed, using the experimental data coming from the laboratory test of three different porous pavements installed at the Monash University. These data allowed to focus on
30 Finally, the new proposed formulations have been validated with the Monash laboratory data, through the calculation of the Nash-Sutcliffe Efficiency coefficients as goodness of fit. Moreover, to further verify the reliability of the three proposed shapes, an error analysis was also carried out, performing the comparison of the percentage relative errors on the measured concentrations.
Therefore, this thesis provides a comprehensive methodology for assessing the long-term performance of porous pavement facilities which contributes to better engineering decision-making.
Thesis outline 1.6
Research begins with study of one of the main data sources currently utilised as a basis for many hydraulic analysis: terrain data coming from a Digital Elevation Model (DEM). In fact, to individuate the most likely position to site a best management practice in a basin, it is necessary to retrieve before some morphological properties of the catchment itself such as slope, aspect, depressions and overland flow network. Anyway, since this kind of data often bring with it some “errors”, a pre-processing it is strongly suggested before to use it. Therefore, main “errors” and processing methods currently available to enhance Digital Terrain Model (DTM) are presented, together with the two of major software usable to retrieve depressions, ponds and overland flow network from a DEM. Also an application has been performed to the Liguori’s catchment (Chapter 2).
In Chapter 3 is introduced and explained the “Blue-Green Corridor” concept and its origin from previous green technologies applications. Moreover, the major best management practices currently used are descripted, as well as barrier to its widespread implementation such as “clogging phenomenon” for infiltration practices like porous pavement and the existing clogging models. Chapter 4 contains a review on modelling
31 software available in urban drainage like EPA SWMM. Current modelling capabilities of this and others software about BMP simulation are also provided together with its limitations. For instance, although some LID practices can also provide significant pollutant reduction benefits, at this time SWMM only models their hydrologic performance (EPA SWMM 5 Manual, 2012).
In Chapter 5 a case study on Liguori’s catchment is explained and a brief description of the data used is also presented. Both annual and long-time continuous simulations (4-years) were performed to assess decay of efficiency of porous pavers in Mediterranean area. The same chapter also shows the development of the new porous pavement formulations, able to take into account about clogging formation in three different kind of porous pavements: Porous Asphalt (PA), Permapave (PP), and modular Hydrapave (HP). Finally, a summary of the conclusions is presented in Chapter 6. Future directions of research are also presented in this chapter.
32 Barnes Kent B., John M. Morgan III, and Martin C. Roberge, 2002. Impervious
-surfaces and the quality of natural and built environments, Department of Geography and Environmental Planning.
Bates B.C., Kundzewicz Z. W., Wu S. & Palutikof J. P., 2008. Climate Change and
-Water. Technical Paper of the Intergovernmental Panel on Climate Change. Geneva, IPCC Secretariat.
Berz G., 2001. Climatic change: effects on and possible responses by the insurance
-industiy. In: Climate of the 21st Century: Changes and Risks (ed. by J. L. Lozén, H. GraBl & P. Hupfer), 392-399. Wissenschaftliche Auswertungen, Hamburg, Germany.
Bouwer H., 2002. Artificial recharge of groundwater: hydrogeology and
-engineering, Hydrogeology 10 (1), 121–142.
Bowles, G., 2002. Impervious Surface – an Environmental Indicator, The Land Use
-Tracker, 2 (1).
Butler D. & Davies J. W., 2011. Urban Drainage – Third Edition, Spon Press,
-London.
Cannata, P.G., 1993. Governo dei bacini idrografici, ETAS Libri, Milano.
Carter T., & Jackson J. R., 2007. Vegetated roofs for stormwater management at
-multiple spatial scales, Landscape and Urban Planning, 80(1-2), 84–94.
Casas C., Herrero M., Ninyerola M., Pons H., Rodriguez R., Rius A., Redano A.,
-2007. Analysis and objective mapping of extreme daily rainfall in Catalonia, Inter. Journal of Climatol., 27, (3), 399-407.
Center for Watershed Protection, 2003. Impacts of Impervious Cover on Aquatic
-Systems, Copyright (c) 2003 by the Center for Watershed Protection.
Cleugh H., Smith M.S., Battaglia M. and Graham P., 2011. Climate change: science
33 Department of Communities and Local Government (DCLG), 2010. Planning
-Policy Statement 25: Development and Flood Risk, London, Department of
Communities and Local Government. Available from:
https://www.gov.uk/government/uploads/system/uploads/attachment_data/file/7772 /pps25guideupdate.pdf
Ellis J.B., Colin H. and Revitt D.M., 2010. Identifying success factors in urban
-surface BMP implementation: mission impossible?, In: NovaTech 2010, 7th International Conference on Sustainable Techniques and Strategies in Urban Water Management, 27 June-1 July 2010, Lyon, France. (Unpublished)
Environmental Protection Agency, 2008. Reducing Urban Heat Islands:
-Compendium of Strategies, USEPA, October 2008.
Environmental Protection Agency (EPA), 2012. Storm Water Management Model
-(SWMM) user’s manual, version 5.0, Report EPA/600/R-05/040, United States Environmental Protection Agency.
Frich P., Alexander L.V., Della-Marta P., Gleason B., Haylock M., Klein-Tank
-A.M.G., Peterson T., (2002). Observed coherent changes in climatic extremes during the second half of the twentieth century, Clim Res, 19, 193–212.
Fwa T.F., Tan S.A. & Guwe Y.K., 1999. Laboratory evaluation of clogging
-potential of porous asphalt mixtures, Transportation Research Record, no. 1681, pp. 43-49.
Giacomoni M.H., Zechman E.M. & Brumbelow K., 2011. Hydrologic Footprint
-Residence: Environmentally Friendly Criteria for Best Management Practices, Journal of Hydrologic Engineering, vol. 17, no. 1, pp. 99-108.
Giannakopoulos C., Le Sager P., Bindi M., Moriondo M., Kostopoulou E., Goodess
-C.M., 2009, Climatic changes and associated impacts in the Mediterranean resulting from a 2 °C global warming, Global and Planetary Change, Volume 68, Issue 3, August 2009, Pages 209–224.
Haselbach L.M., 2010. Potential for clay clogging of pervious concrete under
-extreme conditions, Journal of Hydrologic Engineering, vol. 15, no. 1, pp. 67-69. Kuang X., Sansalone J., Gnecco I., Berretta C. & Lanza L.G., 2007. Cementitious
-permeable pavement as an LID practice for hydrologic and particle in-situ control, Restoring Our Natural Habitat - Proceedings of the 2007 World Environmental and Water Resources Congress.
34 Science Basis. Contribution of Working Group I to the Fourth Assessment Report of the Intergovernmental Panel on Climate Change [Solomon, S., D. Qin, M. Manning, Z. Chen, M. Marquis, K.B. Averyt, M.Tignor and H.L. Miller (eds.)]. Cambridge University Press, Cambridge, United Kingdom and New York, NY, USA.
Jansen E.J. et al., 2007, Paleoclimate, in Climate Change 2007: the Physical
-Science Basis, vol. I, Cambridge University Press.
Jones C., Waliser D.E., Lau K.M. and Stern W., 2004. Global Occurrences of
-Extreme Precipitation and Madden-Julian Oscillation: Observation and Predictability. Journal of Climate. 17. Pages: 4575 – 4589.
Kostopoulou E. and Jones P., 2005. Assessment of climate extremes in Eastern
-Mediterranean, Meteorol Atmos Phys, 89, 69–85.
Milly P. C. D., Wetherald R. T., Dunne K. A. & Delworth T. L., 2002. Increasing
-risk of great floods in a changing climate. Nature 415, 514-517.
Min, S.-K., X. Zhang, F. W. Zwiers, and G. C. Hegerl, 2011. Human contribution
-to more intense precipitation extremes. Nature, 470, 378–381.
NRC, 2001: Climate Change Science: An Analysis of Some Key Questions.
-Committee on the Science of Climate Change, National Research Council, National Academy Press,Washington, DC, USA, 42 pp.
NWS National Weather Service, NWS Manual 10-950 December 4, 2012.
-Available from http://www.nws.noaa.gov/directives/sym/pd01009050curr.pdf Paoletti A., 1997. Il controllo quali-quantitativo dei deflussi nei bacini urbanizzati,
-in Brath A., Maione U., (cur.) Atti del Corso di Aggiornamento “Moderne tecniche e criteri per la sistemazione dei corsi d’acqua in territori fortemente antropizzati”, Politecnico di Milano, Ed. Bios.
35 Peng S., Piao S., Ciais P., Friedlingstein P., Ottle C., Bréon F.M., Nan H., Zhou L.
-and Ranga B. Myneni, 2012. Surface Urban Heat Isl-and Across 419 Global Big Cities, Environ. Sci. Technol., 46 (2), pp 696–703.
Population Reference Bureau, 2012 World Population Data Sheet, available at:
- http://www.prb.org/Publications/Datasheets/2012/world-population-data-sheet/data-sheet.aspx.
Roy A. H., Seth J. W., Fletcher T. D., Walsh C. J., Ladson A. R., Shuster W. D. &
-Thurston H. W., 2008. Impediments and solutions to sustainable, watershed-scale urban stromwater management: Lessons from Australia and the United States, Environmental Management, 42, 344-359.
Sansalone J., Kuang X., Ying G. & Ranieri V., 2012. Filtration and clogging of
-permeable pavement loaded by urban drainage, Water research, vol. 46, no. 20, pp. 6763-6774.
Strategic Plan for the U.S. Climate Change Science Program, 2003. A Report by
-the Climate Change Science Program and -the Subcommittee on Global Change Research, 24 July 2003.
Tebaldi C., Hayhoe K., Arblaster J. and Meehl G., 2006. An intercomparison of
-model-simulated historical and future changes in extreme events, Climatic Change, 79, 185–211.
Welker Andrea L., James D. Barbis, and Patrick A. Jeffers, 2012. A Side-by-Side
-comparison of Pervious Concrete and Porous Asphalt, Journal of the American Water Resources Association (JAWRA) 48(4): 809-819.
White I., 2008. The Absorbent City: urban form and flood risk management,
-Proceedings of the Institute of Civil Engineers: Urban Design and Planning 161(2008): 151-161.
White R., 2002. Building the Ecological City, Cambridge: Woodhead Publication.
Wikipedia, 2012. Ozone depletion - http://en.wikipedia.org/wiki/Ozone_depletion
-Wikipedia, 2013. Iowa flood of 2008.
-http://en.wikipedia.org/wiki/Iowa_flood_of_2008
Yong C.F., McCarthy D.T. & Deletic A., 2013. Predicting physical clogging of
37
Chapter 2: DTM Processing
2.1 Introduction
The growing availability of updated and detailed land use data, largely obtained from satellite or airborne surveys, and the increasingly widespread diffusion of software tools able to manage large amounts of data and operate at high computational speed, has stimulated research to investigate the old hydrology and land management problems with new techniques and advanced models. In particular there has been a transition between an average terrain detail of 1km x 1km (available at high costs) towards a cheapest and more detailed terrain information, where cells resolution can be easily of 10m x 10m in size. The numerical 3D representation of the land is defined, in jargon, as Digital Elevation Model – DEM – containing the elevation of the terrain over a specified area, usually at a fixed grid interval over the surface of the earth. The intervals between each of the grid points will always be referenced to some geographical coordinate system. This is usually either latitude-longitude or UTM (Universal Transverse Mercator) coordinate systems. The closer together the grid points are located, the more detailed the information will be in the file.
Whereas word DEM is most of the time used as a generic term, is worthy to highlight the differences between other two most closely used and confused acronyms:
Digital Surface Model (DSM) – a first-reflective-surface model that contains
-elevations of natural terrain features in addition to vegetation and cultural features such as buildings and roads.
Digital Terrain Model (DTM) – a bare-earth model that contains elevations of
-natural terrain features such as barren ridge tops and river valleys. Elevations of vegetation and cultural features, such as buildings and roads, are digitally removed (Intermap solutions, 2012) (Fig. 2. 1).
DTMs are generated from DSMs using DEM filtering algorithms (Sithole and Vosselman, 2004). Each filtering method has its own advantages and drawbacks which depend on how it identifies the points that belong to the bare earth and those that not. Sithole and Vosselman (2004), after an in deep comparison of several methods, concluded that some methods produce better results than others on specific situations, but there is no filtering method better than others overall.
38 Fig. 2. 1 - Surfaces represented by a Digital Surface Model include buildings and other objects. Digital Terrain Models represent the bare ground (http://www.computamaps.com/).
Elevation data needed to produce DEMs can be obtained from various sources (Raber et al., 2002):
• Theodolite or total station • Topographic maps
• GPS
• Interferometry from radar data • Doppler radar
• Stereo photogrammetry from aerial surveys • Optical satellite imagery
• LiDAR (Light Detection and Ranging)
The selection of a specific DEM creation technique will rely on the accuracy required, extent of the area of interest, budget, time frame, etc. (Smith, 2006). Moreover, each technique has its pros and cons so that, more likely, different techniques will produce different DEMs for the same area. DEMs are not only used to represent the ground elevation but, since they are a georeferred numerical matrix, can represent many others land characteristics such as land use, soil geology, lithology, pedology, permeability, or vegetation, geotechnical and agronomical characteristics.
Due to their relative ease of acquisition and relative cheap costs, especially in analysis of wide areas, this new data were immediately used for flood risk estimation and flood risk exposure, particular in urban areas (Sanders et al., 2005; Mason et al., 2007; Obermayer et al., 2010; Nielsen et al., 2011; Álvarez & Malpica, 2012; Santos et al., 2012). DEMs are essential to modelling overland flow; they can be used to generate 1D (One-Dimensional) overland flow networks, or used to describe accurately ground surface on 2D (Two-Dimensional) models (Simões et al., 2010). This terrain representation is heavily used as input for overland flow models such as dual-drainage