1 | A j o u r n e y t h r o u g h t h e c a p i t a l s t r u c t u r e o f t h e b a n k i n g s e c t o r
ALMA MATER STUDIORUM – UNIVERSITÀ DI BOLOGNA
DOTTORATO DI RICERCA IN
MERCATI E INTERMEDIARI FINANZIARI
Ciclo XXV
Settore concorsuale: 13/B4
Settore scientifico-disciplinare: SECS-P/11
A JOURNEY THROUGH THE CAPITAL STRUCTURE OF
THE BANKING SECTOR: EMPIRICAL EVIDENCE FOR
EUROPE FROM 2008 TO 2012.
Tesi presentata da: F
RANCESCOG
IULIANICoordinatore del Dottorato: Chiar.mo prof. Giuseppe Torluccio
Relatore: Chiar.mo prof. Giuseppe Torluccio
2 | A j o u r n e y t h r o u g h t h e c a p i t a l s t r u c t u r e o f t h e b a n k i n g s e c t o r
I N D E X
1. Introduction
1.1. Why a journey though the Capital Structure of the banking
sector? 4
1.2. Analysis of CDS levels 5
1.3. Systemic Risk 6
1.4. Mark to Market vs Accounting Value 7
1.5. Volatility 8
1.6. APPENDIX
1.6.1. Divergence of Accounting versus Market Value 9
2. Chapter 1: A framework for liquidity management and the evolution of senior debt during 2008-2013.
2.1. Motivation 10
2.2. Related Literature 11
2.3. Introduction 12
2.4. Modeling Banks’ Capital Structure 15
2.5. Deposits and Central Bank Financing 17
2.6. No Clearing Price for Debt 19
2.7. Credit Indices. Evolution and Impact on the Profitability of
the Banking Sector 22
2.8. Liabilities Rolling during a Financial Crisis 23
2.9. Event of Default and Maturity Gap 25
2.10. Central Bank Reaction 27
2.11. Meaning of Liquidity 29
2.12. Inference on Liquidity by few Financial Variables 30
2.13. Description of the Data 35
2.14. CDS: Liquidity Shortage or Structural Insolvency? 37
2.15. Conclusions 45
2.16. APPENDIX
2.16.0. Details and results of the regressions 46 2.16.1. Composition of the Itraxx Financial senior 51
2.16.2. Composition of the Itraxx Main 52
2.16.3. A glance to the evolution of monetary aggregates 54
2.16.4. References 56
3. Chapter 2: Risk management and capital structure testing with limited information
3.1. Introduction 58
3.2. Literature on the Topic 60
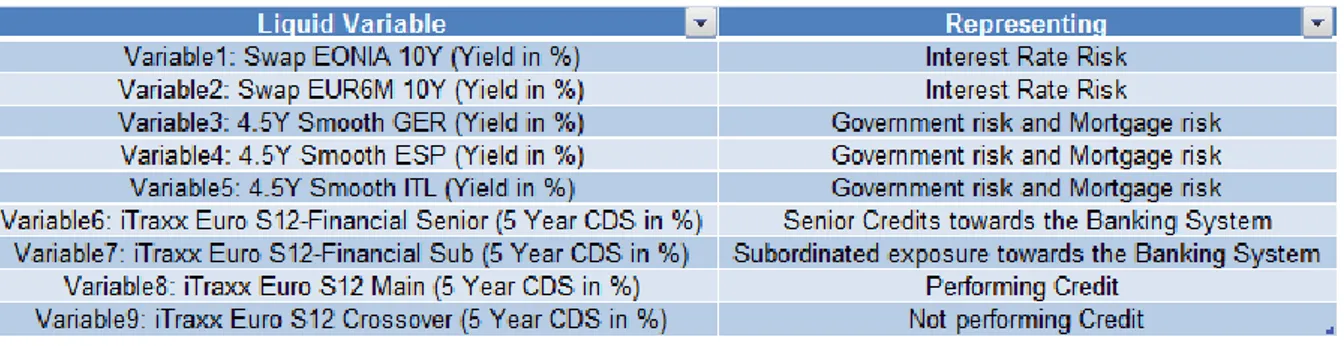
3.3. Market Variables and Idiosyncratic Variables 62
3.4. PCA Risk Management Applied to Market Variables 66 3.5. Interpreting PCR and Implications for Risk Management 68
3 | A j o u r n e y t h r o u g h t h e c a p i t a l s t r u c t u r e o f t h e b a n k i n g s e c t o r 3.6. Capital Management (Regulatory Approach) and Implications
for Risk Management 70
3.7. Assumptions on the Value of Debt 72
3.8. Exploring the Capital Structure via PCA Risk Management 73 3.9. Debt Regression and Equity Regression: Assessment on
Capital Structure without Test of Hypothesis 77
3.10. Limits of the PCR Capital Adequacy Test and Importance of
the PCR Statistics 80
3.11. Why a Market Metric for Capital Structure? 81
3.12. APPENDIX
3.12.0. Practical implications: when regulatory framework
diverges from PCA Risk Management 83
3.12.1. Results of the PCA - Sensitivity of PCA Risk
management to sample history 88
3.12.2. Composition of Itraxx Indices (series 12): Index
Itraxx Europe and Financial Senior 94
4. Chapter 3: PCR statistics and capital adequacy test: a new metric for systemic risk?
4.1. Systemic Risk: Introduction and Motivation 97
4.2. The Propagation of Systemic Risk 98
4.3. Literature on Systemic Risk 102
4.4. Data and computation of PCR Statistics 106
4.5. PCA Risk Management Metric for Systemic Risk 109
4.6. PCR Capital Adequacy Test and PCR Statistics: Inference on
a Bank’s Capital Structure 111
4.7. Merging PCA Risk Management with a regulatory framework 117 4.8. Accounting and Risk Management: Time To Use a Unique
Language? 121
4.9. Subordinated debt: can it help in reducing balance sheet
variance? 122
4.10. Conclusions 126
4.11. APPENDIX
4.11.0. Subordinated Debt and Basel III: the Role of
COCOS 127
4.11.1. Basel 3 Framework on Liquidity: Similarities and
Differences from PCA risk management 129
4.11.2. Results of the Regressions of Equity and CDS on
Principal Components of Risk 134
4 | A j o u r n e y t h r o u g h t h e c a p i t a l s t r u c t u r e o f t h e b a n k i n g s e c t o r
I N T R O D U C T I O N
The period elapsing from 2008 to 2012 has been scrutinized by practitioners and academia for the extraordinary volatility experienced by financial markets, for a perceived fragility of the banking sector, for one of the most active interventions of policy makers and for the recessions experienced by many countries. Many refer to this period as a Financial Crisis and dispute on the many causes that may explain it.
In this work we will analyze the evolution of the liability side of the balance sheet for the banking sector throughout these years. We will try to derive some conclusion on specific components of the capital structure such as senior and subordinated debt; we will also address the question of the adequacy of equity for the single financial institutions in light of the perceived fragility of financial markets.
Current times rely on measures of capital adequacy based on the definition of regulatory capital and regulatory ratios: this work will propose a different metric which is more market oriented and less accounting dependent.
Any journey during these fascinating years could not avoid reserving a major role to the protagonist of the financial crisis: systemic risk. This theme has not only attracted the attention of the most renowned authors in academia but urged the intervention of the most influential policy makers to avoid the collapse of the financial system.
Why a journey though the capital structure of the banking sector?
Banks have been quite challenged by recent years of financial turbulence: they have suffered an amount of losses and experienced a scarcity of liquidity such as to trigger the implementation of monetary policies and bail out programs to re-establish an ordinary evolution of financial markets.
The evolution of the value of assets (via financials) does not testify these moments of financial difficulties, due to their representation via an accounting
5 | A j o u r n e y t h r o u g h t h e c a p i t a l s t r u c t u r e o f t h e b a n k i n g s e c t o r metric that privileges a long term view, thus disregarding a theoretical fair value consistent with times of high risk aversion. This has produced a reading of the capital via accounting measures progressively at odds with the market cap of the financial institutions. The financial sector has experienced therefore a major reduction of the ratio market capitalization/tangible book value; this thesis also proposes how to address the striking difference between the accounting value of the tangible book with respect to the valuation expressed by the market.
Hence this work investigates the behavior of the liability side of the banking sector, given that debt and equity are usually quoted in regulated market; when the value of debt is too illiquid, then the author avails himself of the CDS values, introducing assumptions that will be specified below.
This journey through the capital structure of the banking sector will trigger an in-depth analysis of the questions
Do CDS levels reflect a risk of default specific of the financial institution or they also reflect a scarcity of liquidity which may be experienced by the system? If so, does monetary policy matter for the purpose of the evolution of CDS?
What happens when the market has no appetite for the subscription of senior issuance?
Does volatility of debt matter?
How does the volatility of debt compare with the volatility of equity?
If we abandon a regulatory metric of capital how do we determine if the market estimates that the capital structure of a bank is sound enough for the amount of risk it bears on the assets?
We will list below few themes which will be of central importance in the following chapters.
Analysis of CDS levels
The analysis of the levels of senior debt would be quite difficult given that the financial crisis was characterized by periods with no appetite for fresh senior issuance underwriting and that most of the banks placed their senior debt to their own retail. Therefore financial senior debt has reduced the volumes
6 | A j o u r n e y t h r o u g h t h e c a p i t a l s t r u c t u r e o f t h e b a n k i n g s e c t o r exchanged on the secondary market and is most of the times regarded as an illiquid asset class, especially if issued by a financial institution affected by a multiple downgrade during the financial crisis.
For this reason we analyze the levels of CDS, not only because daily data is available, but also because, being them quoted by major market players, they reflect a risk estimated by institutional players; on the other hand debt is also subscribed by retail, thus resulting in a pricing biased by players with limited information. Hence the analysis of CDS will exclude such bias.
We will implicitly assume that the value of debt will be par when it yields Euribor + CDS: subsequent higher level of the CDS (widening) will represent a drop in value of the debt and viceversa.
The analysis of debt via its cds levels will prove useful when analyzing the volatility and a comparison with the one experienced by equity. This will allow an insight on the perceived soundness of the capital structure (second part of this work).
Systemic Risk
This concept will be widely explored in the second part of this work, dedicated more generally to the theme of capital structure of financial institutions. We will propose a new definition of systemic risk, centered on the idea that a volatile debt makes the refinancing mechanism of the banking sector volatile, thus generating a financial instability of systemic relevance. This intuition will also prove valuable to address the intuition of endogenous risk, as proposed by Danielsson and recalled in the second part of the thesis.
Although better addressed in the second part of this work, systemic risk will also be the implicit topic in the first part of the work, given that CDS levels will be explained via variables that are not firm specific. Although only in the second part of the work we will strive to provide a definition for systemic risk, the empirical consideration that CDS levels of financial issuers may be explained by common variables corroborates the idea that risk is driven mainly by system variables and not only by idiosyncratic ones.
7 | A j o u r n e y t h r o u g h t h e c a p i t a l s t r u c t u r e o f t h e b a n k i n g s e c t o r In the second part of the work we will build on these intuitions and we will not limit the analysis to CDS levels (in their role to summarize the evolution of senior debt), but we will also include equity to assess if it is consistent with the risk/volatility of the assets.
Mark to Market vs Accounting Value
Before the latest financial crisis the world was expericing a regime of lower volatility, especially when dealing with Fixed Income Markets. Defaults were hardly perceived as systemic and International Accounting Standards made a special effort to introduce rules to align the values of the financial assets to a logic of Mark to Market rather than historical cost. Such effort led to the introduction of the so called “Financial Assets”, whereas “Loans and Receivables” would (still) be evaluated at the historical levels.
Needless to say, this effort has introduced a higher degree of transparency for some of the assets of the bank: this was traded off against a higher variability of equity reserves: the latter reduce while the financial assets experience a drop in value.
The extraordinary volatility of the financial assets experienced during recent years has proved hardly sustainable for some banks, reporting an unprecedented volatility of capital reserves. This accounting volatility of the equity component of the balance sheet triggered the reaction of regulators, allowing to suspend the mark to market computation of some financial assets, for the purpose of computing regulatory capital. Exploring the terms and consequences of these norms would be beyond the scope of this work; this serves as an introduction to the striking difference between market capitalization of a bank and the value of its tangible book via balance sheet reading.
We summarize the evolution of the ratio market capitalization/tangible book for various financial European institutions in the appendix. Such comparison motivates the conclusion that the market has grown a sense of skepticism towards the regulatory and accounting reading of balance sheets. The introduction of a new metric which may address the concern of the market and
8 | A j o u r n e y t h r o u g h t h e c a p i t a l s t r u c t u r e o f t h e b a n k i n g s e c t o r provide guidance on how to manage the balance sheet of the bank (without accounting bias) is introduced in the second section of this work.
Volatility
Accounting and regulatory guidelines do not give a crucial role to volatility: yet an investor or a regulator should find this information very relevant for the purpose of evaluating a financial institution.
The most relevant capital measure from a regulatory point of view, Tier 1 capital, does not give volatility a crucial role: the main framework rotates around the accounting model as a representation of Assets and Liabilities values, according to a certain set of rules, at specific dates.
Recent turbulent times have shown instead that the most volatile times have been accompanied by a series of stress tests conducted to address the capital strength of the banking sector; Liquidity of financial institutions was particularly scrutinized due to the reluctance from the market to subscribe senior debt during the periods of highest volatility. In this introduction we are being very vague in relation to the concept of volatility: the author aims at motivating the importance of this input in managing the bank, from a liquidity and capital point of view; The second part of this thesis will specify variables apt to resemble the composition of assets and the volatility of such variables will be analyzed in detail.
This introduction motivates why capital management is ultimately about dealing with risk and measuring the adequacy of equity to represent a sizable buffer against the joint volatility of assets. When the risk of the assets explains poorly the variations in value of equity and it has a satisfactory explanatory power on debt, then senior issuance is no longer functioning as term liquidity provider only: as a consequence the bank may experience liquidity shortages. We will build on this intuition and on the subtle difference between solvency and illiquidity in the second and third chapter.
9 | A j o u r n e y t h r o u g h t h e c a p i t a l s t r u c t u r e o f t h e b a n k i n g s e c t o r
APPENDIX Divergence of Accounting versus Market Value
10 |L i q u i d i t y M a n a g e m e n t a n d C D S e v o l u t i o n i n 2 0 0 8 - 2 0 1 3
C H A P T E R 1 :
A F R A M E W O R K F O R L I Q U I D I T Y
M A N A G E M E N T A N D T H E E V O L U T I O N O F
S E N I O R D E B T D U R I N G 2 0 0 8 - 2 0 1 3 .
MotivationSince 2007 policy makers have been facing unprecedented times, which required their intervention in more than one occasion and sometimes jointly across different monetary areas. Liquidity within the banking system has played a crucial role in recent years: the banking system saw the intervention of regulators and sovereign states across the whole capital structure (in guaranteeing senior debt issuance and in subscribing shares/ subordinated debt). Debt, be it sovereign or private, is scrutinized in its sustainability and correction measures are being taken by sovereign states and by the banking system in a common aim of deleverage.
This study analyzes the crucial role of liquidity in a deleverage process and finds that under certain conditions central banks can no longer rely on an efficient transmission mechanism of their monetary input through the banking system. Rather than considering the latter a transmission tool, central banks try to preserve liquidity at critical level for the survival of the banking system.
Ultimately this work provides an answer to how important liquidity is for the purpose of explaining CDS levels in an economy characterized by a financial crisis, credit deterioration and deleverage.
For the avoidance of doubt this study will never adopt the term “Liquidity” to denote efficiency in the financial market with respect to the price of one particular instrument, but will always refer to the portion of the monetary base readily available to the banking system, as a cash reserve or for the purpose of redeeming debts.
11 |L i q u i d i t y M a n a g e m e n t a n d C D S e v o l u t i o n i n 2 0 0 8 - 2 0 1 3
Related Literature
This study contributes to, at least, two strands of literature.
The first one is represented by the field of studies investigating the determinants of CDS spreads, with a focus on the recent years of financial turbulence. The main contribution of this work is in the emphasis of the role of liquidity, meant as degree of cash availability, in explaining the evolution of CDS whose reference entities are Banks. Many other factors are identified by literature: Dieckmann and Plank (2010) find evidence that government CDS of various countries find explanatory variables in the country’s domestic financial system and the state of the world financial system (represented via variables respectively “Country Specific” and “Global”). Fontana and Scheiche (2010) identify the main determinants of the bond and CDS Spreads; they employ a lead-lag analysis for bonds and CDS to determine which market is more important in terms of price discovery. They also explore the evolution of the Basis between bonds and CDS, a variable which is also central in this work. The second strand of literature is related to the link existing between sovereign CDS and banks CDS. On this topic the main contribution of this work is in expanding such link from a regional viewpoint (typically literature investigates the link between government CDS and its local banks) to a more aggregated monetary area perspective. In emphasizing such wider approach we refer to “Global Consolidation” as the consolidation of the entire banking sector: we strive to draw conclusions (via an econometric approach) on the entire banking sector rather than a regional subset. Acharya et al. (2011) provide a model for the interrelation of banks and government credit risk. Focusing on the current financial crisis, Demirguc and Huiziniga (2010) find that banks CDS level react to the deterioration of public finances conditions. High levels of public debt hamper the support to the financial sector and too big to fail banks may turn into too big to be saved. Ejsing and Lemke (2011) investigate the relationship between Sovereign and Banks CDS via a common risk factor, i.e. the Itraxx CDS Index of non-financial corporations (this work instead will analyze the evolution of the Itraxx CDS Index of financial corporations and will adopt the Non-Financial index as one of the regressors to explain the evolution of financial CDS). Alter and Schuler (2012) investigate the interdependence of the default risk of several
12 |L i q u i d i t y M a n a g e m e n t a n d C D S e v o l u t i o n i n 2 0 0 8 - 2 0 1 3
Eurozone countries and their domestic banks. Knaup and Wagner (2009) have found that correlation between banks stock returns and an index of corporate CDS spreads provides a good indication of bank asset risk exposure during the financial crisis.
Another field of literature considers liquidity as a feature to take into account as a deviation from a frictionless market. This leads theoretical works to redefine self-financing trading strategies with additional restrictions on hedging strategies (Cetin, Jarrow and Protter). Liquidity may also be considered when defining a Liquidity Stochastic Discount Factor (Chen, Cheng and Wu, 2005, and Buhler and Trapp, 2006 and 2008). Other more empirical approaches consider liquidity as one of the risky factors to include in the framework of CAPM to explain the return of a portfolio of CDS contracts.
This work emphasizes a different meaning of liquidity and it does not consider it as just one of the factors to explain the CDS levels for the portion that cannot be related to credit risk: liquidity during the financial crisis is an important variable in explaining the levels of the CDS whose reference entities are the most levered players in financial markets: Banks and, in general, financial institutions. This angle of liquidity is also analyzed by Vento and La Ganga (2009), who deal with Liquidity in a perspective of risk management addressing the Bank Liquidity Risk Management in light of the market turmoil experienced in recent years. Angelo Baglioni deals with liquidity crunch in the interbank market (2009): his model can explain the phenomenon of “flight to overnight” in traded volumes and produce outcomes of high spreads between interest rates at different maturities.
Introduction
This work is an attempt to address some topics of central importance during the financial crisis:
Balance Sheet Deleverage
Debt Markets not capable of addressing the refinancing needs of the banking sector
Capital Structure
13 |L i q u i d i t y M a n a g e m e n t a n d C D S e v o l u t i o n i n 2 0 0 8 - 2 0 1 3
The role of monetary policy and its reliance on the banking system as a transmission mechanism
These topics will ultimately lead to addressing the main questions of this study: What is the role of liquidity in explaining the level of Banks’ CDS? For the portion not attributable to Liquidity are we dealing with systemic risk or simply an entity specific risk?
Economic models typically describe equilibrium as a point of convergence of different agents acting within an economy: one interesting aspect is to consider the forces into play after a shock. What exactly connects variables and how do they interact until economy stabilizes after the shock? The financial crisis unfolded in 2008-2012 can be conceived as a long (and harsh) adjustment process, often with the bold intervention of Central Banks and governments. Admittedly, analyzing a crisis from a financial viewpoint only is reductive since literature and intuition argues in favour of a crisis as a result of real and financial imbalances. Nevertheless, real variables take a long period to adjust and policy makers are left with the task of dealing with systemic risk and sustainability of the monetary areas: these issues sometimes need to be faced with a response far quicker than the structural adjustment of real variables.
The transmission mechanism is today the first concern when addressing survival of the system: the banking sector is indeed a transmission mechanism of both monetary inputs and deleverage policies.
Hence this study is composed by a simple theoretical framework where the key role is played by a liquidity constraint of the banking sector. We will impose a liabilities rolling constraint in the ordinary functioning of the banking sector. We will analyze the same liquidity constraint when the debt market does not clear. We will justify this event with a drop in profitability of the banking sector, such that the endogenous growth for equity is inferior to the endogenous growth of debt, thus forecasting an amount of equity far too low to protect bond holders from insolvency risk. Satisfying the liquidity constraint will be considered as the event of No Default: if the market for financial debt does not clear, the role of liabilities towards central bank will be crucial to avoid default. Such liabilities imply injection of liquidity, hence the liquidity may have an explanatory value on
14 |L i q u i d i t y M a n a g e m e n t a n d C D S e v o l u t i o n i n 2 0 0 8 - 2 0 1 3
probabilities of default. We will show whether this intuition is confirmed by a linear regression model applied to a set of financial data.
How realistic is that Return on Equity for Banks may be lower than interest paid to roll liabilities? If this were the case, the capital structure would evolve endogenously towards a higher percentage of debt: this inevitably will be discounted by financial markets when pricing Debt and when subscribing new issuances. When Equity estimated by the market is too low compared to the stock of debt, the debt market no longer clears (this ultimately is the event of an excessive leverage).
The transmission mechanism proposed here is that a suboptimal capital structure causes a rise in the CDS of the bank, and a decrease in the speed of growth of equity (due to profitability reduction). A necessary condition for a bank capital structure to be stable (hence resilient to shocks) is that speed of growth of equity is equal or higher (within a certain timeframe) than the debt growth rate. If such necessary condition is not satisfied, the market prices a reduction of the equity percentage in the capital structure: financial debt is then forecast to bear equity risk. Market may then not clear, in the sense that no demand can absorb the supply of the financial debt which is meant to be rolled to finance imminent redemptions. In a framework where the level of CDS is assumed to be the credit spread for the new issuance (when the market for financial debt clears), financial CDS rise with a strong signalling power for central bank. Central bank then is called to assess how sound the transmission mechanism of monetary policy is. Intervention by the central bank is crucial in shaping the future capital structure of the bank, by controlling the refinancing rules. By setting a credit spread for refinancing below CDS, central bank addresses the problem by reducing the speed of growth of debt, thus not compressing the percentage of equity relative to debt.
By enlarging or reducing the set of constraints in defining the refinancing rules, the central bank influences the forward capital structure of a bank. The incentive for the central bank to intervene is mainly in preserving an orderly transmission mechanism of monetary inputs: a capital structure controllable in its evolution does not force management to a drastic deleverage (as a way to implement a debt reduction).
15 |L i q u i d i t y M a n a g e m e n t a n d C D S e v o l u t i o n i n 2 0 0 8 - 2 0 1 3
In this work we show that the liquidity availability for financial institutions is one of the explanatory variables for levels of CDS. The ability to satisfy liquidity constraints then influences the probability of default of the entire European banking sector, due to the strong interconnection of the liquidity conditions across banks. Hence the contribution of this study is in emphasizing that a probability of default can be explained via systemic variables not immediately attributable to the insolvency of one specific bank: one of these systemic variables is the liquidity available to the banking sector. If variations across time of CDS levels could be explained by systemic variables, then the approach to liquidity and solvency by addressing such themes to the specific financial institution is arguable. We will explore in depth this theme m in chapter 2 and 3.
Modeling Banks’ Capital Structure
We represent the assets of a bank as a sequence . Every year there will be a decision made by management on the amounts of new loans and financial assets which we will denote by the sequence . Every year some of the assets will redeem in a certain percentage of the total Nominal Amount of the assets. Such percentage of the assets redeeming will be denoted by a(t) . Also, some assets will have to be impaired by a certain percentage , so that in a year the amounts of assets on balance sheet are
1
Hence the evolution of the assets is described by (not including cash in the category “assets”1)
{ }
Such assets are financed with a mixture of liabilities, namely : Deposits at time t
: Bond outstanding at time t
: Liabilities against the central bank at time t
16 |L i q u i d i t y M a n a g e m e n t a n d C D S e v o l u t i o n i n 2 0 0 8 - 2 0 1 3 : Capital at time t
As with assets, every year there will be an amount of issued bonds redeeming and new bonds issuance. For this reason the amount can be re-written as the sum of all past issuance from time until time t. We are implicitly assuming that the past years contribute to the stock of issued bonds. Whereas all bonds issued more than years ago redeemed, the stock of current liabilities, B(t) is described by the following
∑
Similarly, assets are mainly legacy from past investment decisions: namely last years contributed to the new composition of assets, so that the stock of assets is given by the sum of the investment decisions from time until time t
∑
The bank typically runs a transformation of maturities from liabilities to assets, in the sense that we should expect that the maturity of the assets be higher than the maturities of the liabilities. This maturity gap will prove of crucial importance when the banking system goes through a financial crisis: we will explore this aspect in a section below, when analyzing the liabilities rolling constraint.
A given set of liabilities as represented above will originate a certain profit for the year: we will assume that the bond issuance produces a cost of Euribor2 +
CDS, where CDS is the credit default swap of the issuer, at the time of issuance. Euribor may be defined as the rate of interest at which panel banks borrow funds from other panel banks, in marketable size, in the interbank market, for short term maturities. Hence CDS may be considered, for the purpose of this model, the additional cost for securing term liquidity.
2 Euribor may be replaced by an analogous short term rate valid in monetary areas other than
Euro. The rationale does not change: we are assuming that the cost of issuing debt is Short term rate + CDS, where CDS is the credit default swap level for the reference entity selling its own debt.
17 |L i q u i d i t y M a n a g e m e n t a n d C D S e v o l u t i o n i n 2 0 0 8 - 2 0 1 3
From the description of the liabilities above, then the actual cost paid by the bank for its bond issuance is given by a historical average of the CDS levels over the last years. We will denote such average across past years as The assets are a differentiated pool of credits towards various sectors of the economy, hence yielding a spread of ; is the level of the
average CDS across all industrial and financial names (denoted as ) over
the past years. Clearly the bank may include among its assets credits towards firms which may not be reference entities in the CDS market: we are implicitly assuming that the CDS market may provide a proxy for the yield of assets by observing the average level of all traded CDS (therefore obtaining a diversification that the assets of a bank may achieve while granting credit). Similarly, the cost for the liabilities is given by the sum of Euribor and ;
the latter is an average across the past years of the level . More formally, for all s between
2
= ∑ And
3
= ∑
Deposits and Central Bank Financing
For the sake of simplicity we will consider the cost for liabilities composed by Deposits equal to Eonia3. Eonia, for the purpose of this work, is to be defined as
the weighted average of overnight Interbank Offer Rates for inter-bank loans. The liabilities against the central bank will instead produce a cost of v(t).
Central banks publish criteria to distinguish assets that may represent an admissible guarantee when the bank requires financing. Assets that comply with
3 The notation so far introduced clearly shows that the author is primarily thinking of European
variables: yet it is easy to generalize for every monetary area to find the equivalent rate with identical meaning.
18 |L i q u i d i t y M a n a g e m e n t a n d C D S e v o l u t i o n i n 2 0 0 8 - 2 0 1 3
such criteria are denominated “Elegible Assets”: such criteria then lead to identifying a fraction of the assets, to be denoted4 as ρ, which represents
admissible collateral for repo transactions with the central bank. A higher number of eligibility criteria means a restrictive policy input. On the contrary, relaxation of parameters and longer tenor available for repo transactions represent an accommodative policy input. In this model such monetary input, in the form or number of eligibility criteria will be summarized by the variable ρ ( ).
Deposits include liabilities versus the retail sector, redeemable with no notice. They also include unsecured lending in the interbank market and repo transactions with collateral where a repo market has developed5.
The purpose of this study is to consider the banking system as an aggregate sector, hence the interbank deposit market will not be considered when evaluating the tools for liabilities management of the consolidated banking sector.
Deposits are by far the cheapest and the most stable6 liability for the banking
sector. This study will focus on the difficulties arising when debt issuance is no longer a tool for the purpose of liability management. Modeling a deposit run would be beyond the purpose of this work: a deposit run, if assumed against the entire banking sector would produce the collapse of the banking system and financial markets. We would thus enter the field of tail events, which calls for extreme measures of economic policies. Modeling such scenarios, dominated by frictions and panic is a pure theoretical exercise, which would be of no use in this framework.
We will then write the profit, as determined every year when publishing financials as
4 Such percentage of assets is referred to the “counterbalance capacity” in the banks’ portfolio. 5Typical repo markets where the banking system can enter repo contracts have as underlying
assets government bonds; similar markets exist for quoted stocks when the stock lending activity has reached a certain relevance.
6 Maybe it would be more appropriate to write the least unstable, especially when compared with senior debt.
19 |L i q u i d i t y M a n a g e m e n t a n d C D S e v o l u t i o n i n 2 0 0 8 - 2 0 1 3
4
[ ] [ ]
The reader may argue that the banking system may not use the full amounts of refinancing facilities offered by the central bank; hence the amount of assets refinanced may be lower than ρ. We would need then to introduce a different notation for the portion of assets actually refinanced with the central bank within this general framework. We avoid doing so since the model will soon focus on condition of distress of the financial markets, and the first reaction of the banking system is to use the central bank facilities at maximum potential as we will discuss below.
C is a generic cost that is not linked to the capital structure and to the investment decisions of the bank. Within this framework the potential profit for the banking system depends on the evolution of relative to .
When such difference decreases, financial markets question the capability of the banking sector to produce profits in the foreseeable future. Reluctance to subscribe financial debt with long maturities follows, which leads to levels of closer and closer to . Higher levels of Financial CDS typically are
correlated with high levels of , a further reason for disputing the future profitability of the banking sector. This theme will be analyzed in more detail in the next paragraph.
No clearing Price for debt
We have analyzed how to decompose the profit for year t into revenues from the assets and costs on liabilities.
The market will cast a doubt on the sustainability of the capital structure when observing the yield of assets approaching the cost of liabilities. In this section we will ignore the operational/ administrative costs of a bank, a variable beyond the purpose of this study.
The market will then be reluctant to show a demand for financial debt when the difference between the credit spread on the assets and the credit spread on the issued debt (respectively and ) is too small. A market confident
20 |L i q u i d i t y M a n a g e m e n t a n d C D S e v o l u t i o n i n 2 0 0 8 - 2 0 1 3
reader would argue at this point that the market will adjust the price, i.e. the CDS level, to make sure that a certain supply for debt will find a price where to clear. Financial debt though is not like any other good, due to its systemic relevance and to the link implicitly existing with real economy. High yielding debt can be sustainable only via high yielding assets: this is at odds with low growth economies7, typically made of firms with low ROE (on average), thus not capable
to afford high interest rates on loans and credit granted by the banking sector. When management cannot issue debt with an appropriate maturity the tenor of liabilities is shortened, in the attempt to reduce the cost for securing liquidity: this leads to increase the risk that even higher amount will have to be issued in the future, with a significant risk that supply in the future be not met by available demand.
In a more analytical framework the market evaluates the financial sustainability of assets and liabilities by comparing financial revenues and costs to be associated to the current stock of assets and capital structure. It is reluctant to subscribe financial debt if
[ ] [ ]
Where k is to be interpreted as a minimum return on assets after costs. If we divide both sides by the amount of assets, then
5
[ ]
Where is the percentage of assets financed by debt issuance, , and is the percentage of assets financed by a stock of deposits. The relevance of these ratios is not only emphasized here, but also common market reports consider the importance of “Loans to deposit ratios” when publishing relevant summary statistics. The condition above can be rewritten as
7 The financial crisis experienced since 2007 is mainly located in highly developed countries, where
it proves impossible to sustain a high cost of debt given the low growth of underlying economies. We do not consider here scenarios of high inflation.
21 |L i q u i d i t y M a n a g e m e n t a n d C D S e v o l u t i o n i n 2 0 0 8 - 2 0 1 3
6
[ ] [ ]
Where we have defined
, i.e. the leverage factor in the balance sheet.
Some important aspects to note at this stage are the following. The simple rule of a minimum profitability of the banking sector so that debt issuance may have a clearing price ultimately depends from a number of important variables. We will briefly comment on some of them
i. d(t) or the depreciation of assets is a random variable whose values are particularly high during economic crisis. Particularly high values could see the condition above satisfied.
ii. λ(t) is introduced in static terms as a ratio; in a previous work the author has explored its endogenous character and its dependency on the evolution of the credit market. During a financial crisis, leverage increases due to the drop in value of the assets8.
iii. and its evolution compared to : Both these variables can be approximated, from an empirical point of view, as a moving average. The former is the moving average over the last of a basket of the most liquid CDS traded, with no distinction for the industrial sector where the reference entities belong to. The latter is a moving average over the last years of all CDS whose reference entities are financial institutions. The reason why we look at a financial index rather than the CDS of one issuer only is because the financial crisis is affecting the entire banking sector and conclusions for a specific issuer could be biased by the specific situation and events proper of one financial institution only.
8 This aspect is explored in length in “Optimal Capital structure of a bank: the role of asymmetry of
22 |L i q u i d i t y M a n a g e m e n t a n d C D S e v o l u t i o n i n 2 0 0 8 - 2 0 1 3
Credit indices: Evolution and Impact on the Profitability of the Banking Sector
This brief section aims at describing the evolution of CDS in recent years, for the purpose of providing an intuition on the higher costs of the financial sector in managing their liabilities, compared to a small increase in the yield of the assets (for their portion redeeming, hence rolled with higher yields). It is evident that even if assets and liabilities were due and rolled in the same amount, then the increase of the Itraxx financial senior since 2008 means a drop in profitability of the banking sector (if the index can be considered as a proxy for the cost of liabilities and the yield of assets may be represented by the index Itraxx Europe Main9). This is witnessed by the substantial decrease in the net Interest Margin10
of the banking sector, ultimately leading to a downgrade of profit forecast and to the unattractiveness of the financial sector for investors. We have assumed above that the actual profit for a bank depends on the evolution of a backward looking average of CDS. Also the cost of liabilities is backward looking, since liabilities still due at time t may have been issued various years ago. From an empirical point of view it is easier to observe the evolution of the CDS with no average over past years, in the understanding that the number of years to look back for liabilities is typically lower than the number of years required for the assets11. Hence we have that a higher cost of debt issuance, even if matched by
an identical move on the yield of assets available in the market, affects negatively the Net Interest Margin of the bank and reduces profits. If instead the rise in financial CDS is higher than the movement in non financial CDS we can conclude a fortiori that such scenario is negative for the banking sector, even without considering that the effective cost of liabilities depends (likewise for the assets) on a backward looking average. The more such move (rise in the difference between financial and non financial CDS) takes place, the more likely it is that the market may move towards a state described as “no clearing price for debt”.
9 More detail on the composition and the rationale of construction of the indices is provided in the
empirical section and the appendix of this work.
10 Net interest margin (NIM) is a measure of the difference between the interest income generated
by banks and the amount of interest paid out to their lenders, relative to the amount of their (interest-earning) assets. It is similar to the gross margin of non-financial companies.
11 Due to the transformation of maturities proper of the banking balance sheet, we would expect
that assets are financed with shorter dated maturities liabilities. Hence the Rolling speed of liabilities is typically higher on liabilities, if compared to the assets.
23 |L i q u i d i t y M a n a g e m e n t a n d C D S e v o l u t i o n i n 2 0 0 8 - 2 0 1 3
Figure 1:Financial senior index evolves to levels superior to Itraxx main, thus confirming that liabilities for the financial sectors are turning more expensive than the rise in yields of the assets.
The graph above (source: Bloomberg) shows indeed that the financial CDS (white line) has evolved, since 2010, drastically higher than the average of all Most liquid CDS. Figure 1 plots the evolution of the European (Euro denominated) indices in the family of Itraxx Indices. Itraxx financial senior (white line) and Itraxx Main Europe (red line) are here considered representative of, respectively, the average cost of the liabilities for the European banking sector (to be added to Euribor rates) and the average yield of the assets for a diversified pool (Itraxx Main is to be added to Euribor, too). Descriptions of such Indices are in the appendix.
Liabilities Rolling during a Financial Crisis
Every year some previously issued bonds are due for redemption. During ordinary times it would be realistic to assume that financial markets would determine a price for the new issuance so that demand is equal to supply.
24 |L i q u i d i t y M a n a g e m e n t a n d C D S e v o l u t i o n i n 2 0 0 8 - 2 0 1 3
We have determined that high debt interests may reduce the trust in the banking sector; hence management may be forced to plan the evolution of the capital structure with limited or no recourse to debt issuance.
The general constraint is
For the sake of simplicity we assume that deposit will not change from one year to another and that there will be no rights issuance12. Hence
Hence the minimum 13 amount to issue at time t, is equal to
7
[ ]
Such minimum amount to issue is immediate to interpret: further debt issuance is required for the debt due for redemption at time t; it is decreased by the assets redeeming their capital (in the amount which was not eligible for refinancing with central bank); new issuance is also required for the non eligible portion of new investments.
During last four years there were various periods when no issuer could approach the primary market14, a fact described within this framework as “debt markets
not clearing conditions”. In light of these difficulties management may be forced to set equal to zero or to start a deleverage program, which in most cases
12 Even if we assumed that in a financial crisis Deposit reduced their amounts, then results would
not change substantially. The reader could also argue that a variation in equity is produced by Profit/losses realized. To make the analysis consistent with a variation in equity due to losses or profit realized within the period, then we would not change the main conclusions of this work. In periods of financial crisis the profits are very low if not negative (losses): hence, if anything, the conclusions are even stronger when we derive the minimum amount of debt to issue compatible with the equilibrium in the evolution of the balance sheet.
13 Management could issue more debt than such minimum, for various reasons: for prudential
reasons or because it forecasts that soon too many redemptions will be due.
14 As in all definitions of primary markets, here the primary market for financial debt is the market
that changes the supply and introduces new debt freshly issued by the bank. The secondary market is where such debt, along with all existing (and older) issues trade at so called “secondary market price”.
25 |L i q u i d i t y M a n a g e m e n t a n d C D S e v o l u t i o n i n 2 0 0 8 - 2 0 1 3
requires that the bank accept to sell assets at discounted value: indeed the market will determine the value of an asset also computing a liquidity premium, due to the structural search of liquidity and to the supply of illiquid credit from the banking sector.
Until this point we have analyzed all variables from a financial point of view, in a framework that makes an attempt to model evolution of assets and liabilities through time. From a broader perspective equal to zero is ultimately a reaction of the banking industry which transmits a deleverage system to the real economy: a central bank is thus losing control of the transmission mechanism of monetary policy. A crunch in financial liabilities is generating a credit crunch immediately transmitted to the real economy.
Event of Default and Maturity Gap
A default is typically defined as the event that the value of the assets be lower than the value of liabilities. In a scenario characterized by non clearing market conditions, then the deleverage impulse is such that the condition of default, which relates to the value of assets, cannot even be assessed due to the illiquid prices of loans & receivables. When the debt market cannot achieve a clearing price for financial debt, then condition for default is that liabilities can no longer be rolled or just redeemed. Market players, in scenario of not clearing price for financial debt, scrutinizes the distribution of maturities for debt issued until that date.
We define
∫
so that at time t the bank faces in the next s years an amount of debt to redeem equal to
We define also
∫
26 |L i q u i d i t y M a n a g e m e n t a n d C D S e v o l u t i o n i n 2 0 0 8 - 2 0 1 3
so that at time t the bank faces a natural reduction in assets in the next s years (due to redemptions) equal to .
We also define a random variable which represents the percentage of losses (due to impairment, defaults and deterioration of the loans and receivables portfolio) on the aggregate occurring from time t until time t+s. Then managing liabilities from time t until time t+s means imposing that the minimum issuance required from time t until time t+s, ,
[ ] Default is the event
[ ] The maturity mismatch typical of the banking sector is such that liabilities have a shorter maturity than assets. In terms of the framework here adopted, this translates into
Hence if financial markets were operating in the scenario of “no clearing conditions for financial debt”, then and as a consequence management sets ; then the default condition would be
8
[ ]
This condition of default emphasizes that the typical mismatch in maturities run by a bank between assets and liabilities implies that a default takes place in case of closure of the market for debt issuance. We will explore the central bank reaction below via a change in the parameter ρ.
The reader may argue that these strong conclusions find mitigation with the consideration that bonds are eventually subscribed by the banks customers, i.e. sold to retail. The industry indeed makes a strong differentiation between retail and wholesale issuance. For the purpose of this model, bonds issued to retail should represent a percentage of the aggregate here denoted as D(t). Retail customers accept a lower yield in view of their limited information and
27 |L i q u i d i t y M a n a g e m e n t a n d C D S e v o l u t i o n i n 2 0 0 8 - 2 0 1 3
knowledge. Their wealth, be it under the technical form of Deposits or retail bonds, tends to be a stable liability of the bank which, for this reason, is categorized under the form of deposits in this simple framework of liabilities management.
Central Bank reaction
When the market moves towards no clearing conditions in the financial debt market, then the central bank is forced into action to avoid a major liquidity restriction (practitioners typically refer to “credit crunch”) in the banking and real sector.
Central bank then evaluates the possibility of relaxing refinancing parameters to avoid a default.
We have already analyzed that when the market scrutinizes the capability of the banking sector to roll liabilities, then probability of default in the next s years may be written as15
9
{ [ ]} During a financial crisis risk aversion and the attempt by management to decrease the probability of default encourages to choose , especially when experiencing severe stress due to the difficulty to issue and place new financial debt. On the other hand a period of distress requires that policy makers intervene with accommodative measures: monetary policies rely, for the transmission mechanism of accommodative inputs, on the banking system, which, instead, is transmitting a restrictive output16.
The central bank then reacts to the estimated probability of default (in the formula above) by changing the parameter to ̃.
On one side the central bank needs a functioning transmission mechanism, which requires a low probability of default; on the other lowering such
15 Here P{.} denotes the probability of an event. We will not specify any probability distribution;
adding formal introduction of such Probability function does not add strength to the conclusions of this study.
16 is indeed the failure of transmission in monetary policy since an accommodative
monetary input (central banks are intervening for the survival of the system) turns into a deleverage signal to the economy (A(t) decreases).
28 |L i q u i d i t y M a n a g e m e n t a n d C D S e v o l u t i o n i n 2 0 0 8 - 2 0 1 3
probability of default moves credit risk from the balance sheet of the bank to the central bank balance sheet17.
If the primary market for financial debt is completely inactive (as per conditions of no clearing price for financial debt), then the expected value of is zero and the central bank is called to set ρ as a tool of monetary policy. For and a change of monetary policy from to ̃, then probability of default is
10
{ [ ] ̃ }
Such a definition of event of default shows the crucial role of liquidity: ̃ is the amount of liquidity injected in the system (as a percentage of assets) by monetary policy.
The last probability of default well summarizes the conclusion of this work (to be tested empirically in the econometric section below): probability of default decreases with high level of liquidity injection chosen by central bank (and viceversa).
Hence the author will move now to an empirical approach aimed at assessing such linkage between financial CDS levels and amount of liquidity existing in the system. If confirmed by data, such relationship will emphasize the transmission mechanism existing from monetary policy to CDS levels of financial institutions. Liquidity may also be seen then as a tool to avoid default, hence with an immediate consequence on financial CDS. In this light a high level of the CDS of financial institutions is to be interpreted also as an unhealthy transmission mechanism. A central bank may then intervene to make sure that the level of liquidity is such that failure to pay is not met on a daily level due to a liquidity shock.
Probability of default will approach zero for ̃ sufficiently high: a monetary policy made in terms of rules on eligible collateral rather than changes in interest rates
17 The central bank, compelled to lower the probability of default of the banking system, will see
the size of its balance sheet increase: sometimes central bank interventions are measured by the amount of the assets on central bank balance sheet (evaluated as a proportion to GDP)
29 |L i q u i d i t y M a n a g e m e n t a n d C D S e v o l u t i o n i n 2 0 0 8 - 2 0 1 3
does depict current years, where tenor of refinancing and enlargement of criteria to identify admissible collateral are key variables in monetary policies.
If a linear regression could explain the level of the index of financial CDS by means of variables explanatory of liquidity we could then exclude that financial CDS are pricing a default risk due only to idiosyncratic insolvency reasons. We could then conclude that financial CDS price the probability of default due also to a liquidity crunch, possibly arising from the effort to roll liabilities.
If such conclusions were deemed acceptable, a central bank should consider that only certain values of CDS are affordable by the banking sector. After a certain threshold, then the debt market can no longer clear and the central bank has to lower the value of CDS moving some leverage on its balance sheet, at least temporarily. It does so primarily by relaxing the refinancing parameters and by extending the maturity of such financing.
Meaning of Liquidity
Financial markets see the banking sector as one player across the wide range of institutional agents: the banking sector is active on bond issuance (supply) in various currencies; it is also buyer of various securities and participates to the repo markets with two main purposes: yield enhancement and liquidity management.
Liquidity is typically a concept relating to the efficiency of a particular market. In this work we mean instead the cash position of the banking sector, meant as sum of cash reserves and credit lines available to pay for any kind of obligation: be it a cash versus settlement obligation (upon purchase of a bond, for example), or to face payment of capital/interest on outstanding self issued bonds. As such, liquidity is not an observable variable. Recently it has become the centre of attention for regulators and for management: yet financial market players can only make an inference on its level by observing variables presumably highly correlated with the evolution of liquidity.
Such variables, which we will briefly comment on, are i. Difference between Euribor and Eonia
30 |L i q u i d i t y M a n a g e m e n t a n d C D S e v o l u t i o n i n 2 0 0 8 - 2 0 1 3
ii. Level of CDS of a sovereign issuer versus the actual yield of the bond issued by the same issuer.
iii. Levels of the cross currency swap EUR/ USD.
iv. The difference in yield between inflation linked and nominal bonds, issued by the same entity.
Inference on Liquidity by Few Financial Variables
In this paragraph we provide the rationale why the variables listed above are deemed relevant estimators for the purpose of investigating the liquidity aggregates available to the banking sector.
Euribor and Eonia are two indices that are considered respectively proxies for the interbank deposit rate for maturities respectively 3 months (e.g. 3-month EURIBOR) and 1 day, in case of Eonia. These parameters have daily fixings and a longer maturity is the reason for different rates especially in scenarios of high risk aversion. In a world where the health of the banking system is not questioned then we would expect that such difference be stable and not large. A negligible magnitude of such difference and a low volatility (of the latter) were features of the financial markets prior to 2007. The degree of financial distress is typically summarized in industry research and ECB papers18 by means of graphs
summarizing the evolution of such difference. The picture below is included in the work by Michele Lenza, Huw Pill and Lucrezia Reichlin published in the working paper series released by ECB.
18 See for example “Monetary policy in exceptional times”, October 2010, in working paper series
31 |L i q u i d i t y M a n a g e m e n t a n d C D S e v o l u t i o n i n 2 0 0 8 - 2 0 1 3
Figure 2: from “monetary policy in exceptional times”, ECB working paper series no 1253
In this study we deem the difference between Euribor and Eonia as one of the variables to infer on the liquidity available in the system. We use, though a more forward looking measure of it, since we do not necessarily need to make inference on the liquidity available for one day only, but we investigate what the market estimates on the average evolution of liquidity for a horizon of 2 years. This approach reduces also the Fixing risk, i.e. the risk that the analysis may be misleading since some days may enter the sample with particularly high values due to a shock in liquidity which is 1 day only specific.
Financial markets quote the fixed rates financially equivalent to floating parameters for almost any tenor via swaps markets. These markets have proved reliable even during the core of the financial crisis. Hence rather than the difference on one day between Euribor and Eonia, we will analyze the difference between the swap rate equivalent to the parameter Euribor and the swap rate equivalent to the parameter Eonia. Both swap rates are considered for maturity 2 years and we thus obtain a measure forward looking at the evolution of liquidity for the next 2 years. The reason why we consider the tenor 2 years is
32 |L i q u i d i t y M a n a g e m e n t a n d C D S e v o l u t i o n i n 2 0 0 8 - 2 0 1 3
simply because swaps with 2 years maturity are exchanged in very large Notional Amounts, therefore making available data very reliable.
The second variable we will analyze to make inference on the liquidity of the banking sector is the difference existing between CDS of a sovereign state and the yield of securities issued by the same sovereign state for a maturity similar to the tenor of the CDS.
Whereas CDS reflect the actual risk of default, the securities exchanged in the market have a demand which depends not only by the risk-return trade off, but also by the liquidity available in the system. Furthermore credit default swaps are unfunded transactions, i.e. no upfront payment is required at inception (which makes their values not dependent by liquidity constraints of market agents)19. Bonds purchases instead require the payment of the price. It is
intuitive that for large amounts of liquidity there will be a higher amount of investments into securities as opposed to the synthetic purchase by selling protection on Sovereign CDS. More importantly it is a fact that the CDS market and the securities market are segmented, i.e., for various reasons, a market player participating in the cash market may not participate into the CDS Market. Hence whereas CDS do reflect mostly the risk of default, then the cash market, compared to the CDS, is also driven by the liquidity available in the system. The difference between CDS and the yield of the bond with same tenor would not be very meaningful for sovereign states where the market does not generate a high number of transactions: for this reason (and the plethora of securities existing) we select an issuer whose debt is traded very actively. Among others we will consider the CDS whose reference entity is Republic of Italy and issued securities will be BTPS or “Buoni Poliennali del Tesoro”. We will consider the most traded maturity for CDS, 5 years, and we will compose a basket of BTPS whose average maturity is 4.5 years20. We will be cautious in considering BTPs
when monetary policy intervenes on the secondary market to stabilize prices: on
19 As a result of the standardization of CDS contracts, the premium running may be different from
the CDS levels. Such difference originates a difference of NPV which is settled upfront. Such amount is typically negligible if compared to the notional of the CDS and therefore the market activity on CDS cannot be considered affected on scarcity/ abundance of liquidity
20 The reason why we build a basket of 4.5 years and not 5 years (to match the maturity of CDS) is purely technical: the new issuance targets typically the benchmark 5 years(among others), hence on the day of issuance there would be a jump from the basket to the newly issued bond, which typically trades at premium to encourage investors to new subscriptions. This jump may bias the econometric analysis.
33 |L i q u i d i t y M a n a g e m e n t a n d C D S e v o l u t i o n i n 2 0 0 8 - 2 0 1 3
that particular period we would have prices affected by the central bank interventions. This explains why for the second part of the sample we present more than one regression, both adopting and discarding the Italy basis as a regressor: on one hand we wish to produce results comparable with the first part of the sample; on the other we fear that the central bank intervention may bias the meaningfulness of the regression. Once we drop the Italy Basis, we will consider instead the Germany basis, which instead cannot be considered in the beginning of the sample since CDS on Germany was traded very rarely before 2009.
The third variable we will use in the effort to make an inference on the liquidity available for the financial system is the level of cross currency swaps quoted in the market. A cross currency swap is a derivative instrument where 2 parties exchange a principal amount at inception and at maturity21, denominated in 2
different currencies. The parties exchange interest payments on the two different currencies. If the 2 currencies were EUR and USD, then the counterparty paying USD principal at inception would receive libor and pay Euribor plus the so called “cross currency basis”22 for the life of the swap. In
practice the cross currency swaps are quoted in terms of spread over the benchmark rate for the leg other than USD. In simpler terms the market deviates from a theoretical value of zero and the party paying a benchmark rate plus a positive spread is receiving, on the initial exchange of notional, a currency with a structural higher demand than the one paid at inception of the swap. In intuitive terms, during periods of financial crisis foreign currency denominated liabilities may be even more problematic to manage (and roll) than domestic currency denominated ones. Hence some issuers sometimes address their demand for foreign currency by tapping into the cross currency market. This market allows them to exchange foreign currency with domestic currency. This is achieved by entering a swap where the bank receives foreign currency at inception versus paying domestic currency (initial exchange of notional). This initial transaction is reversed at maturity of the swap; during the life of the swap parties exchange interest on the notional borrowed.
21 So called initial and final exchange of notional. 22 Or “Cross Currency Level”